Monitoring GraphQL APIs with OpenTelemetry
GraphQL is a query language for APIs developed by Facebook in 2012. It was then open-sourced in 2015. GraphQL enables frontend developers or consumers of APIs to request the exact data that they need, with no over-fetching or under-fetching. In this article, we will learn how to monitor GraphQL APIs with OpenTelemetry and SigNoz.

GraphQL has become a popular alternative to REST because of its ease of use. It enables developers to pull data from multiple data sources in a single API call. Usually, GraphQL serves as a single entry point to the server, and as such, monitoring your GraphQL API is critical.
Some of the things that you want to monitor about your GraphQL APIs are as follows:
- GraphQL query
- GraphQL resolver
- Tracking the query performs with distributed tracing
In this article, we will use SigNoz, which uses OpenTelemetry as an instrumentation layer to monitor GraphQL APIs.
Using OpenTelemetry to monitor GraphQL APIs
What is OpenTelemetry?
OpenTelemetry is an open-source vendor-agnostic set of tools, APIs, and SDKs used to instrument applications to create and manage telemetry data(logs, metrics, and traces). It aims to make telemetry data(logs, metrics, and traces) a built-in feature of cloud-native software applications. It is a project under CNCF with huge community backing.
What is instrumentation?
Instrumentation is described as the process of enabling your application code to generate telemetry data. OpenTelemetry provides client libraries for instrumentation. It also provides many auto-instrumentation libraries that generate and capture telemetry data for common frameworks and protocols without making any code changes.
By using OpenTelemetry libraries, you can monitor application code written in almost any major programming language.
Using OpenTelemetry GraphQL library
OpenTelemetry provides a library to monitor GraphQL APIs. The library will monitor your GraphQL queries without any code changes. OpenTelemetry libraries are used to generate and capture telemetry data.
Once the data is captured, it needs to be sent to a backend tool of your choice for storage and visualization. We will send the monitoring data captured by OpenTelemetry from the GraphQL application to SigNoz, an open-source APM tool.
Running a sample GraphQL application with OpenTelemetry
Pre-requisites
- Node JS above 12
- SigNoz
Installing SigNoz
SigNoz can be installed on macOS or Linux computers in just three steps by using a simple install script.
The install script automatically installs Docker Engine on Linux. However, on macOS, you must manually install Docker Engine before running the install script.
git clone -b main https://github.com/SigNoz/signoz.git
cd signoz/deploy/
./install.sh
You can visit our documentation for instructions on how to install SigNoz using Docker Swarm and Helm Charts.

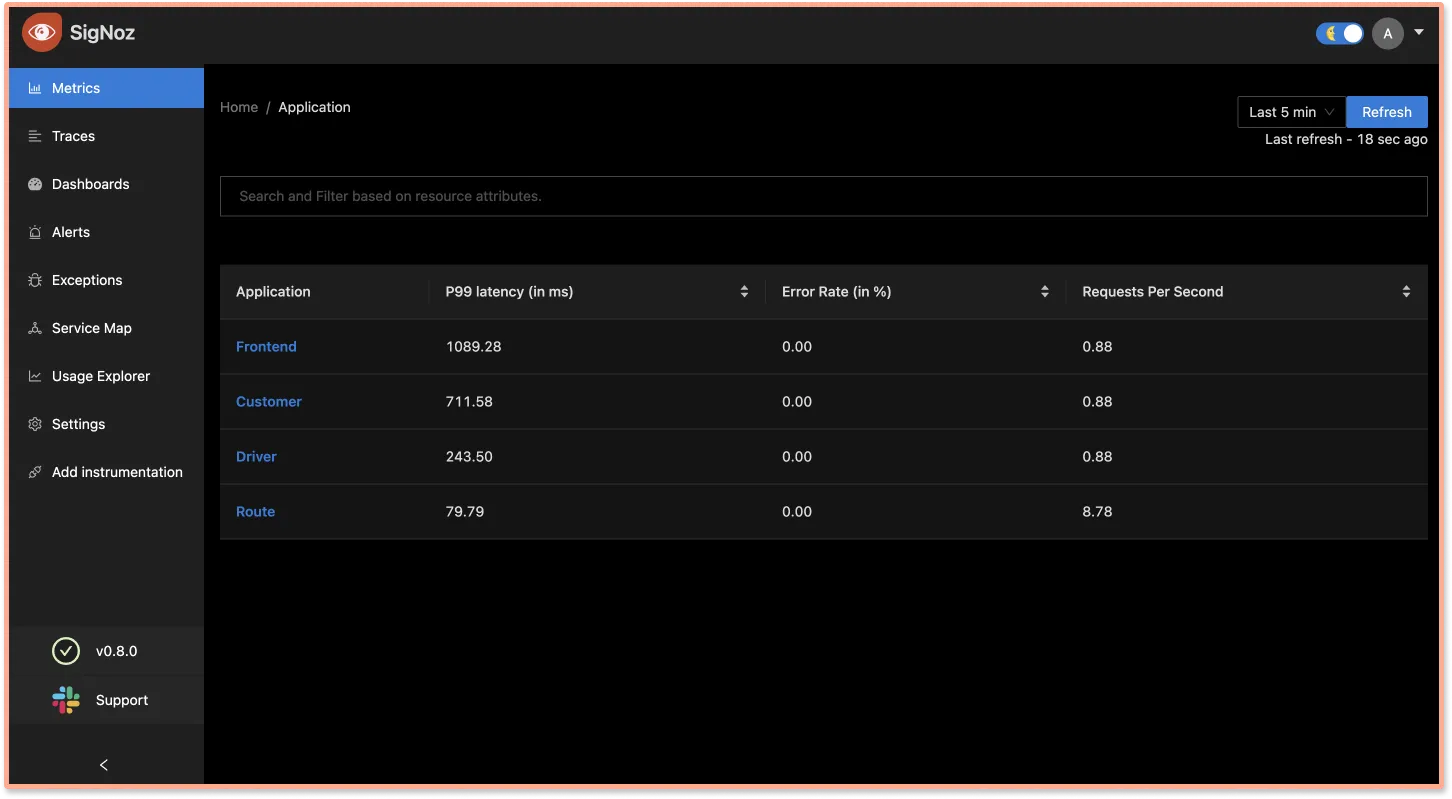
When you are done installing SigNoz, you can access the UI at http://localhost:3301/application
Running sample application
Below are the steps to run the sample GraphQL application with OpenTelemetry.
Clone sample GraphQL app repository and go to the root folder
We will be using a sample GraphQL app at this GitHub repo.git clone https://github.com/SigNoz/graphql-opentelemetry-sample.git cd graphql-opentelemetry-sampleInstall the required dependencies
You can check out the depencies required frompackage.jsonfile. Install all the required dependencies for the sample application usingnpmnpm installOpenTelemetry needs the following packages to instrument the GraphQL app.
"@opentelemetry/api": "^1.0.3",
"@opentelemetry/auto-instrumentations-node": "^0.25.0",
"@opentelemetry/exporter-otlp-grpc": "^0.26.0",
"@opentelemetry/instrumentation-graphql": "0.27.4",
"@opentelemetry/resources": "^0.24.0",
"@opentelemetry/sdk-node": "0.27.0",
"@opentelemetry/sdk-trace-base": "^1.0.1",
"@opentelemetry/sdk-trace-node": "^1.0.1",
"@opentelemetry/semantic-conventions": "^0.24.0",
Configure instrumentation using tracer.js file
In order to instrument our GraphQL APIs, we will create a singletracer.jsfile and use it to instrument the service. To capture GraphQL instrumentation, add the OpenTelemetry instrumentation GraphQL package. You can also configure some parameters based on your use-case.const sdk = new opentelemetry.NodeSDK({ traceExporter, instrumentations: [ getNodeAutoInstrumentations(), new GraphQLInstrumentation({ allowValues: true, }), ], resource: new Resource({ [SemanticResourceAttributes.SERVICE_NAME]: serviceName, }), });We need to initialize OpenTelemetry before your application gets loaded. If your application begins requiring packages before OpenTelemetry is set up, it can create issues. You can initialize OpenTelemetry by using the code as shown below:
const init = require("./tracer");
init("graphql-service");
A sample tracer.js file is provided in the GitHub repo here. Note the lines that should either be deleted or uncommented based on the application need.
Setting up SigNoz as the OpenTelemetry backend
To set up OpenTelemetry to export telemetry data, you need to specify OTLP (OpenTelemetry Protocol) endpoint of a backend tool like SigNoz. It consists of the IP of the machine where SigNoz is installed and the port number at which SigNoz listens.OTLP endpoint for SigNoz -
<IP of the machine>:4317If you have installed SigNoz on your local machine, then your endpoint is
127.0.0.1:4317.Run the GraphQL service
OTEL_EXPORTER_OTLP_ENDPOINT=127.0.0.1:4317 \
OTEL_RESOURCE_ATTRIBUTES=service.name=graphql-service \
node -r ./tracer.js index.js
Open GraphQL interface at
http://localhost:4000/graphql
Monitoring GraphQL APIs with SigNoz dashboards
You need to generate some data to see how traces captured in the SigNoz dashboard.
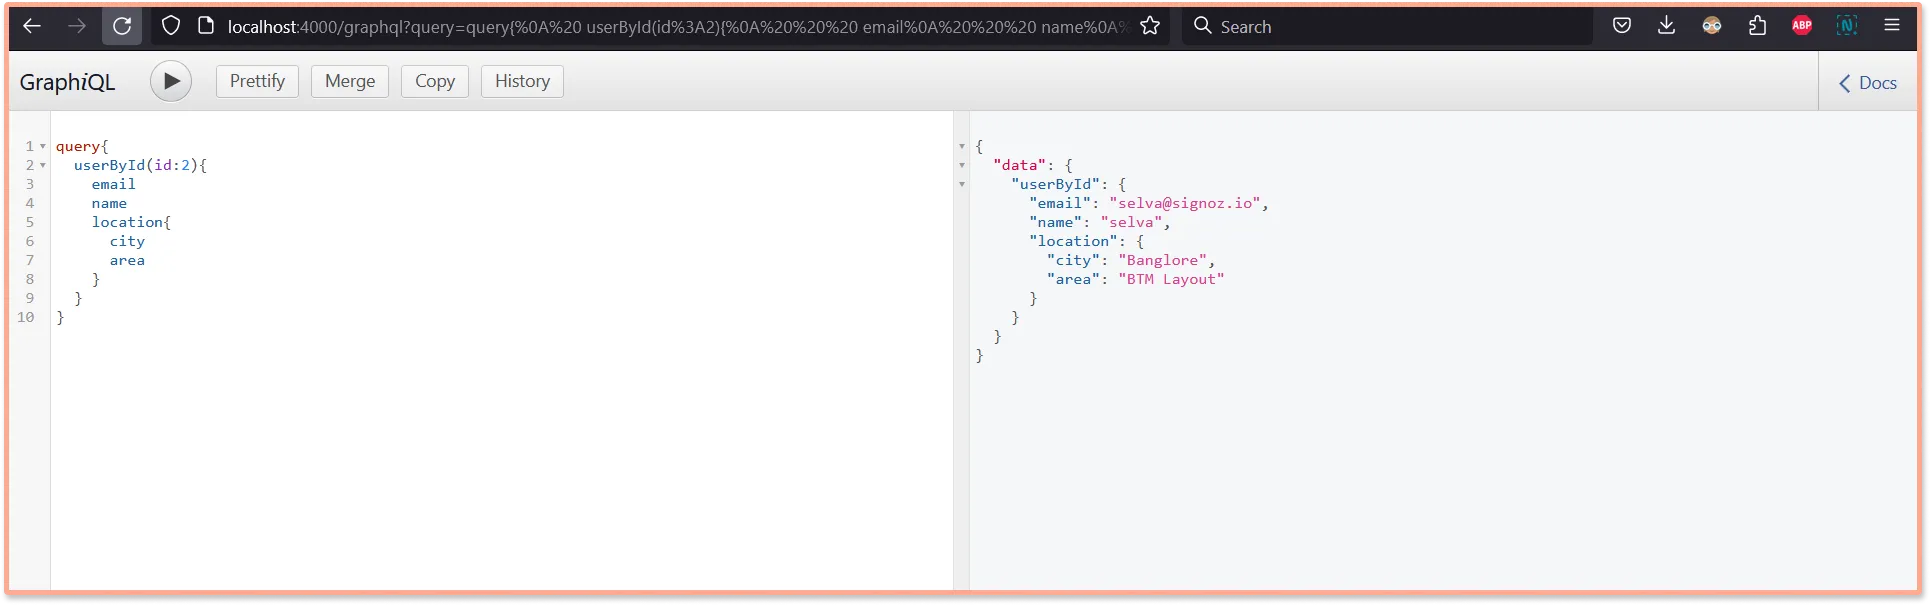
Run the below graphql query in GraphQL interface at http://localhost:4000/graphql. You can make a bunch of calls so that it generates some monitoring data to be explored on the SigNoz dashboard.
query{
  userById(id:2){
    email
    name
    location{
      city
      area
    }
  }
}
Now, open the SigNoz dashboard in your browser at http://localhost:3301/dashboard. You should now be able to notice Graphql-service in the list of services being monitored on the dashboard.
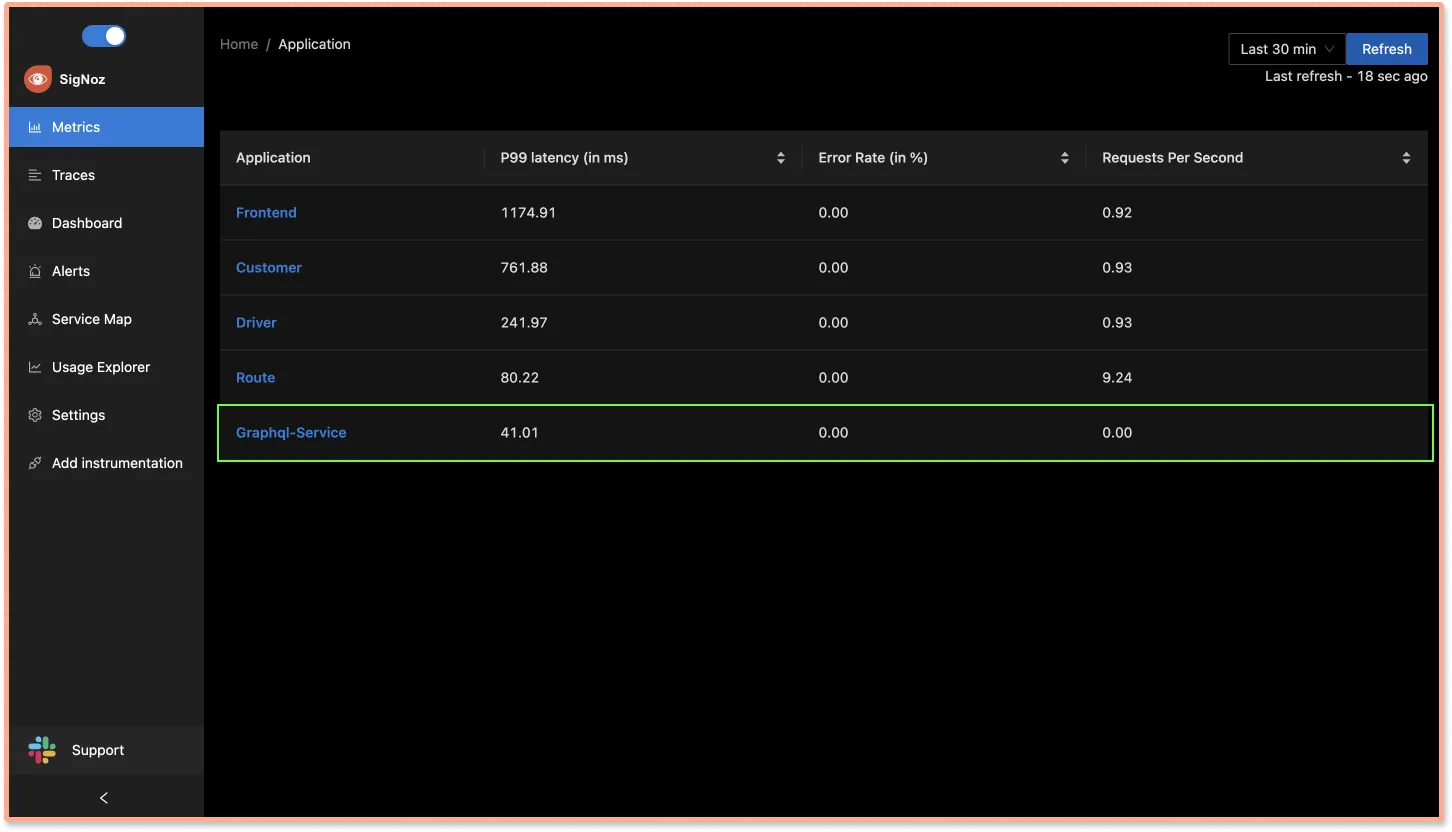
Here are a list of things that you can monitor about your GraphQL APIs with SigNoz.
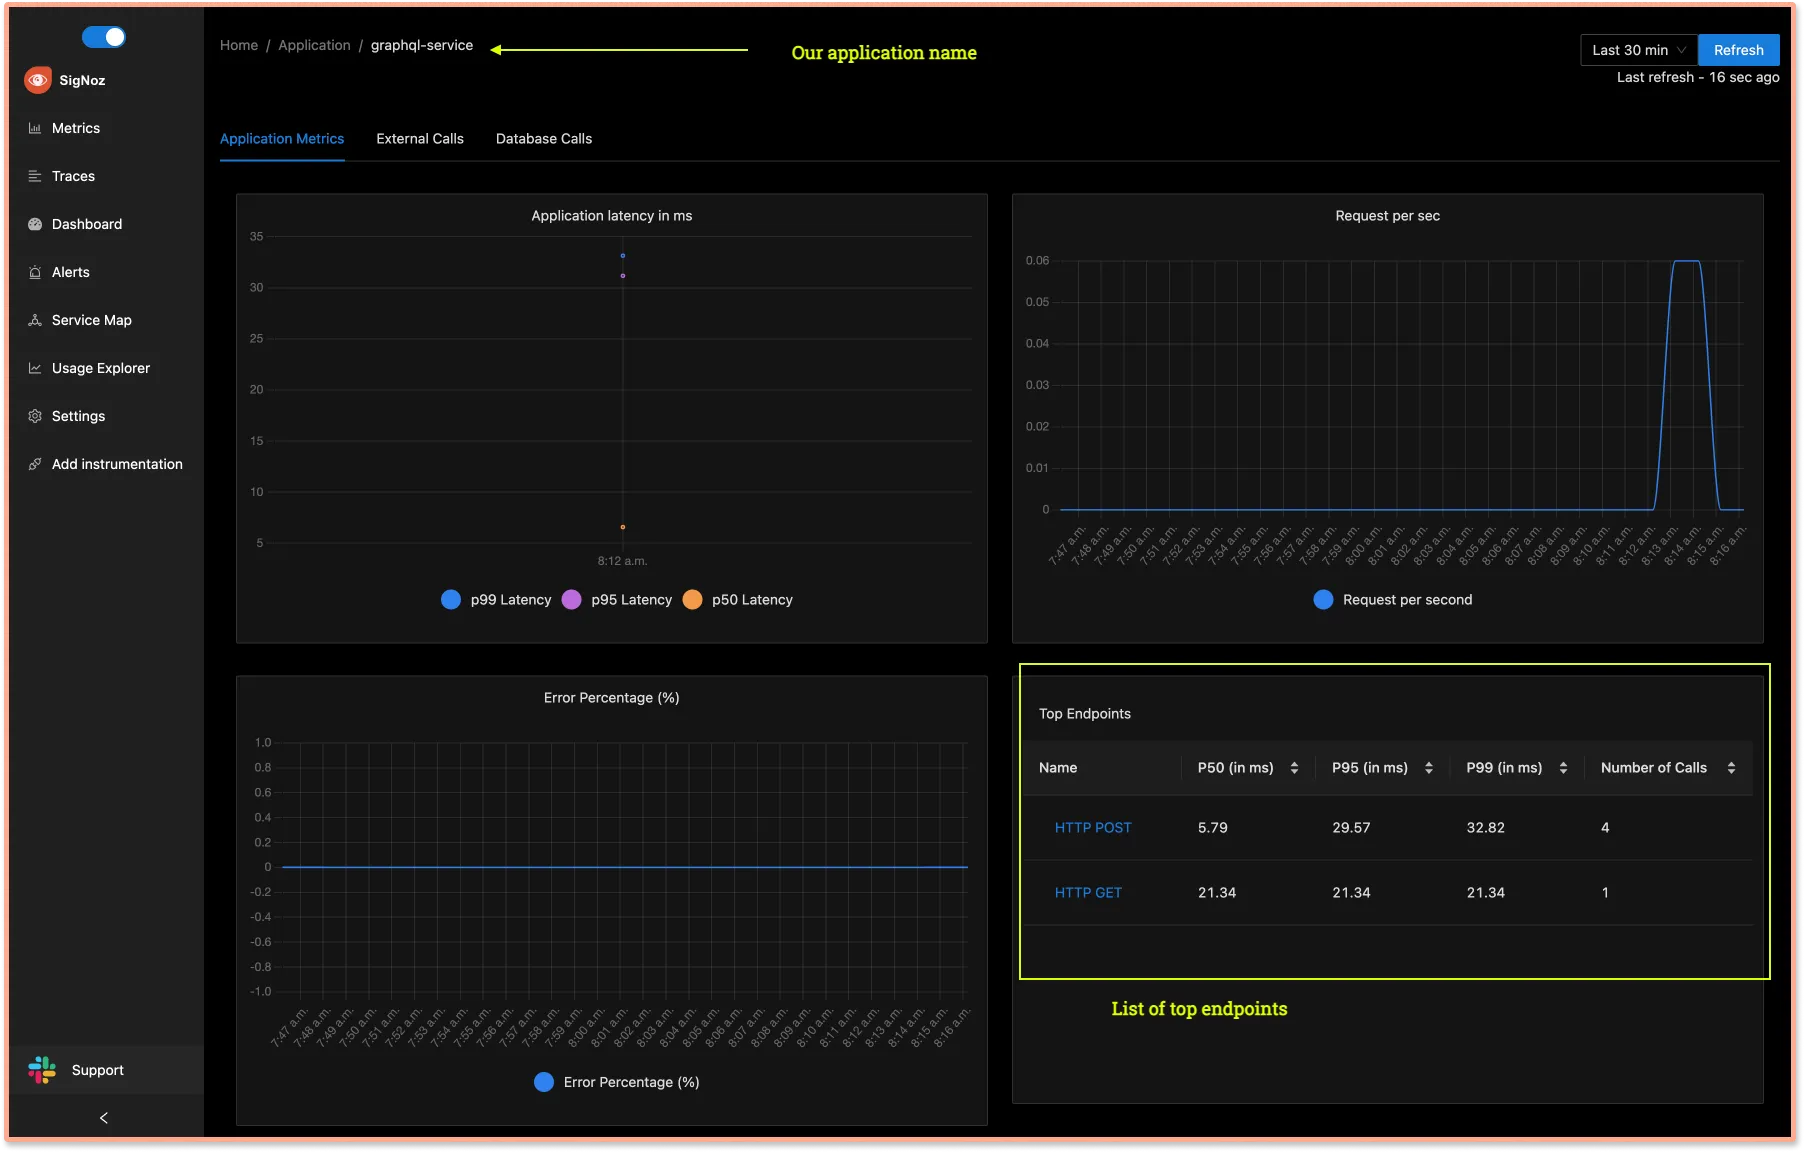
- Monitor list of top endpoints
Our example telemetry configuration assumes that GraphQL is running locally, and that we want to process every span individually as it's emitted.
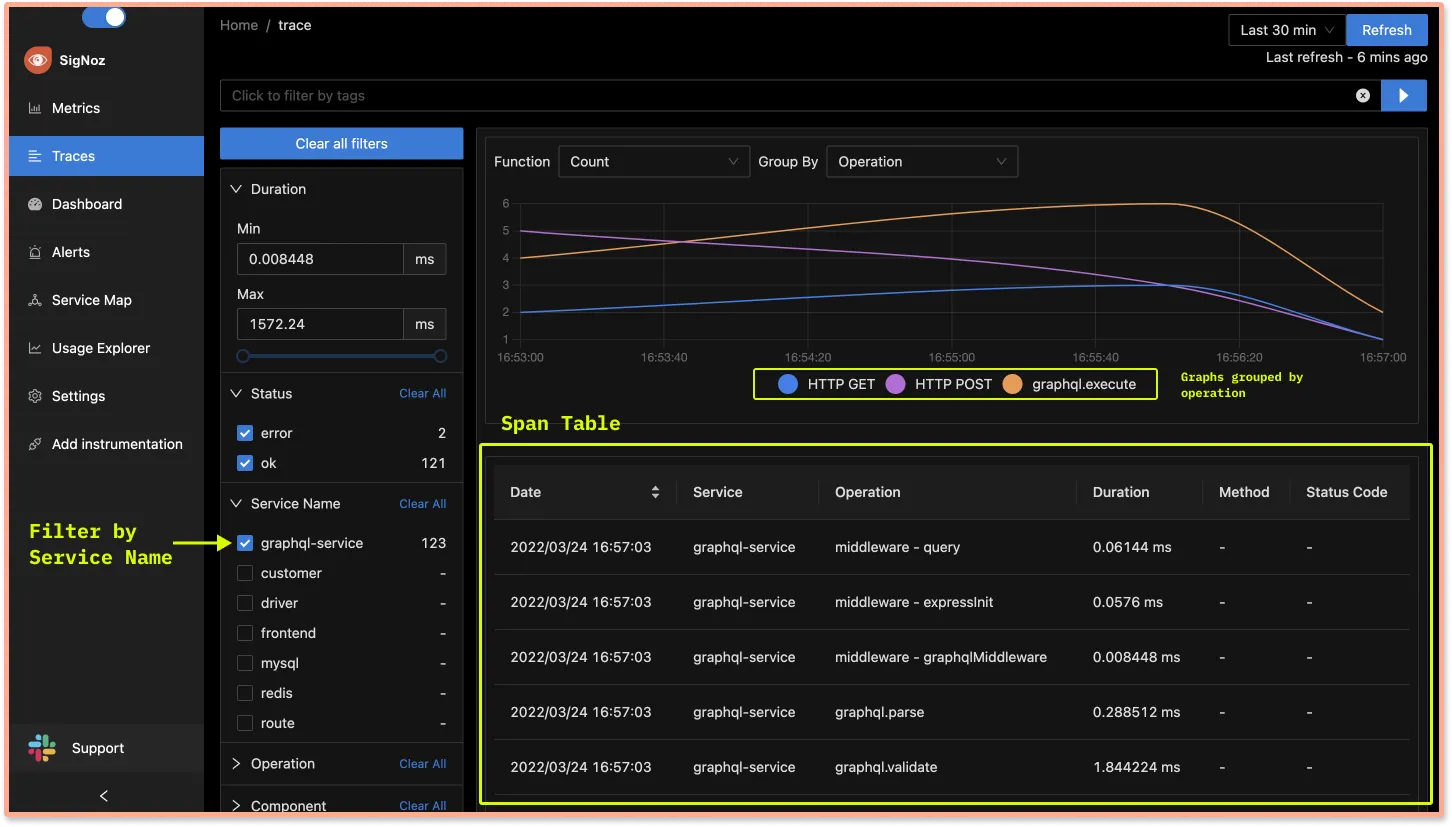
- Explore all events(spans) in your GraphQL service
You can get a list of all the events(or spans as defined in distributed tracing) related to yourgraphql-service. Use powerful filters on theTracestab of SigNoz dashboard to analyze your GraphQL performance.
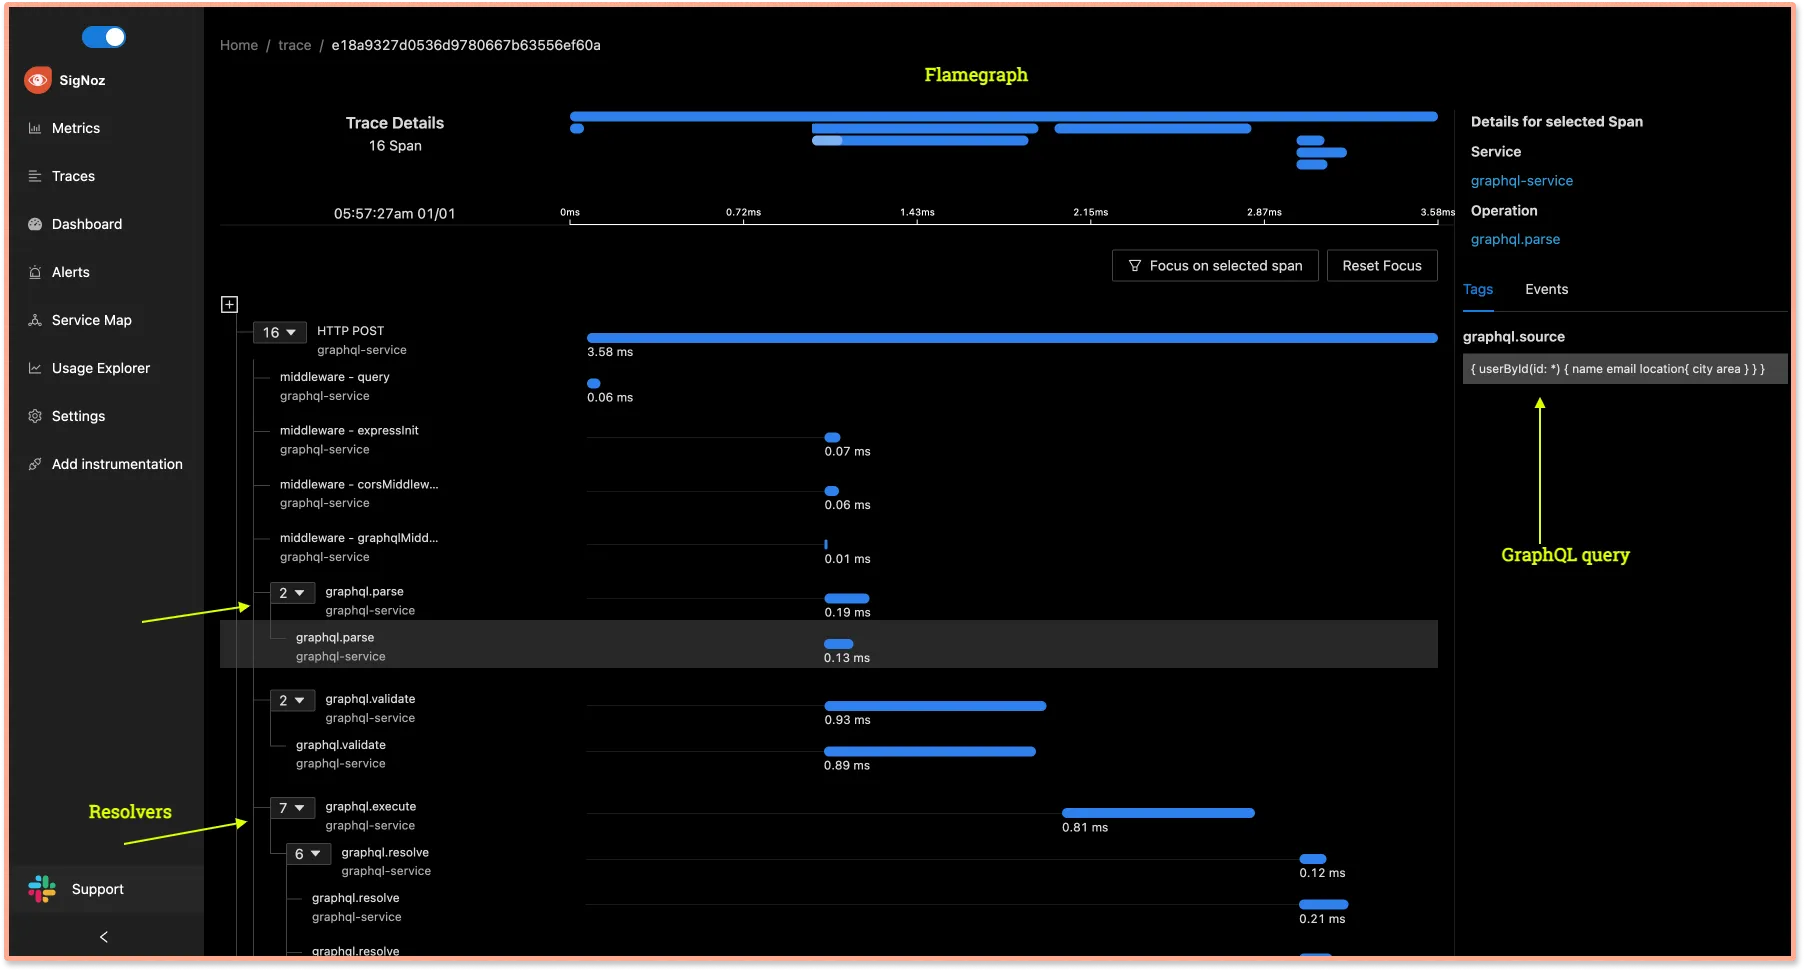
Detailed trace of each span in GraphQL query
Clicking on any span in the span table will bring you to a detailed trace page where the entire journey of the GraphQL query is shown.Establishing a sequential flow of the query along with info on time taken by each part of the request can help identify latency issues quickly. You can see details like how much time did the resolver take. You can also see the related GraphQL query.
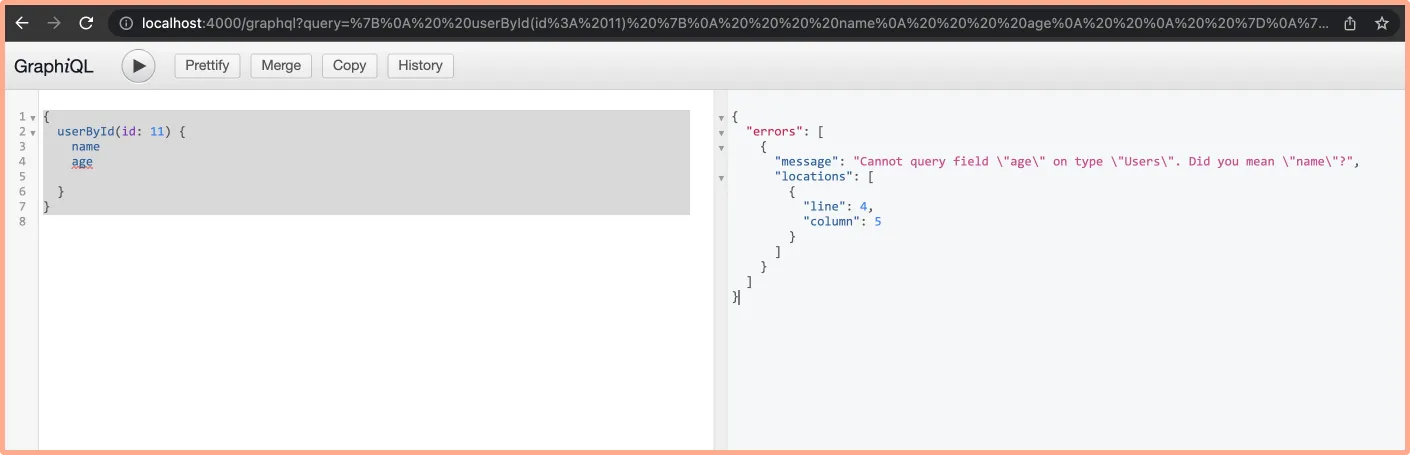
Troubleshooting an error
You can also use SigNoz dashboard to capture error in your GraphQL queries. If you request for a data field that is not available in the backend, the GraphQL interface will show an error.query{ userById(id: 11){ name age } }
SigNoz captures the list of all error calls. You can see the details of a specific error in the Gantt charts.
Click on a particular trace to get a detailed view of the operation span with the error message and the offending query. In this case, you can see an internal server error related to the resolver.
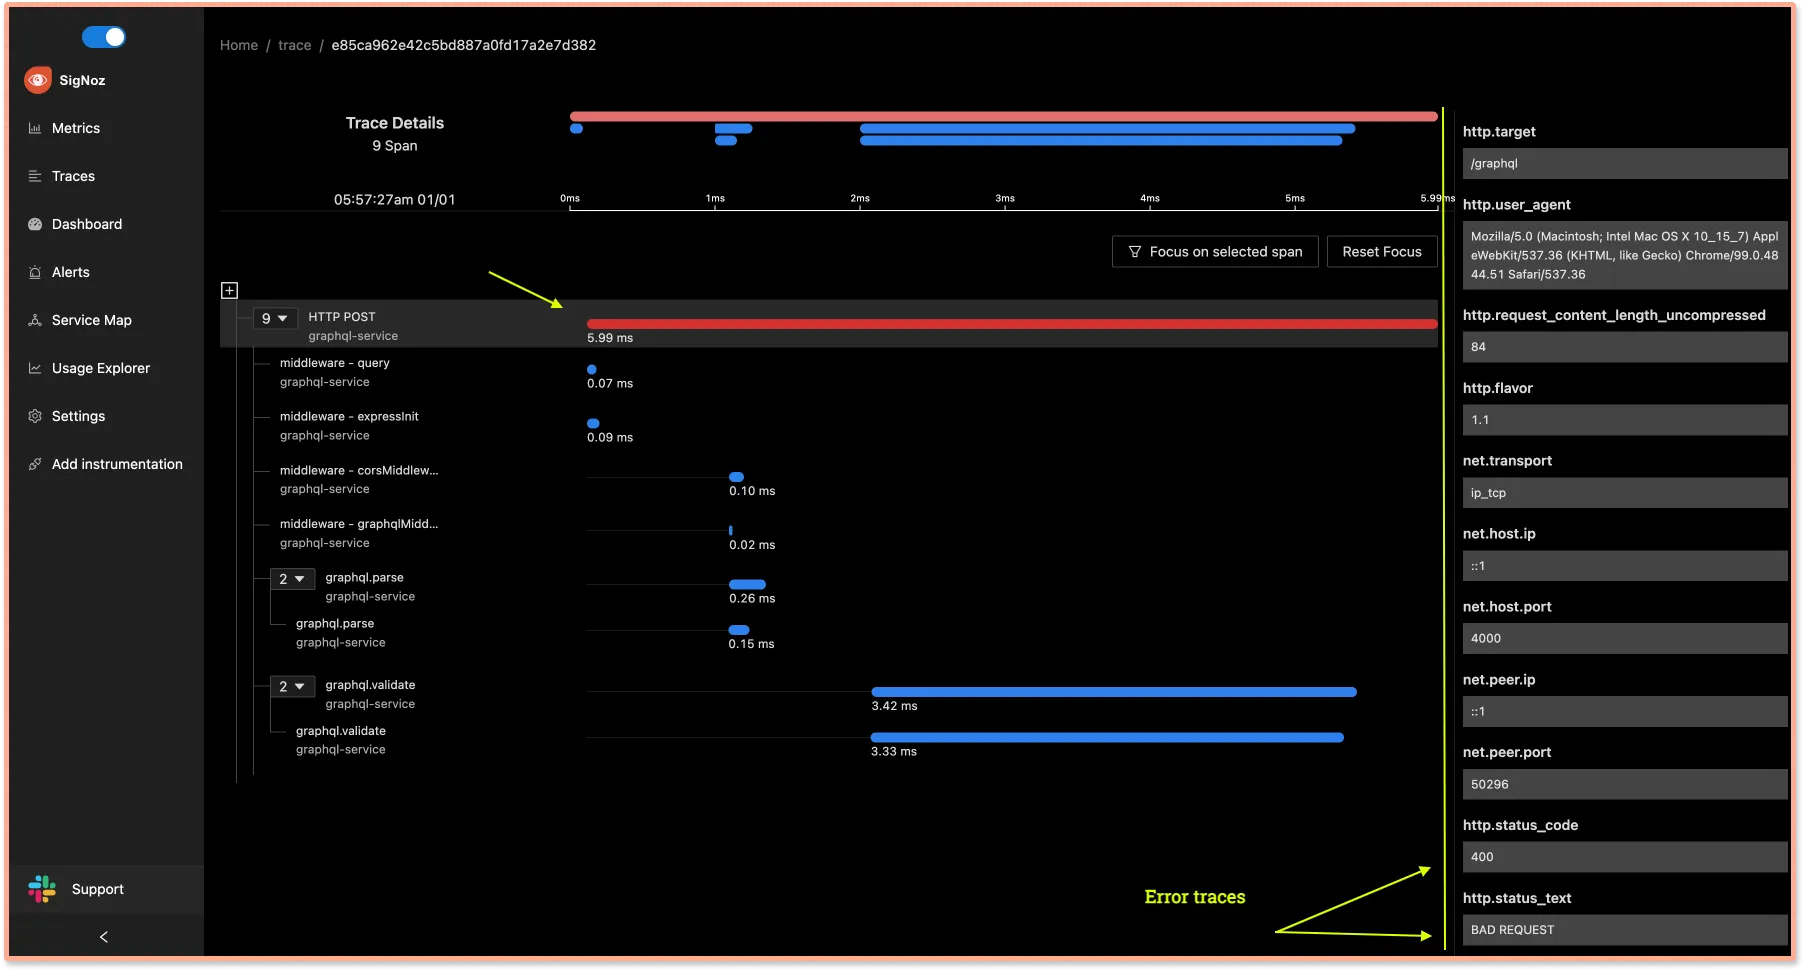
SigNoz also provides a detailed view of common semantic conventions like HTTP, network, and other attributes.
Conclusion
OpenTelemetry is becoming the world standard to generate telemetry data. All major cloud vendors back it, and it will be the default instrumentation layer used by most cloud-native applications in the future.
One of the reasons it is becoming so popular is because it covers a large range of technologies. So, if your application starts using a new framework, you can quickly start monitoring it by using the applicable OpenTelemetry libraries.
In your application, you can use OpenTelemetry for GraphQL APIs and everything else that the application is using. Combined with SigNoz, you can have a fully open-source solution for monitoring your application with GraphQL. You can try out SigNoz by visiting its GitHub repo 👇
If you have any questions or need any help in setting things up, join our slack community and ping us in #support channel.

Further Reading
