Monitor gRPC calls with OpenTelemetry - explained with a Golang example
gRPC (Google Remote Procedure Call) is a high-performance, open-source universal RPC framework that Google developed to achieve high-speed communication between microservices. gRPC has Protobuf (protocol buffers) by default which would format or serialize the messages to a specific format that will be highly packed, highly efficient data. By its virtue of being a lightweight RPC, gRPC is suited for many use-cases.

gRPC can be considered a successor to RPC, which is light in weight. Google developed it to communicate between microservices and other systems that need to interact. There are several benefits of using gRPC.
- Uses Protocol Buffers(Protobuf) instead of JSON
- Built on HTTP 2 instead of HTTP 1.1
- Built-in code generation
- High performance
- SSL security
Apart from the above-mentioned key benefits, gRPC also promotes better design in your application. gRPC is API-oriented instead of resource-oriented like REST. It is also asynchronous by default which means it does not block the thread on request, and it can serve millions of requests in parallel, ensuring high scalability.
Advantages of gRPC over REST
gRPC is roughly seven times faster than REST when receiving data & roughly 10 times faster than REST when sending data for a specific payload. This is mainly due to the tight packing of the Protocol Buffers and the use of HTTP/2 by gRPC.
What is OpenTelemetry?
OpenTelemetry is a vendor-agnostic set of tools, APIs, and SDKs used to create and manage telemetry data(Logs, metrics, and traces). It aims to make telemetry data(logs, metrics, and traces) a built-in feature of cloud-native software applications. The telemetry data generated helps to monitor application performance.
What is OpenTelemetry instrumentation?
Instrumentation is the process by which you enable application code to generate telemetry data. OpenTelemetry provides instrumentation for various libraries and frameworks in different languages. For example, in this article, we will use OpenTelemetry gRPC libraries in Golang to generate telemetry data from gRPC calls.
We will be using OpenTelemetry libraries to monitor gRPC calls in our sample Golang application.
OpenTelemetry can only help in generating the telemetry data. In order to store, and analyze that data, you need to choose a backend analysis tool. In this article, we will monitor collected data from gRPC calls with SigNoz.
SigNoz is a full-stack open-source APM tool that provides metrics monitoring and distributed tracing. It is built to natively support OpenTelemetry data formats. Hence, it’s a great choice for a backend analysis tool to combine with OpenTelemetry. On a side note, OpenTelemetry provides you the freedom to select a backend analysis tool of your choice.
Installing SigNoz
SigNoz can be installed on macOS or Linux computers in just three steps by using a simple install script.
The install script automatically installs Docker Engine on Linux. However, on macOS, you must manually install Docker Engine before running the install script.
git clone -b main https://github.com/SigNoz/signoz.git
cd signoz/deploy/
./install.sh
You can visit our documentation for instructions on how to install SigNoz using Docker Swarm and Helm Charts.

When you are done installing SigNoz, you can access the UI at http://localhost:3301/application
Running a Sample Golang gRPC Application with OpenTelemetry
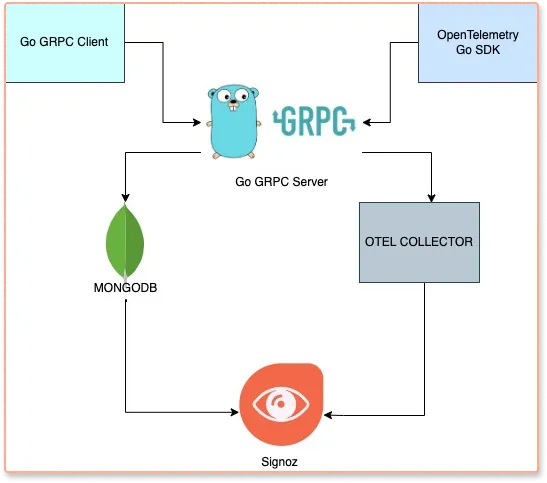
We will use a sample Golang gRPC application consisting of components such as Go gRPC server, go gRPC Client along with MongoDB.
Sample Golang gRPC GitHub repo
Our application is a simple Employee Service. Here is the architecture of the application along with OpenTelemetry and Signoz.
Prerequisites
Golang, any one of the three latest major releases of Go.
For installation instructions, see Go’s Getting Started guide.
Protocol buffer compiler,
protoc, version 3.For installation instructions, see Protocol Buffer Compiler Installation.
Go plugins for the protocol compiler:
Install the protocol compiler plugins for Go using the following commands:
go install google.golang.org/protobuf/cmd/protoc-gen-go@v1.28
go install google.golang.org/grpc/cmd/protoc-gen-go-grpc@v1.2
Update your
PATHso that theprotoccompiler can find the plugins:export PATH="$PATH:$(go env GOPATH)/bin"
MongoDB Compass
Download from Official site here link.
Running a sample application with OpenTelemetry
Following are the steps to run the sample Golang gRPC application with OpenTelemetry:
Step1: Clone the sample Golang app repository and go to the root folder
We will be using a sample go-grpc app in this GitHub repo.
git clone https://github.com/SigNoz/distributed-tracing-go-grpc-sample.git
cd distributed-tracing-go-grpc-sample
Step 2: Install the required dependencies
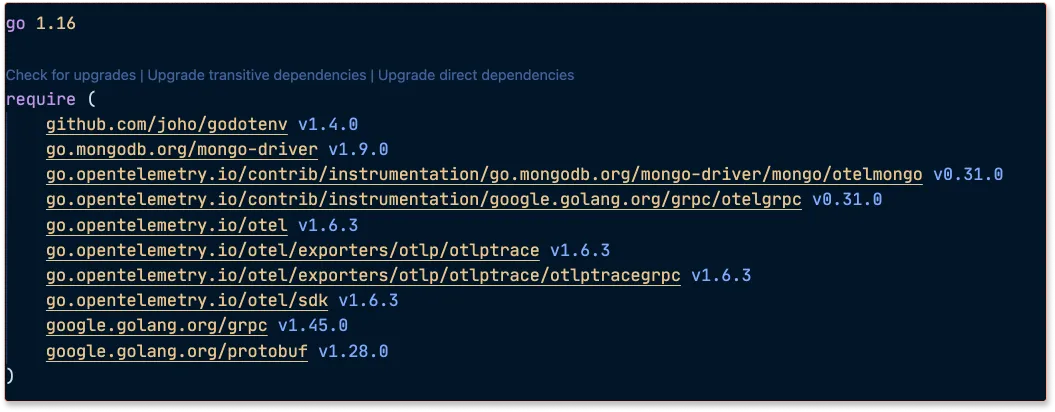
You can check out the dependencies required from go.mod file. Install all the required dependencies for the sample application using
go mod tidy
go mod vendor
OpenTelemetry needs the following libraries to instrument the golang-grpc app.
Step 3: Creation of .proto files
In the .proto file, we have the service definition and the respective functions/messages, and through the protoc compiler, we will generate the necessary protobuf files.
The following two commands will install the dependencies for golang's grpc and protoc-gen-go, which will need the .proto file**.** Now let's see how the protoc compiler generates the respective code for Golang. For this, we have executed the following command from the root of our project.
protoc --go_out=. --go_opt=paths=source_relative \
    --go-grpc_out=. --go-grpc_opt=paths=source_relative \
    employee/employee.proto
Notice that we use relative paths and set the path of our employee.proto file to compile. The above command has generated two files:
- employee.pb.go
For serializing the messages using protobuf and the other file - employee_grpc.pb.go
Consisting of code for the gRPC client and server code that we will be looking at later on.
If you look at the file employee_grpc.pb.go, you can notice that structs and interfaces are generated for the client and server implementation.
You can check for the .proto files here.
Step 4: Tracer Config for the gRPC Server, gRPC Client and MongoDB
In order to instrument our services, we will create a config.go file and use it to instrument the gRPC Server, gRPC Client, and MongoDB.
We need to initialize OpenTelemetry as the first call inside the main function in both gRPC server and client. If your application starts before OpenTelemetry is set up, it can create issues. You can initialize OpenTelemetry by using the code as shown below:
func main() {
	tp := config.Init()

	defer func() {
		if err := tp.Shutdown(context.Background()); err != nil {
			log.Printf("Error shutting down tracer provider: %v", err)
		}
	}()
}
You can check out the configuration in the code sample here.
Step 5: Instrumenting gRPC server and client
To instrument any gRPC servers you have.
import (
    "go.opentelemetry.io/contrib/instrumentation/google.golang.org/grpc/otelgrpc"
)

func main() {
  [...]

    // add StatsHandler to gRPC server initialization
	s := grpc.NewServer(grpc.StatsHandler(otelgrpc.NewServerHandler()))

}
Similarly, instrument your gRPC client as well by adding otelgrpc when initializing gRPC client
import (
    "go.opentelemetry.io/contrib/instrumentation/google.golang.org/grpc/otelgrpc"
)

func main() {
  [...]

    // add StatsHandler to gRPC client initialization
	cc, err := grpc.NewClient(serverUrl, grpc.WithTransportCredentials(insecure.NewCredentials()),
		grpc.WithStatsHandler(otelgrpc.NewClientHandler()),
	)

}
Step 6: Instrumenting MongoDB
But when it comes to instrumentation data for MongoDB, we need to use this OpenTelemetry Go library.
It is already included in the go.mod file of the sample repo.
When the MongoDB client is initialized, we need to set the monitor through otelmongo.NewMonitor() method like below which would get the instrumentation data from MongoDB. You can find the code in server.go file.
client, err := mongo.NewClient(options.Client().ApplyURI(mongo_url).SetMonitor(otelmongo.NewMonitor()))
	if err != nil {
		log.Fatal(err)
	}
Step 7: Setting up .env files
We have the .env files in the client and server directory in order to set up environment variables required for grpc-server and grpc-client components.
OTEL_EXPORTER_OTLP_ENDPOINT: localhost:4317
Since, we have installed SigNoz on our local machine, we use the above IP. If you install SigNoz on a different machine, you can update it with the relevant IP.
This is how the server/.env looks like.
MONGO_URL=mongodb://localhost:27017/employeedb
OTEL_EXPORTER_OTLP_ENDPOINT="localhost:4317"
SERVICE_NAME="go-grpc-otel-server"
INSECURE_MODE=true
This is how the client/.env looks like
OTEL_EXPORTER_OTLP_ENDPOINT="localhost:4317"
SERVICE_NAME="go-grpc-otel-client"
INSECURE_MODE=true
Do not use http or https in the IP address. For example, if the IP is 'http://test.com' then the OTEL_EXPORTER_OTLP_ENDPOINT will be test.com:4317
You can check the client env file and server env file in the sample GitHub repo.
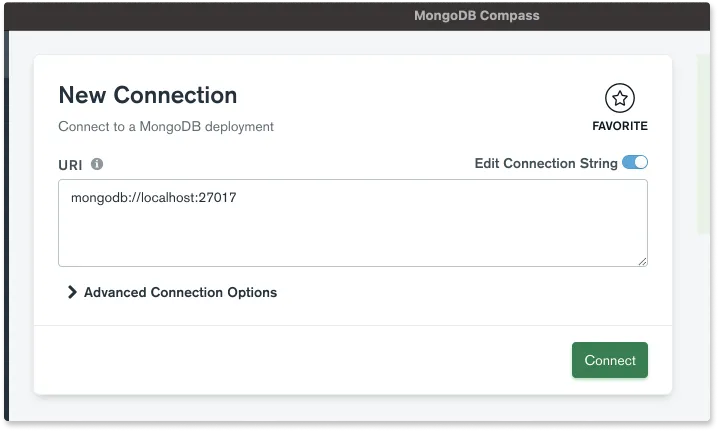
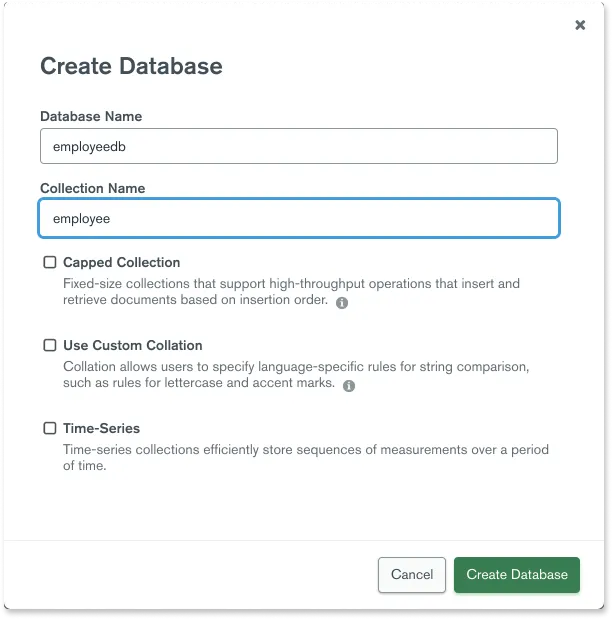
Step 8: Create MongoDB Table and Collection in Mongo Compass
- Click on Connect → New Connection
- Click on Databases tab → Create Database and fill in the fields like the below screenshot
Now that the sample Golang gRPC application is set up with OpenTelemetry, let’s see how we can use SigNoz dashboard to monitor the collected data.
Monitoring Golang gRPC and MongoDB with SigNoz dashboards
You need to generate some data to see how traces are captured in the SigNoz dashboard. From the root of our project,
cdto the server directory and then run the go grpc serverSERVICE_NAME=goAppServer OTEL_EXPORTER_OTLP_HEADERS=signoz-ingestion-key=YOUR_SIGNOZ_INGESTION_KEY OTEL_EXPORTER_OTLP_ENDPOINT=YOUR_COLLECTOR_ENDPOINT go run .cdto the client directory and then run the go grpc clientSERVICE_NAME=goAppClient OTEL_EXPORTER_OTLP_HEADERS=signoz-ingestion-key=YOUR_SIGNOZ_INGESTION_KEY OTEL_EXPORTER_OTLP_ENDPOINT=YOUR_COLLECTOR_ENDPOINT go run .
Running the client makes a set of CRUD operations in MongoDB such as create Employee, Read Employee, Update Employee and Delete Employee. We have added traces for all these operations so that it generates some monitoring data to be explored on the SigNoz dashboard.
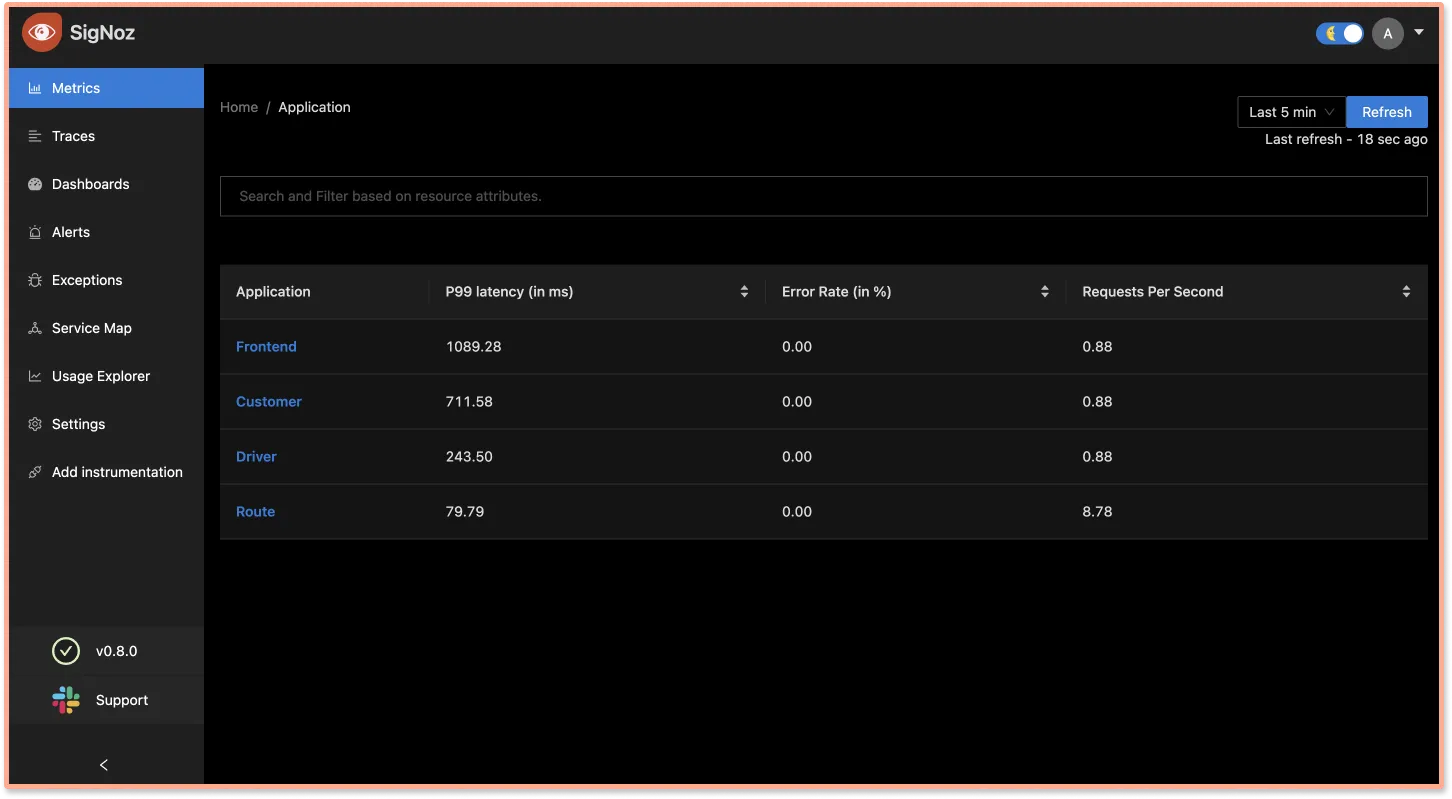
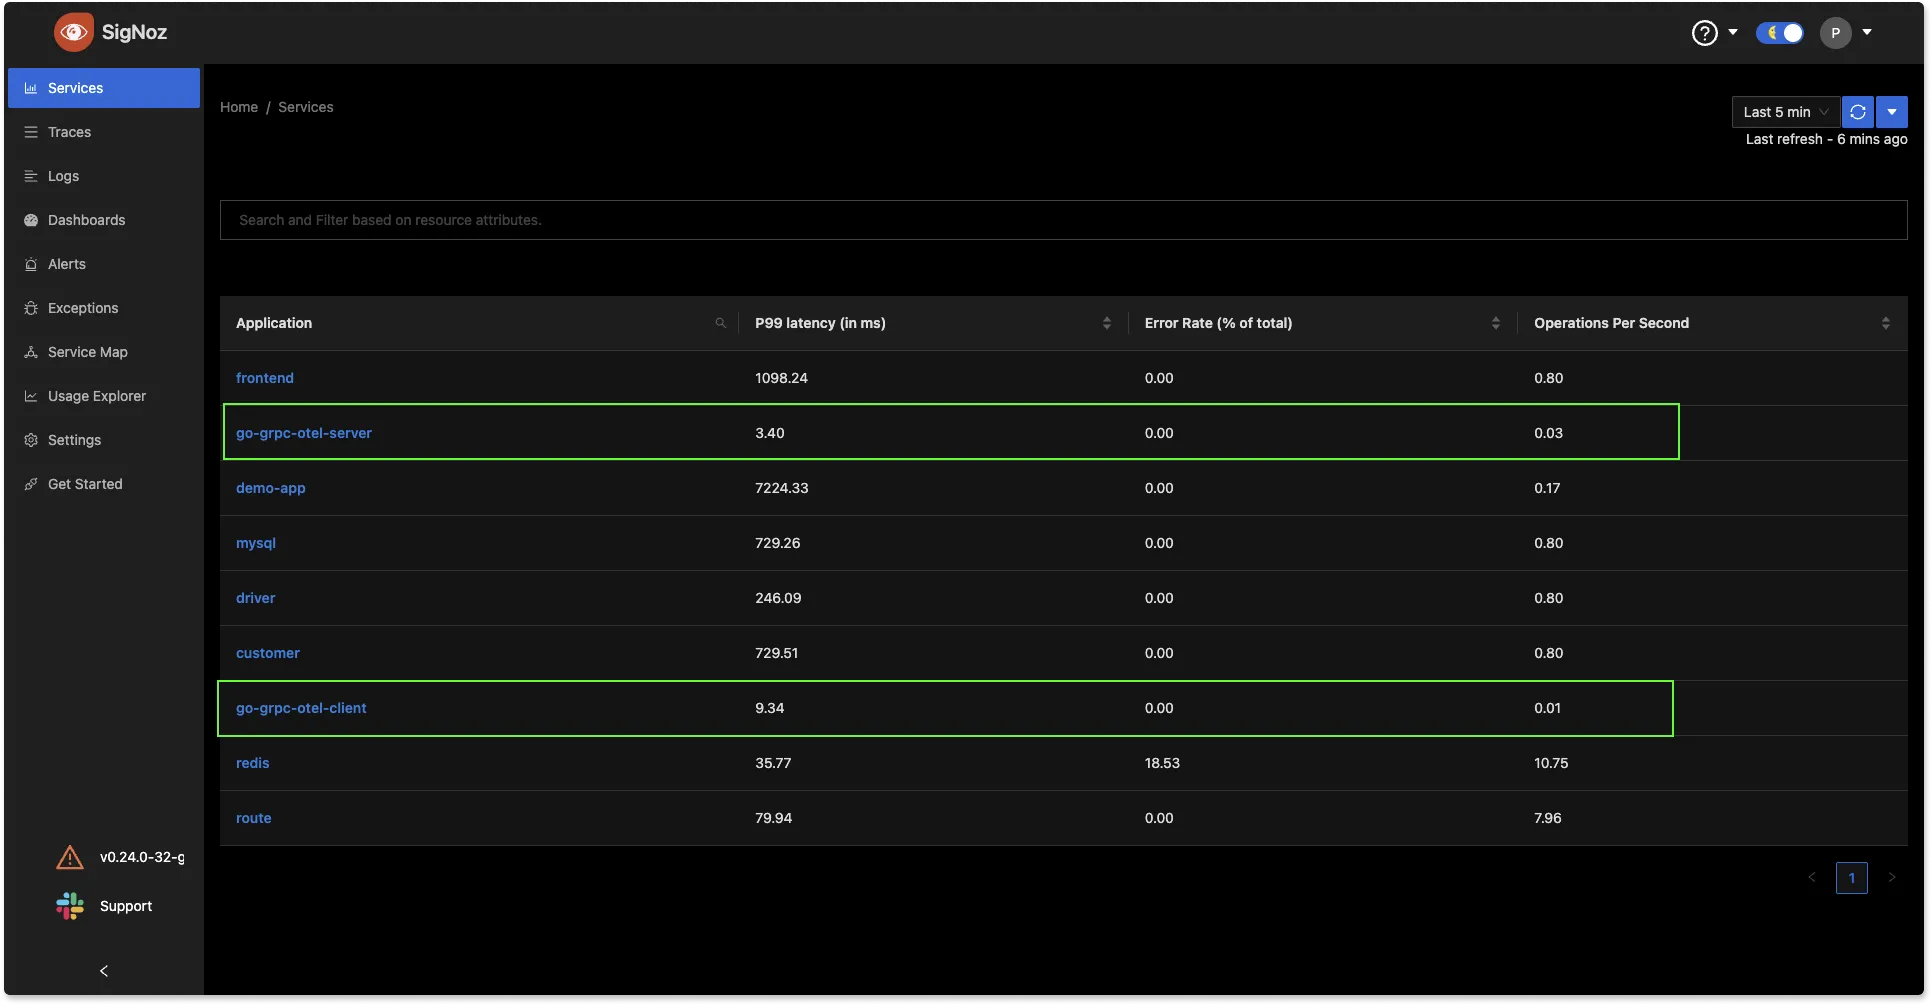
Now, open the SigNoz dashboard in your browser at http://localhost:3301/dashboard. You should now be able to notice Go-Grpc-Otel-Server in the list of services being monitored on the dashboard.
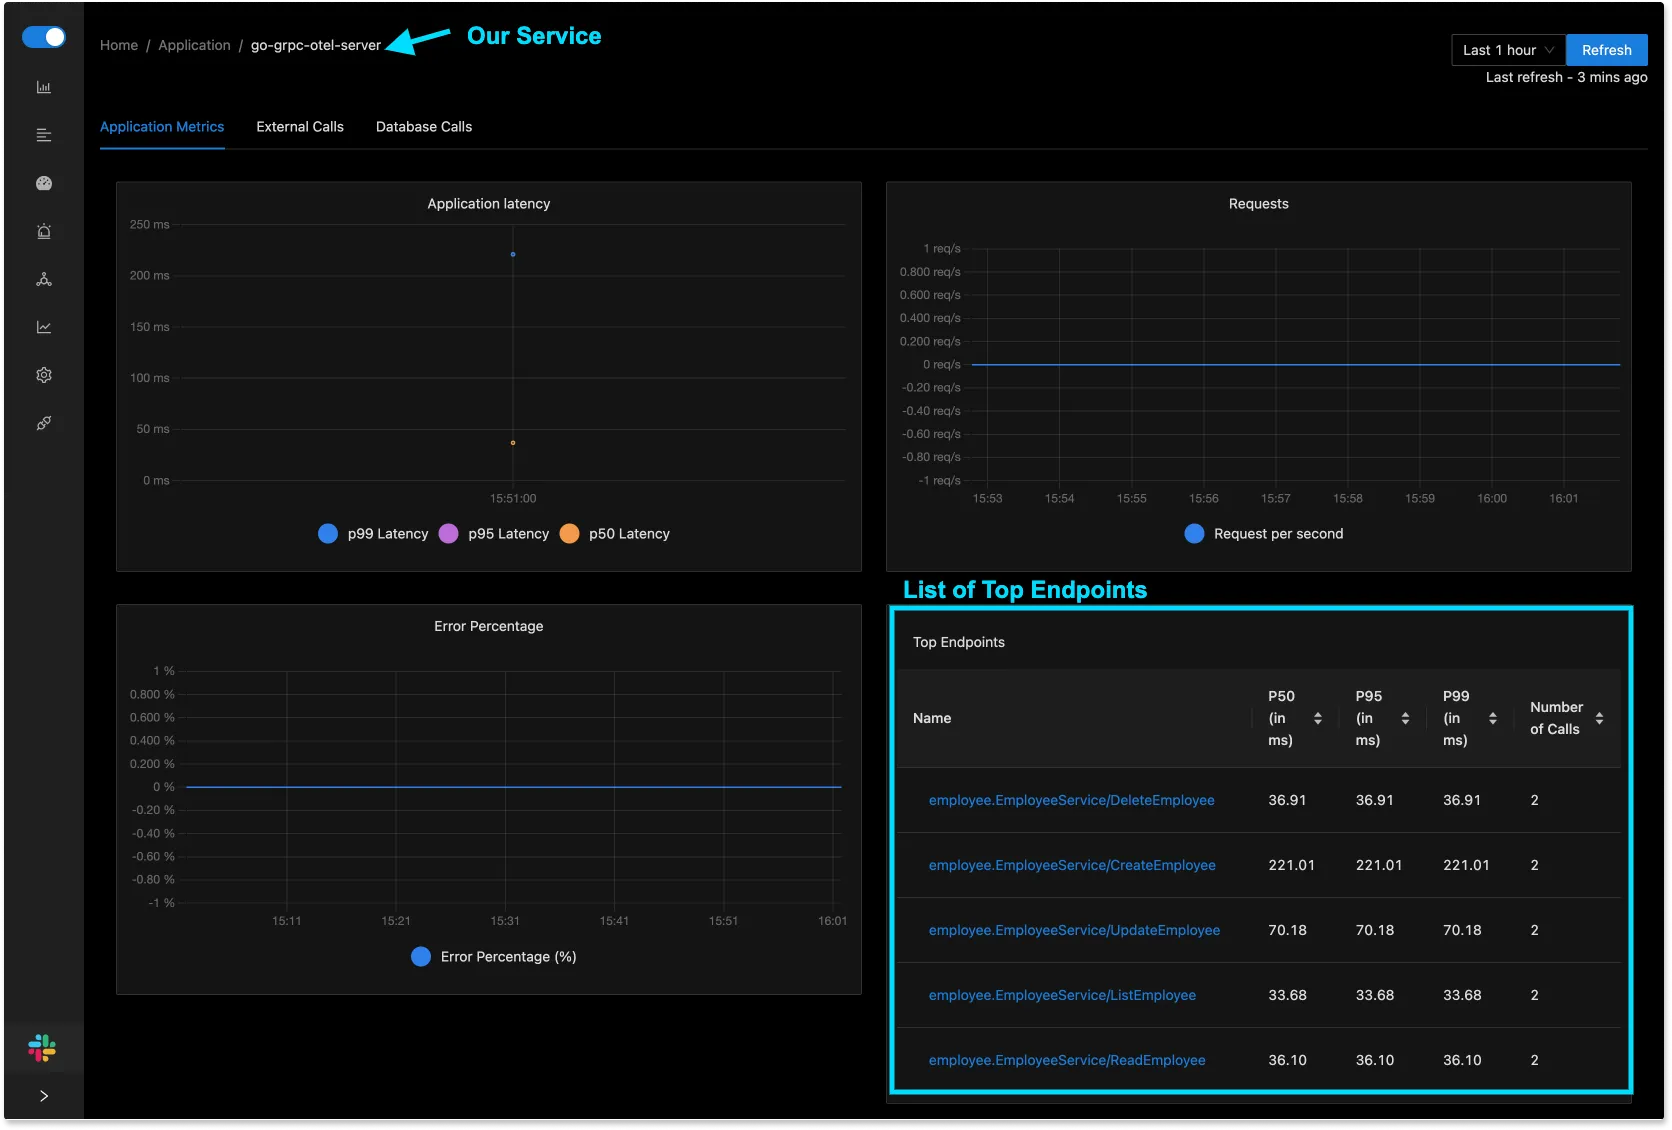
Monitor list of top endpoints
Our example telemetry configuration assumes that our application is running locally and that we want to process every span individually as it is emitted.
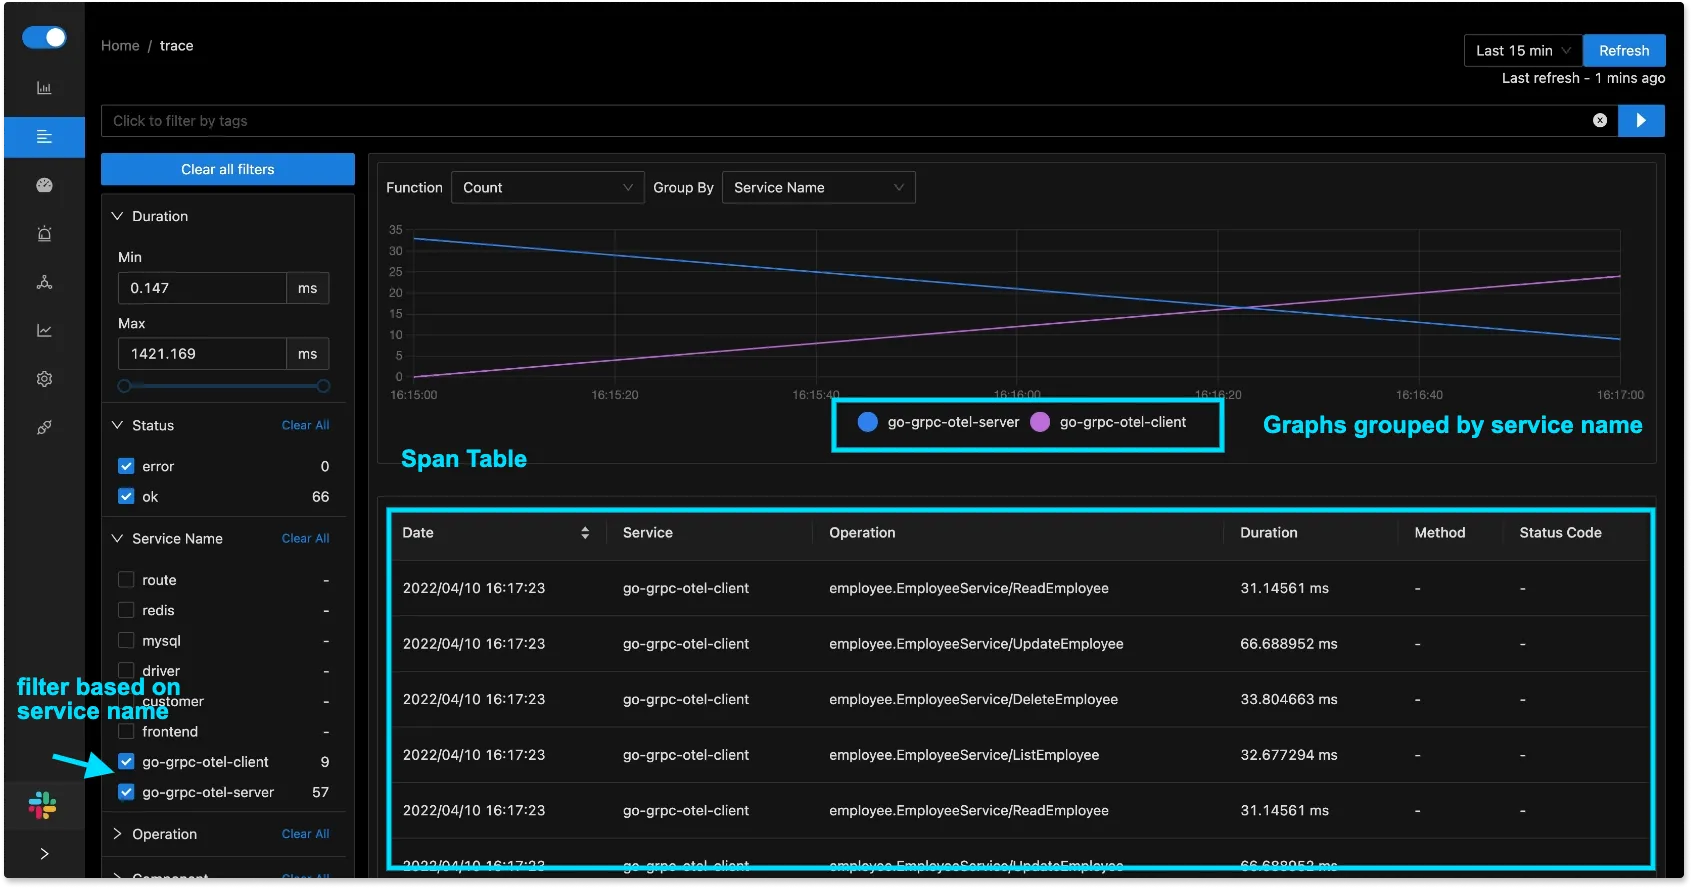
Explore all events(spans) in your service
You can get a list of all the events(or spans as defined in distributed tracing) related to your Go-gRPC-Otel-Server. Use powerful filters on the Traces tab of SigNoz dashboard to analyze your Application performance.
Detailed trace of each span in Application
Clicking on any span in the span table will bring you to a detailed trace page where the entire journey of traces of server, client, and MongoDB are shown. The trace-detail page has the info on time taken by each part of the request can help identify latency issues quickly. You will see the flamegraph of the selected event, which shows how the request traveled between the gRPC server and the gRPC client.
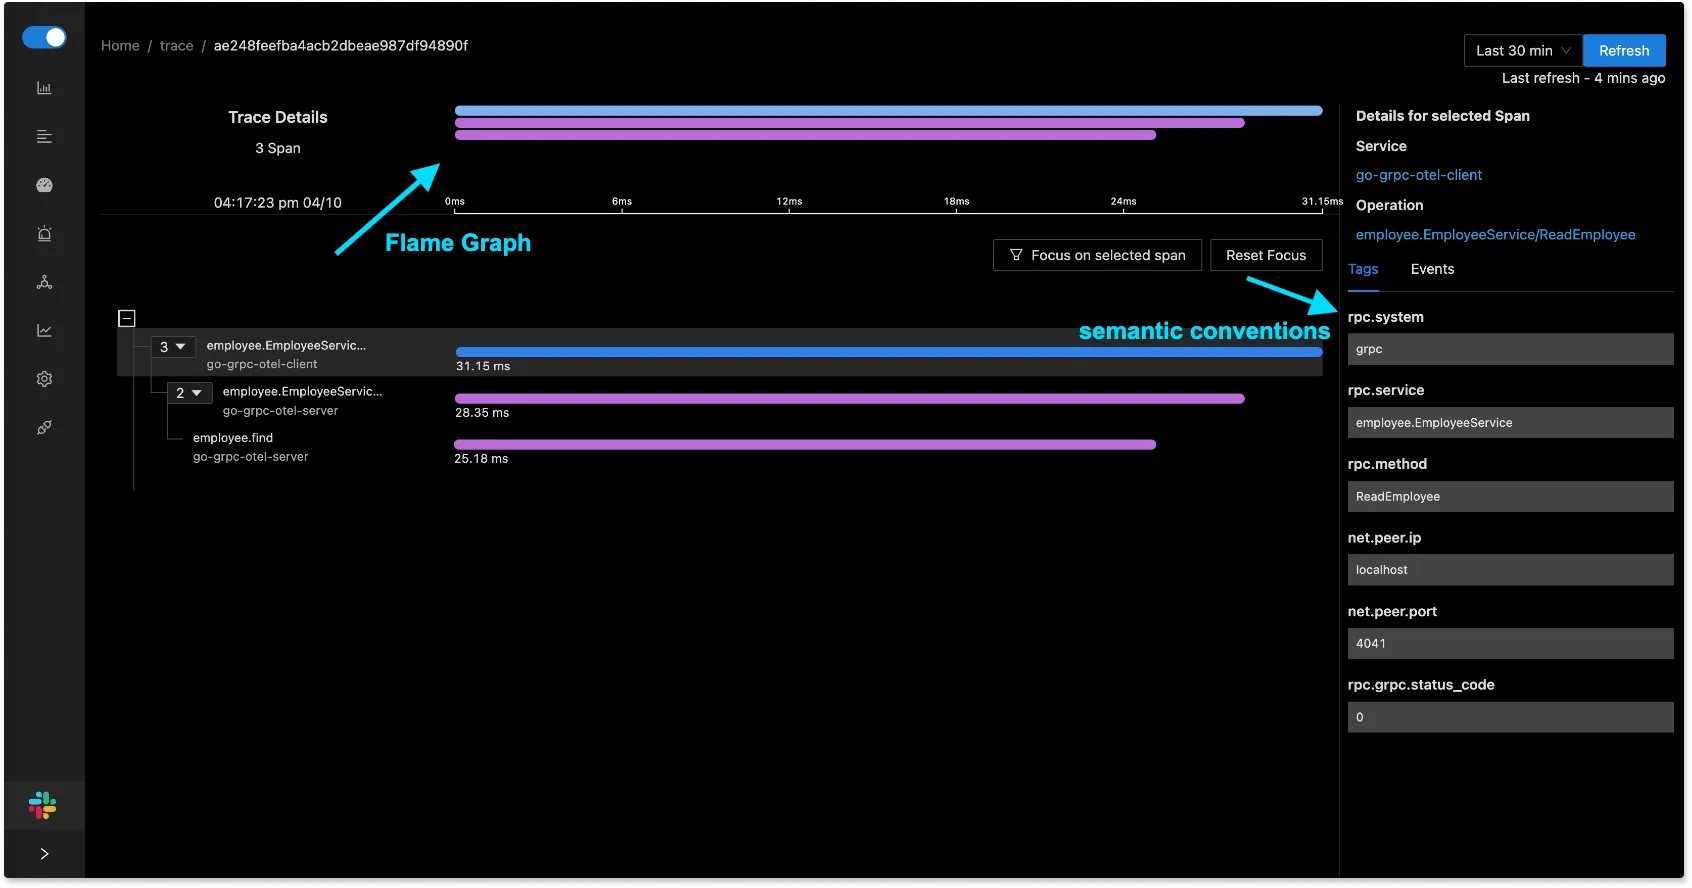
SigNoz also provides a detailed view of common semantic conventions like rpc service, method, net, status_code etc. The end-to-end tracing of user requests can help you to identify latency issues quickly.
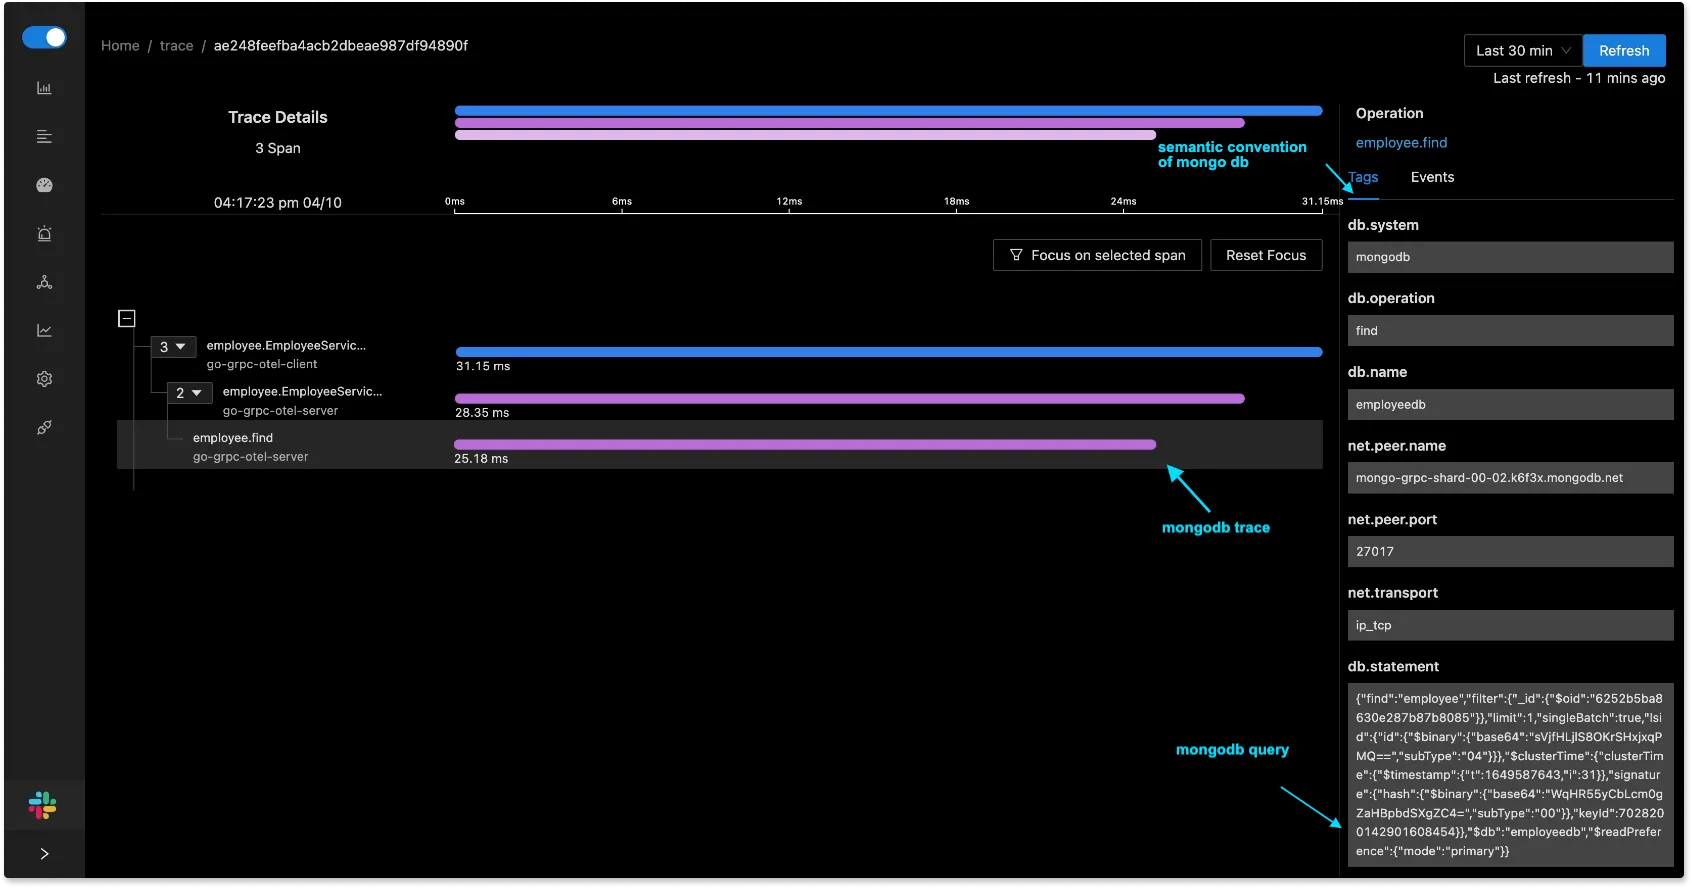
MongoDB Traces and its semantic conventions
Establishing a sequential flow of the query and info on the time taken by each part of the request can help quickly identify latency issues. For example, you can see details like how much time the find query took. You can also see the related MongoDB query.
It also provides the semantic_conventions of MongoDB in the below window.
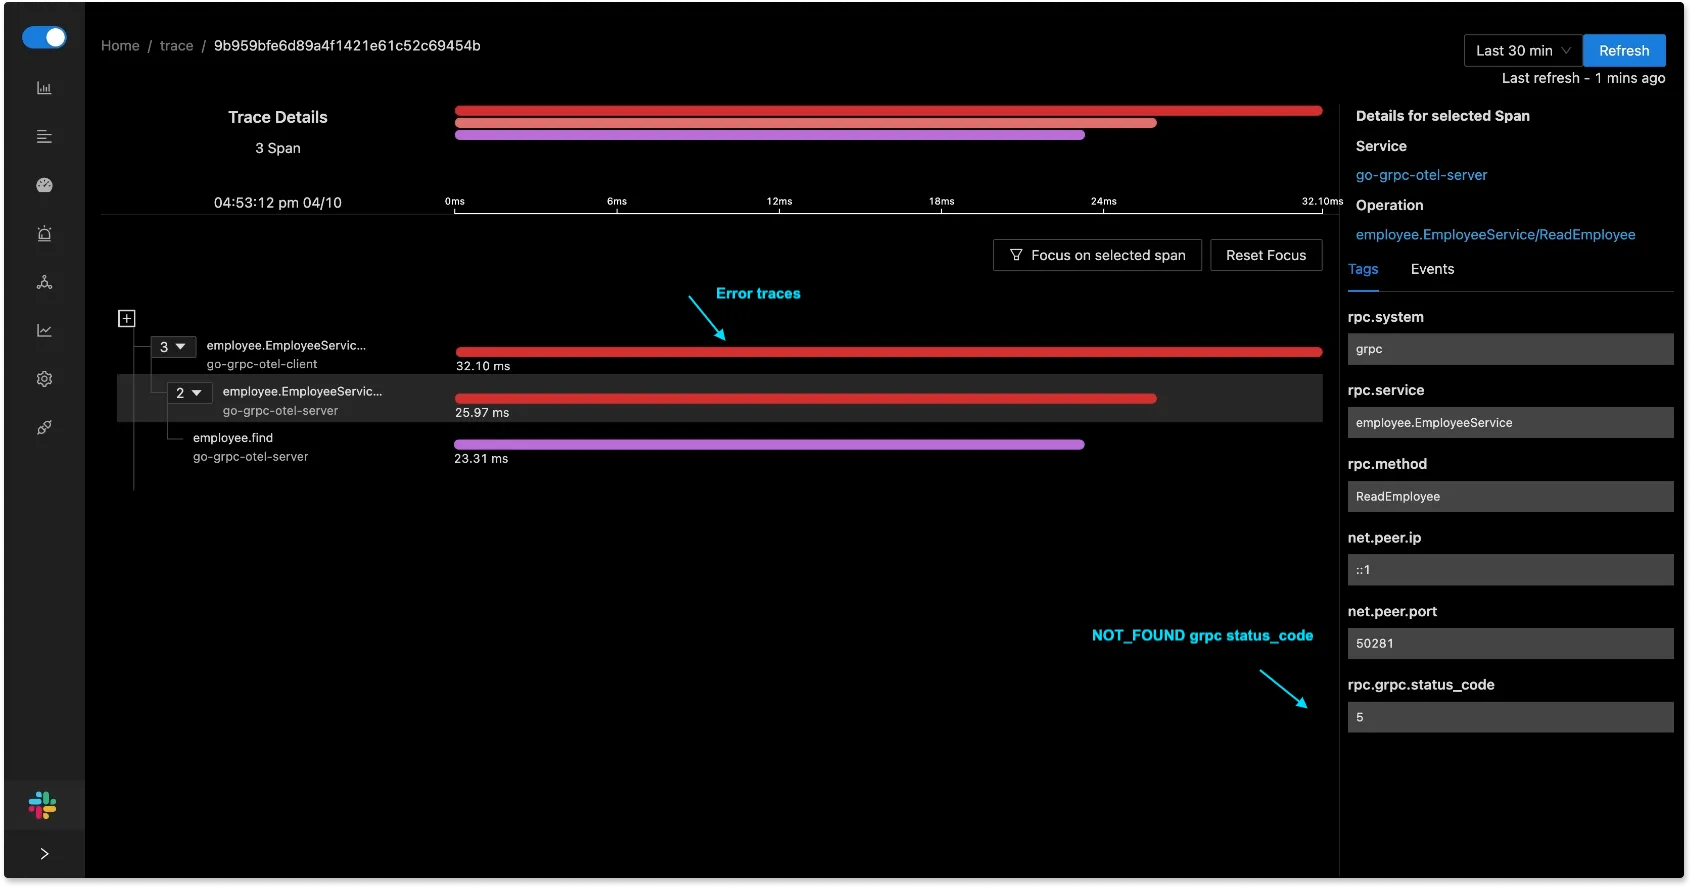
Troubleshooting an error
You can also use SigNoz dashboard to capture error in your MongoDB queries. If you request for a data field that is not available in the backend, then the application will return an error.
Conclusion
OpenTelemetry makes it very convenient to instrument gRPC calls for performance monitoring. OpenTelemetry is going to be the future of monitoring and observability for cloud-native applications, as it’s backed by a huge community.
The biggest advantage of using OpenTelemetry is that you are not locked-in to a vendor. If tomorrow, you want to use a different vendor you can do so easily.
SigNoz works natively with OpenTelemetry. The query service and the visualization layer on top of your telemetry data is key to generate actionable insights quickly. SigNoz provides out-of-box charts and powerful filters to analyze the telemetry data quickly.
OpenTelemetry and SigNoz provide a great open-source solution to monitor gRPC calls. You can try out SigNoz by visiting its GitHub repo 👇
If you are someone who understands more from video, then you can watch the below video tutorial on the same with SigNoz.
If you have any questions or need any help in setting things up, join our slack community and ping us in #support channel.

Read more about OpenTelemetry from SigNoz blog
