OpenTelemetry MongoDB | Monitor and visualize your MongoDB database calls
OpenTelemetry libraries can be used to monitor MongoDB interactions. In this tutorial, we will learn how we can monitor MongoDB with OpenTelemetry libraries to analyze query execution and identify performance bottlenecks.
Most modern applications have distributed architecture thanks to cloud and containerization. In cloud-native applications, it is necessary to track user requests across services and components like databases. Distributed tracing is the technology that enables tracing of user requests across different components of your application.
But how do you enable distributed tracing for your application?
That’s where OpenTelemetry comes into the picture. It is an open-source project under the Cloud Native Computing Foundation (CNCF) that aims to standardize the generation and collection of telemetry data (logs, metrics, and traces).
OpenTelemetry has client libraries in all major programming languages. These client libraries can collect and emit telemetry data from application code, different web frameworks, and database components like MongoDB.
But OpenTelemetry is used only for the instrumentation layer. Once the telemetry data is collected, it needs to be sent to a backend analysis tool for storage and visualization. That’s where SigNoz comes into the picture. SigNoz is a full-stack open-source observability tool. You can also choose other analysis tools, as OpenTelemetry is vendor-agnostic.
In this tutorial, let’s learn how to trace MongoDB calls with OpenTelemetry. We will illustrate it with the help of a sample Nodejs application. We also have a bonus section on enabling host metrics for monitoring the health of your MongoDB instances.
Prerequisites
- SigNoz
- Sample Nodejs app
You can find the code for sample nodejs express app with MongoDB here. (Check out the MongoDB branch)
We will be using a sample Nodejs application to illustrate how to instrument MongoDB with OpenTelemetry. You will also need to install SigNoz to visualize the collected data from OpenTelemetry.
Installing SigNoz
First, you need to install SigNoz so that OpenTelemetry can send the data to it.
SigNoz can be installed on macOS or Linux machines in just three steps by using a simple install script.
The install script automatically installs Docker Engine on Linux. However, on macOS, you must manually install Docker Engine before running the install script.
git clone -b main https://github.com/SigNoz/signoz.git
cd signoz/deploy/
./install.sh
You can visit our documentation for instructions on how to install SigNoz using Docker Swarm and Helm Charts.

When you are done installing SigNoz, you can access the UI at http://localhost:3301/application
Instrumenting MongoDB with OpenTelemetry to enable tracing
We want to trace user requests from our Nodejs app to MongoDB in order to visualize the complete breakdown of user requests. OpenTelemetry provides language-specific implementations to enable tracing for MongoDB.
For a nodejs app, you need to add specific MongoDb libraries as a dependency in your application code.
Your Nodejs application will have a tracing.js file which is used to initiate a tracer. Import MongoDBInstrumentation and create an instance with relevant option parameters and append it to the instrumentations list:
+ const { MongoDBInstrumentation } = require('@opentelemetry/instrumentation-mongodb');

...

const sdk = new opentelemetry.NodeSDK({
  traceExporter,
  instrumentations: [getNodeAutoInstrumentations(),
+  new MongoDBInstrumentation({
+    enhancedDatabaseReporting: true,
+  }),
	],
});
Enabling MongoDB host metrics
Enabling MongoDB host metrics would provide detailed metrics about the health of your MongoDB instance.
Step 1: Add mongodb-exporter service
In order to enable host metrics collection, you need to add mongodb-exporter service in the docker-compose file of the sample application. You can find it here.
services:
  mongo:
    container_name: mongo_db
    image: mongo
    restart: always
    ports:
      - 27017:27017

+  mongodb-exporter:
+    image: percona/mongodb_exporter:0.30
+    command: --mongodb.uri=mongodb://mongo:27017 --compatible-mode
+    ports:
+      - 9216:9216
+    depends_on:
+      - mongo
Step 2: Add job metrics scraping job
Add job metrics scraping job to the otel-collector-config.yaml file. You can find the file here.
receivers:
  otlp:
    protocols:
      grpc:
      http:

  # Data sources: metrics
  prometheus:
    config:
      scrape_configs:
        - job_name: "otel-collector"
          scrape_interval: 30s
          static_configs:
            - targets: ["otel-collector:8889"]
+        - job_name: "mongo-collector"
+          scrape_interval: 30s
+          static_configs:
+ - targets: ["host.docker.internal:9216"]Step 3: Create custom dashboards using PromQL
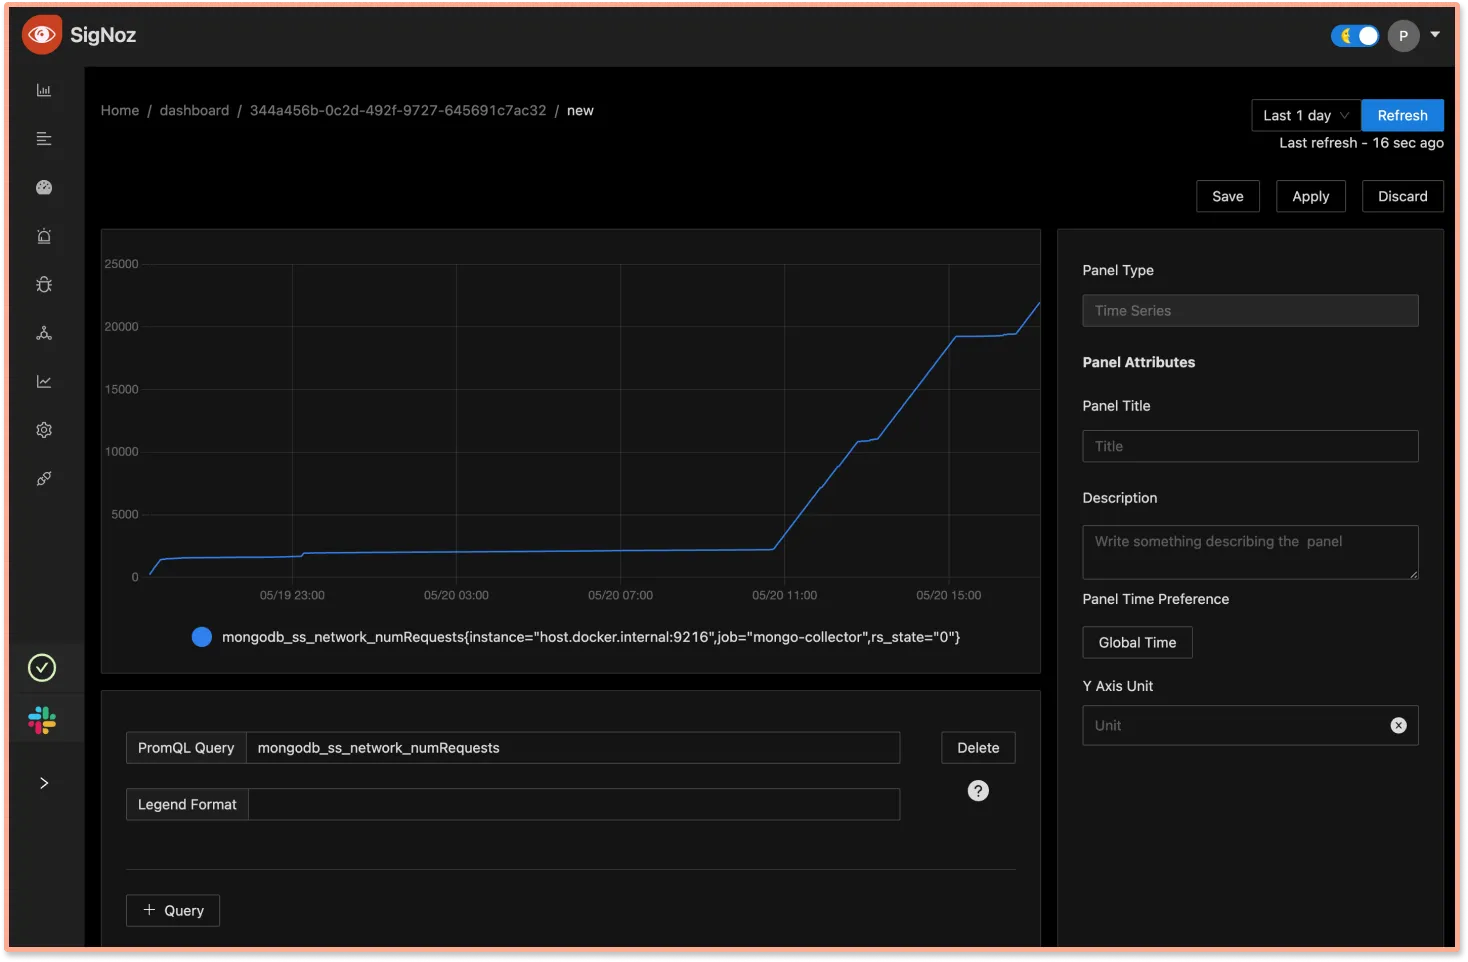
After the above steps, your MongoDB instance will emit host metrics that can be visualized using custom dashboards in SigNoz. You can create different charts using PromQL on the SigNoz dashboard.
Below are few sample PromQL queries:
-
For database connections
mongodb_connections -
For tracking instance uptime
mongodb_instance_uptime_seconds -
For tracking total number of requests
mongodb_network_metrics_num_requests_total
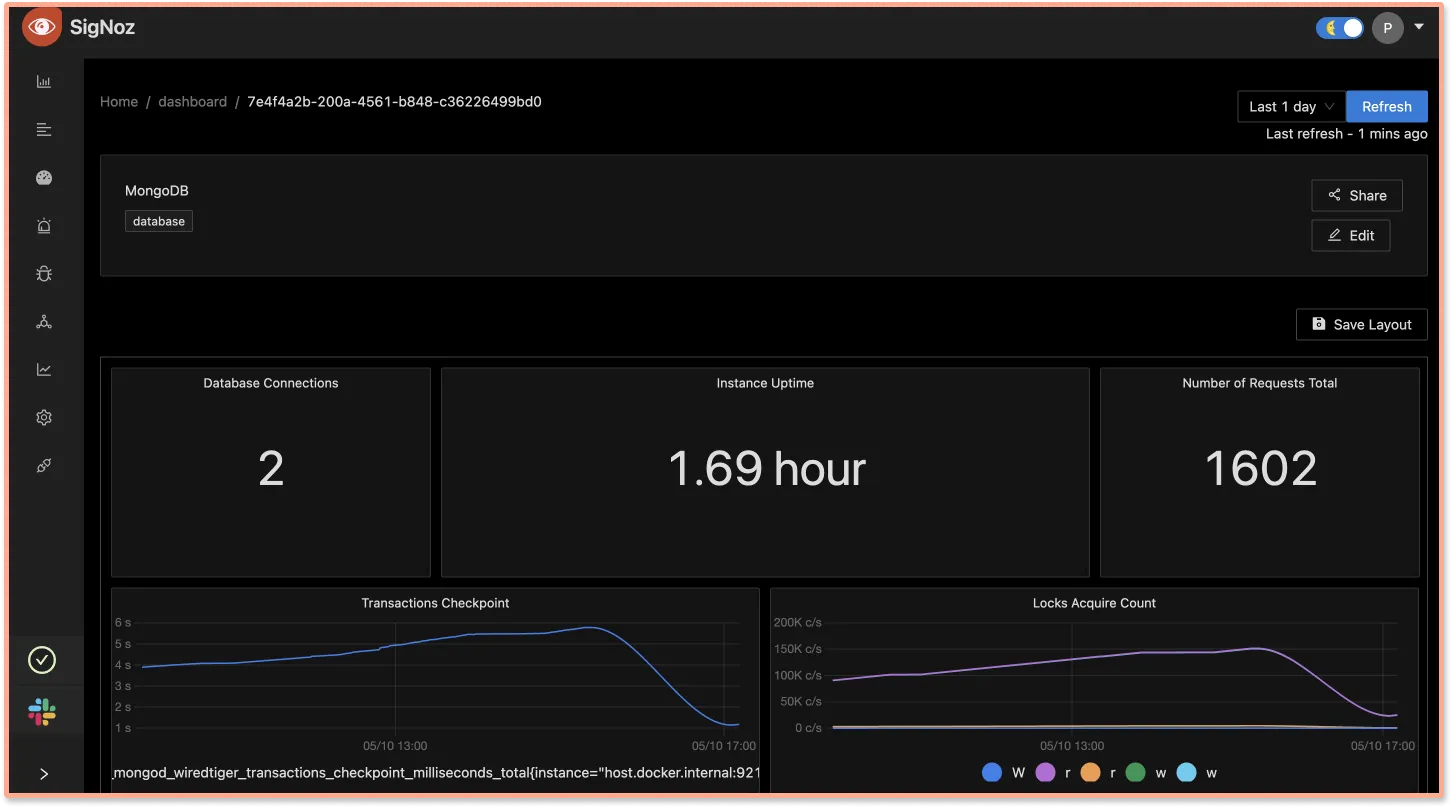
Monitor your MongoDB database with SigNoz
SigNoz provides custom dashboards that you can use to set up charts with metrics that are most critical for your use cases. For MongoDB databases, things like the number of database connections, instance uptime, the total number of requests, and other metrics can be set up to be shown in a single view.
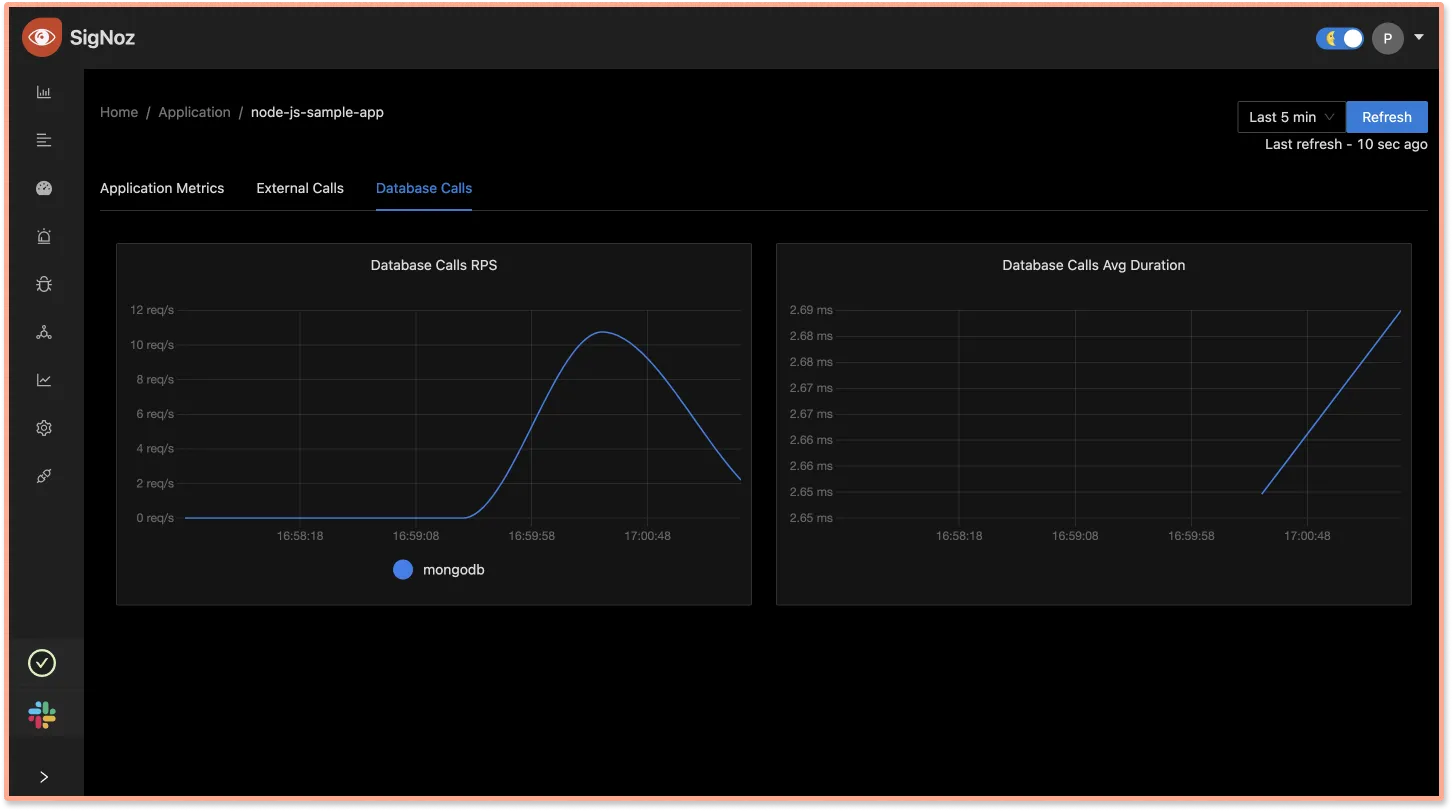
You can monitor important metrics about database calls from a specific service like requests per second and avg. call duration in the Database Calls tab.
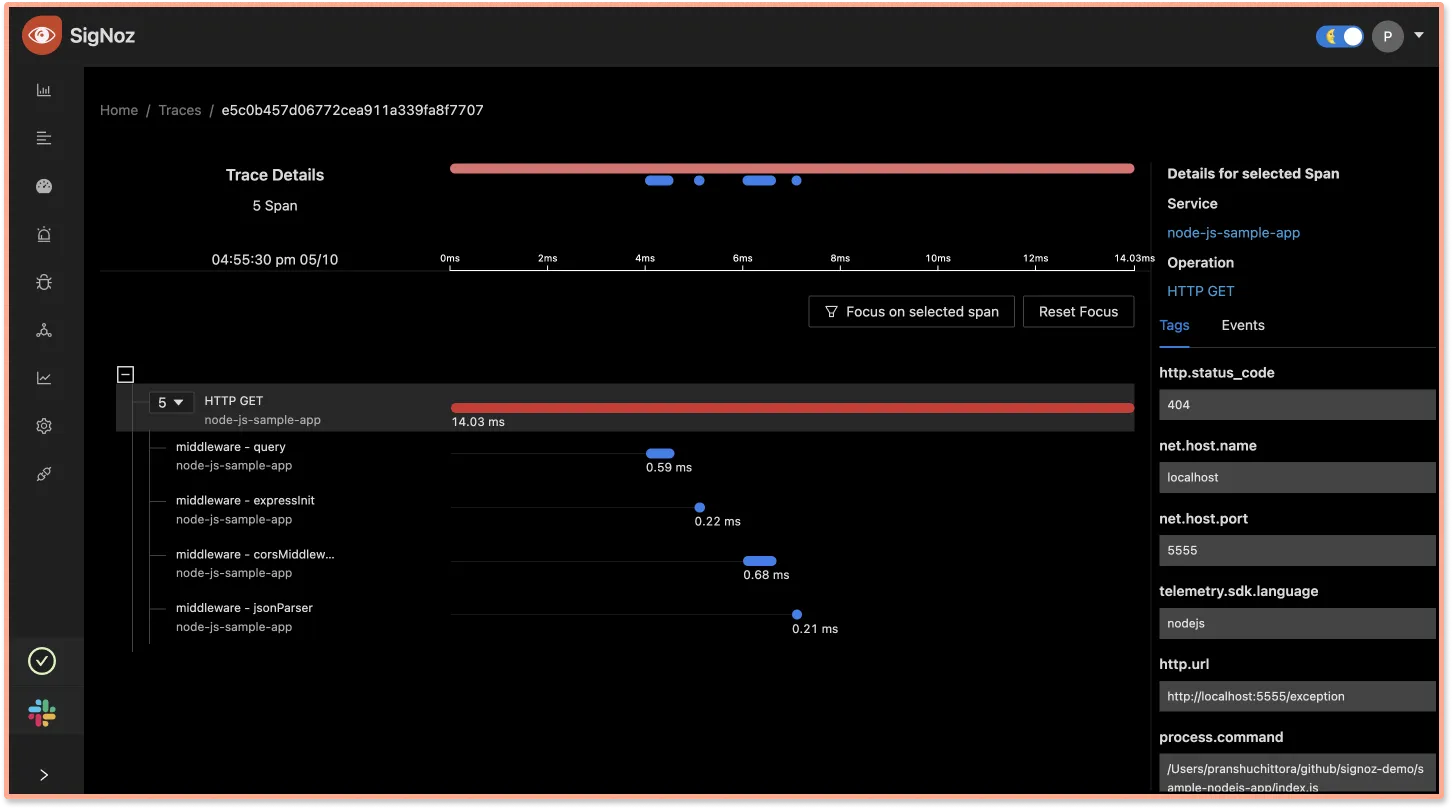
One of the most powerful features that OpenTelemetry enables is distributed tracing. With the tracing visualization on SigNoz dashboard, you can quickly identify performance bottlenecks.
Below are some examples of trace visualization on the SigNoz dashboard.
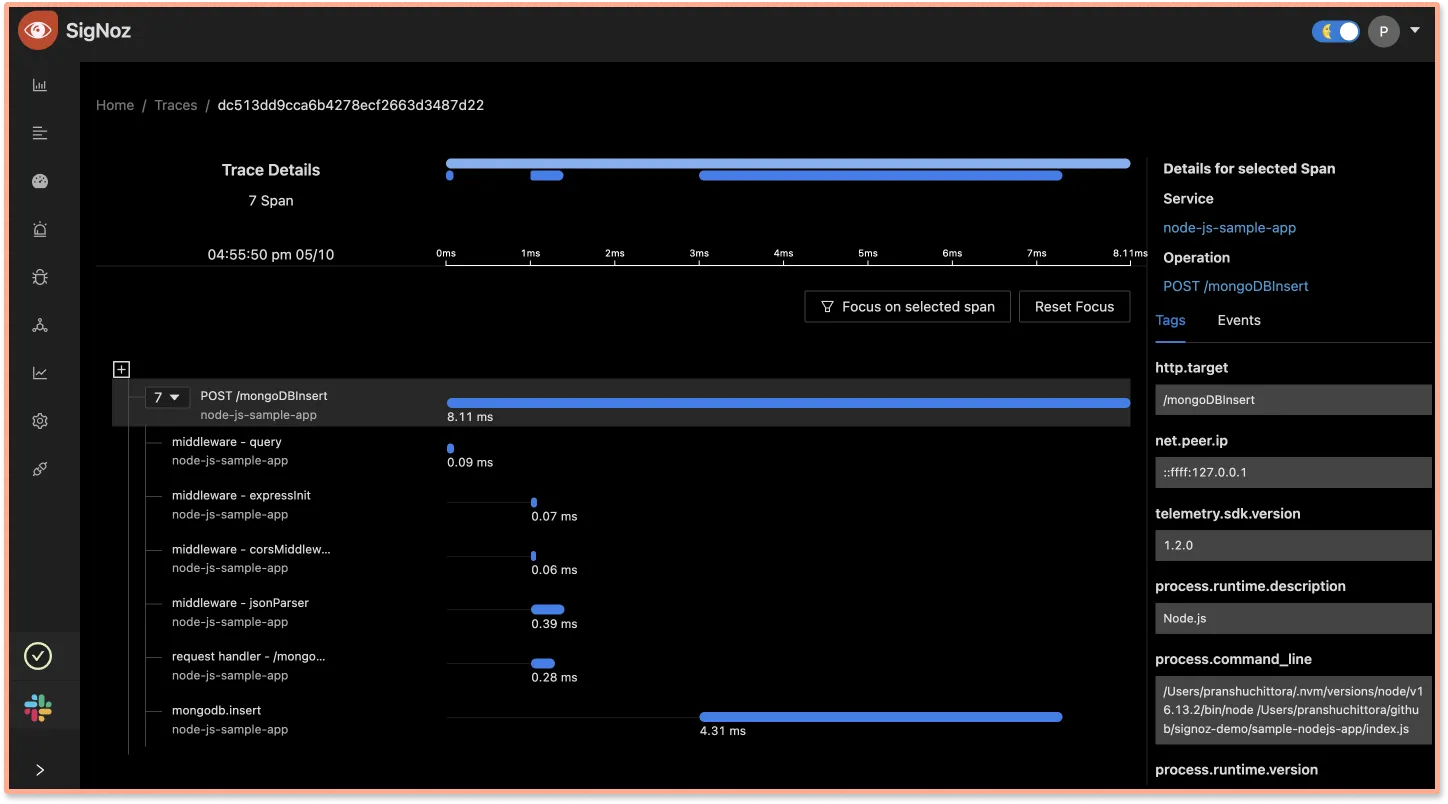
insert operation in MongoDB. You can see how much time each operation took along with other details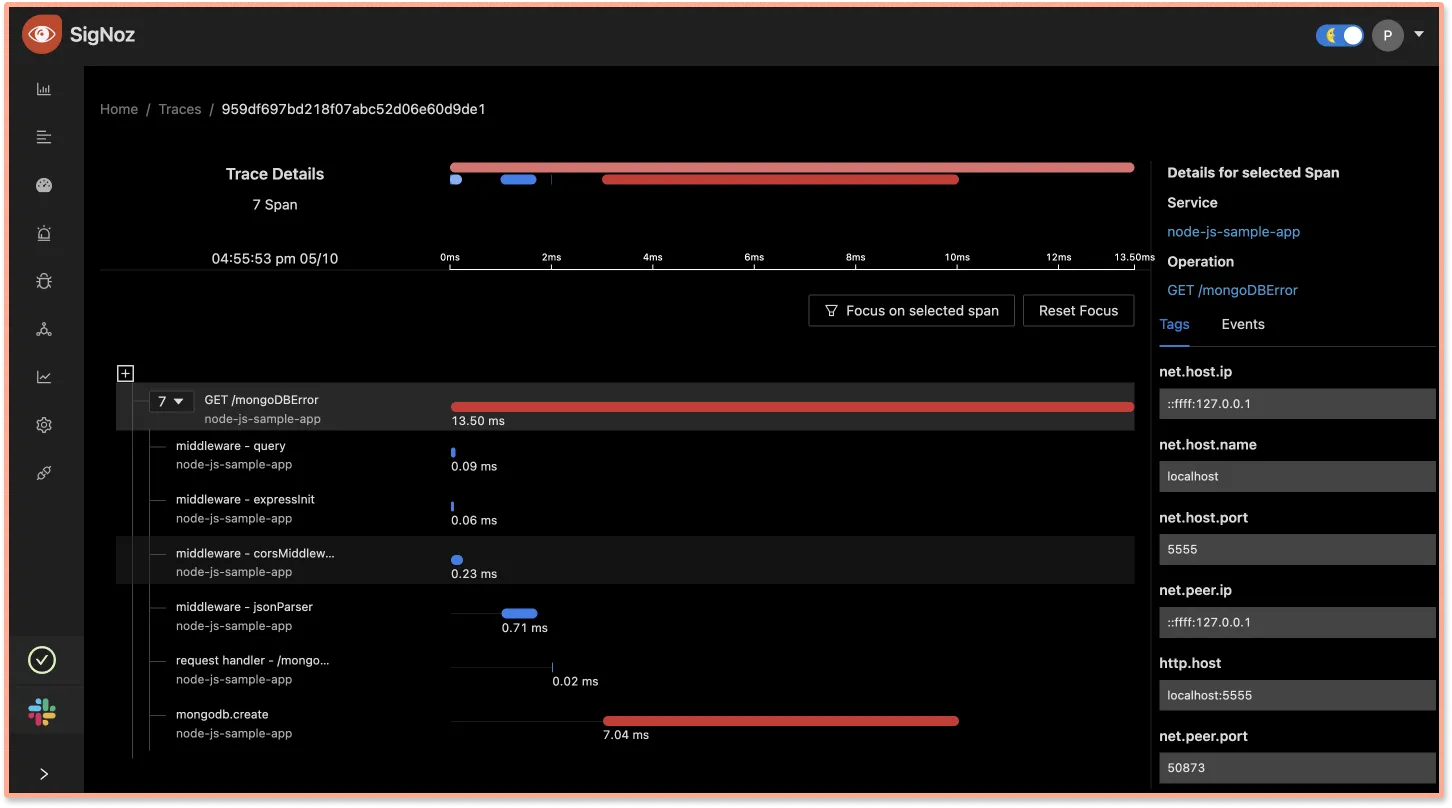
You can find the end-to-end instrumented sample nodejs express app with mongodb over here.
More about OpenTelemetry MongoDB
OpenTelemetry provides language-specific implementation in multiple programming languages to trace MongoDB interactions. We used OpenTelemetry in a sample Nodejs app with MongoDB in the example above. But it can also be sued for other programming languages, like:
- Java
OpenTelemetry MongoDB library for Java applications - Python
OpenTelemetry MongoDB library for Python applications
OpenTelemetry is the future for setting up observability for cloud-native apps. It is backed by a huge community and covers various technology and frameworks. Using OpenTelemetry, engineering teams can instrument polyglot and distributed applications with peace of mind.
After collecting telemetry data with OpenTelemetry, you can use a backend analysis tool like SigNoz. It is built natively to support OpenTelemetry and is also open-source. You can try out SigNoz by visiting its GitHub repo 👇
If you have any questions or need any help in setting things up, join our slack community and ping us in #support channel.

Further Reading
Monitor your Nodejs application with OpenTelemetry and SigNoz
