Implementing OpenTelemetry in React Applications
OpenTelemetry can be used to trace React applications for performance issues and bugs. You can trace user requests from your frontend web application to your downstream services. OpenTelemetry is an open-source project under the Cloud Native Computing Foundation (CNCF) that aims to standardize the generation and collection of telemetry data.
Using OpenTelemetry Web libraries, you can instrument your React apps to generate tracing data. You can track user requests from your frontend web application to your downstream services.
Before we demonstrate how to implement the OpenTelemetry libraries, let's have a brief overview of OpenTelmetry.
What is OpenTelemetry and Why Use it in React Applications?
OpenTelemetry is an open-source vendor-agnostic set of tools, APIs, and SDKs used to instrument applications to create and manage telemetry data(logs, metrics, and traces). It aims to make telemetry data a built-in feature of cloud-native software applications.
The telemetry data is then sent to an observability tool for storage and visualization.
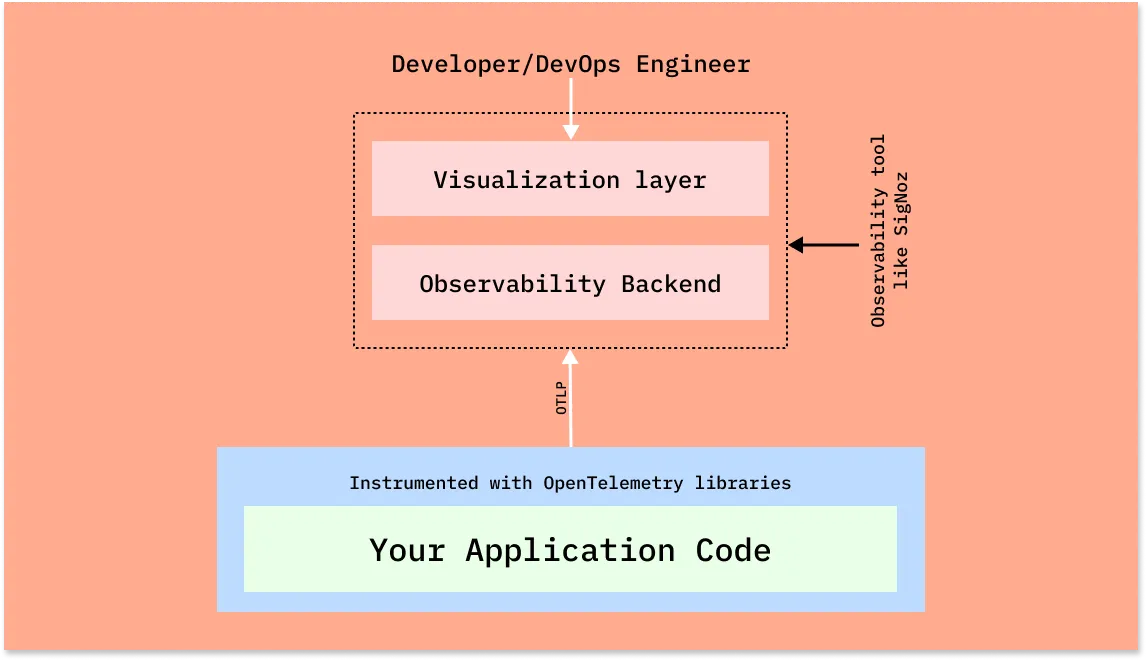
OpenTelemetry is the bedrock for setting up an observability framework. It also provides you the freedom to choose a backend analysis tool of your choice.
For React applications, it offers several key benefits:
- Standardized data collection: OpenTelemetry uses a consistent format for traces, metrics, and logs, making it easier to analyze data across different parts of your application.
- Vendor-agnostic approach: You're not locked into a specific monitoring tool; OpenTelemetry data can be exported to various backends.
- Comprehensive visibility: It allows you to track both frontend and backend performance, providing a holistic view of your application.
- Performance optimization: With detailed metrics and traces, you can identify and resolve bottlenecks in your React components.
By implementing OpenTelemetry in your React application, you gain a powerful toolkit for monitoring, debugging, and optimizing your user experience.
Understanding OpenTelemetry Components for React
To effectively use OpenTelemetry in React, you need to understand its core components:
- Traces: These represent the journey of a request through your application. In React, a trace might include component rendering, API calls, and state updates.
- Metrics: Quantitative data about your application's performance. For React, this could include render times, component mount/unmount durations, or custom business metrics.
- Logs: Textual records of events in your application. While React doesn't have built-in logging, you can integrate custom logs with OpenTelemetry.
- OpenTelemetry SDK: This is the library you'll use to instrument your React application. It provides APIs for creating spans, recording metrics, and managing context.
- OpenTelemetry Collector: An optional component that receives, processes, and exports telemetry data. It's particularly useful for handling data from both frontend and backend services.
- Exporters: These send your telemetry data to your chosen backend system for analysis and visualization.
Understanding these components will help you effectively implement OpenTelemetry in your React projects.
OpenTelemetry and SigNoz
In this article, we will use SigNoz as our backend analysis tool. SigNoz is a full-stack open-source APM tool that can be used for storing and visualizing the telemetry data collected with OpenTelemetry. It is built natively on OpenTelemetry and works on the OTLP data formats.
SigNoz provides query and visualization capabilities for the end-user and comes with out-of-box charts for application metrics and traces.
Now let's get down to how to implement OpenTelemetry Web libraries and then visualize the collected data in SigNoz.
Running React application with OpenTelemetry
Step 1: Install SigNoz or SetUp SigNoz Cloud
First, you need to install SigNoz so that OpenTelemetry can send the data to it.
SigNoz Cloud is the easiest way to run SigNoz. Sign up for a free account and get 30 days of unlimited access to all features.

You can also install and self-host SigNoz yourself since it is open-source. With 24,000+ GitHub stars, open-source SigNoz is loved by developers. Find the instructions to self-host SigNoz.
SigNoz can be installed on macOS or Linux computers in just three steps by using a simple install script.
The install script automatically installs Docker Engine on Linux. However, on macOS, you must manually install Docker Engine before running the install script.
git clone -b main <https://github.com/SigNoz/signoz.git>
cd signoz/deploy/
./install.sh
You can visit our documentation for instructions on how to install SigNoz using Docker Swarm and Helm Charts.

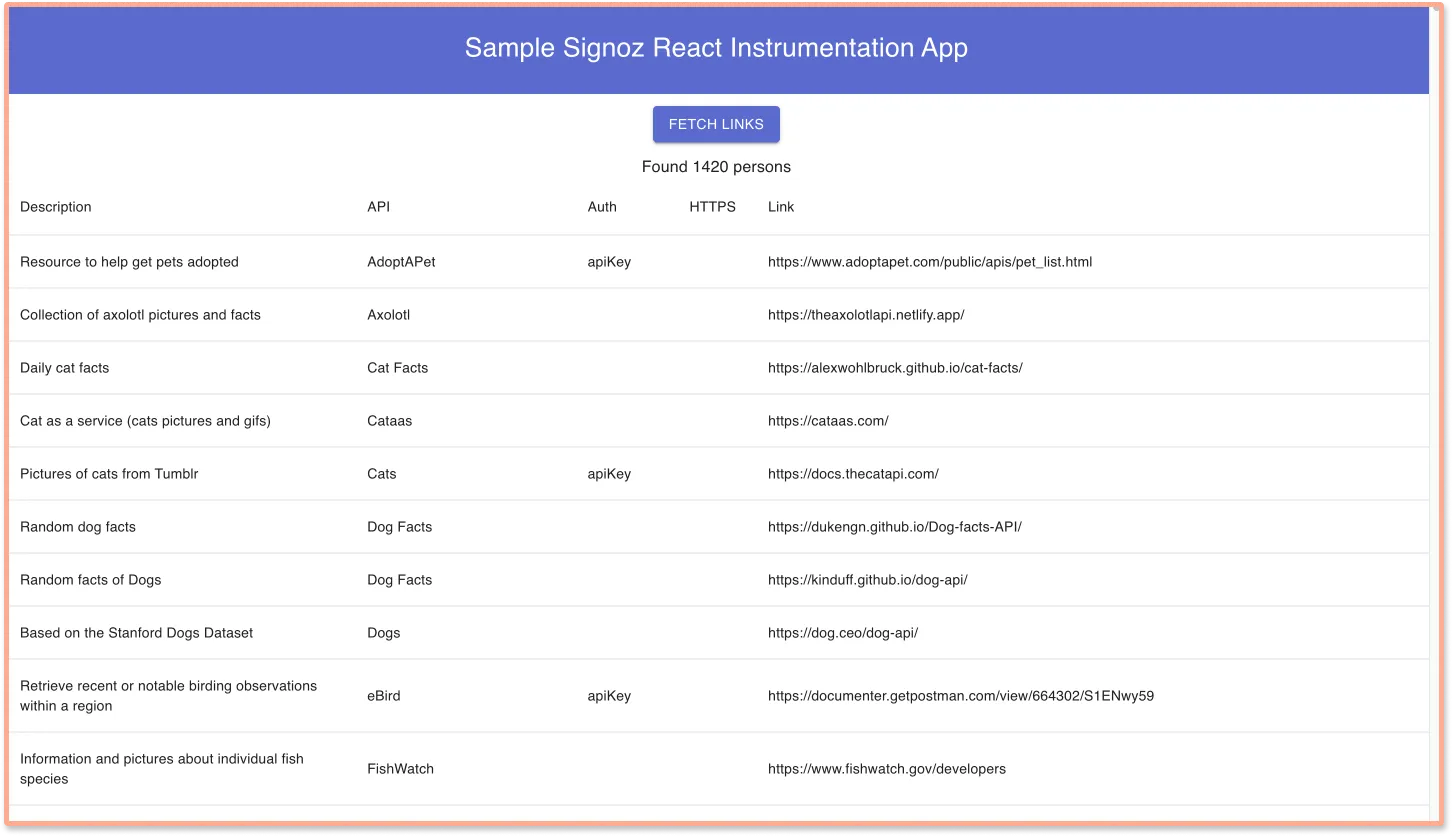
Step 2: Get sample React app
Sample React App
It contains the sample boilerplate code that we will instrument.
git clone git@github.com:SigNoz/sample-reactjs-app.git
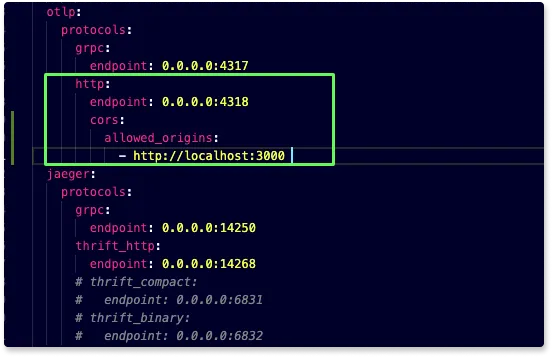
Step 3: Enable CORS in the OTel Receiver
Enable CORS in the OTel Receiver. Under SigNoz folder, open the otel-collector-config.yaml file. The file is located at deploy/docker/otel-collector-config.yaml
You can view the file at SigNoz GitHub repo. Inside the file add the following CORS config:
http:
  cors:
    allowed_origins:
      - <https://netflix.com>  # URL of your Frontend application
You need to update the URL in the config file to match your frontend application URL. For this tutorial, we will be running our frontend application on http://localhost:3000.
http:
  cors:
    allowed_origins:
      - <http://localhost:3000>
Once you make the changes, you need to restart the Docker containers.
To stop SigNoz cluster:
Run it under /signoz/deploy folder at your terminal:
cd deploy/docker
sudo docker compose stop
To start/resume SigNoz cluster:
Run it under /signoz/deploy folder at your terminal:
cd deploy/docker
sudo docker compose start
Step 4: Instrument React app with OpenTelemetry
To instrument the React app with OpenTelemetry, we need to install the OpenTelemetry dependencies.
yarn add -D @opentelemetry/api @opentelemetry/context-zone @opentelemetry/exporter-trace-otlp-http @opentelemetry/instrumentation-fetch
Step 5: Update Service Name and CollectorTrace Exporter
The file is located at src/helpers/tracing/index.ts, in the sample react app codebase.
const serviceName = "sample-react-app";
const resource = new Resource({ "service.name": serviceName });
const provider = new WebTracerProvider({ resource });
const collector = new CollectorTraceExporter({
  url: "<http://localhost:4318/v1/traces>",
});
Step 6: Start the React app
Go to the root folder of your React application, and run the following command:
yarn start
Congratulations! You have successfully run your React application with OpenTelemetry. It's time to see the collected data.
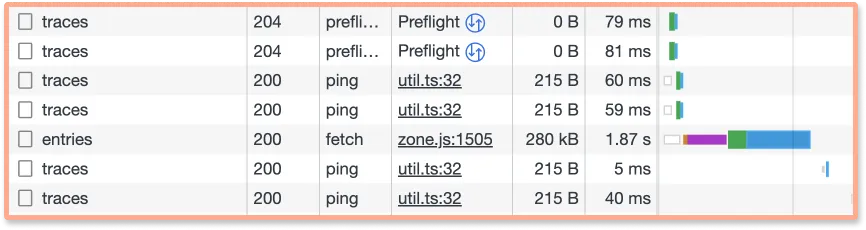
Step 7: Generate some data
In order to monitor your React application with SigNoz, you first need to generate some data.
Visit http://localhost:3000/ to access your frontend application. Using the UI, make some calls to the backend API. You can check the network tab in your browser to see the requests that you have made.
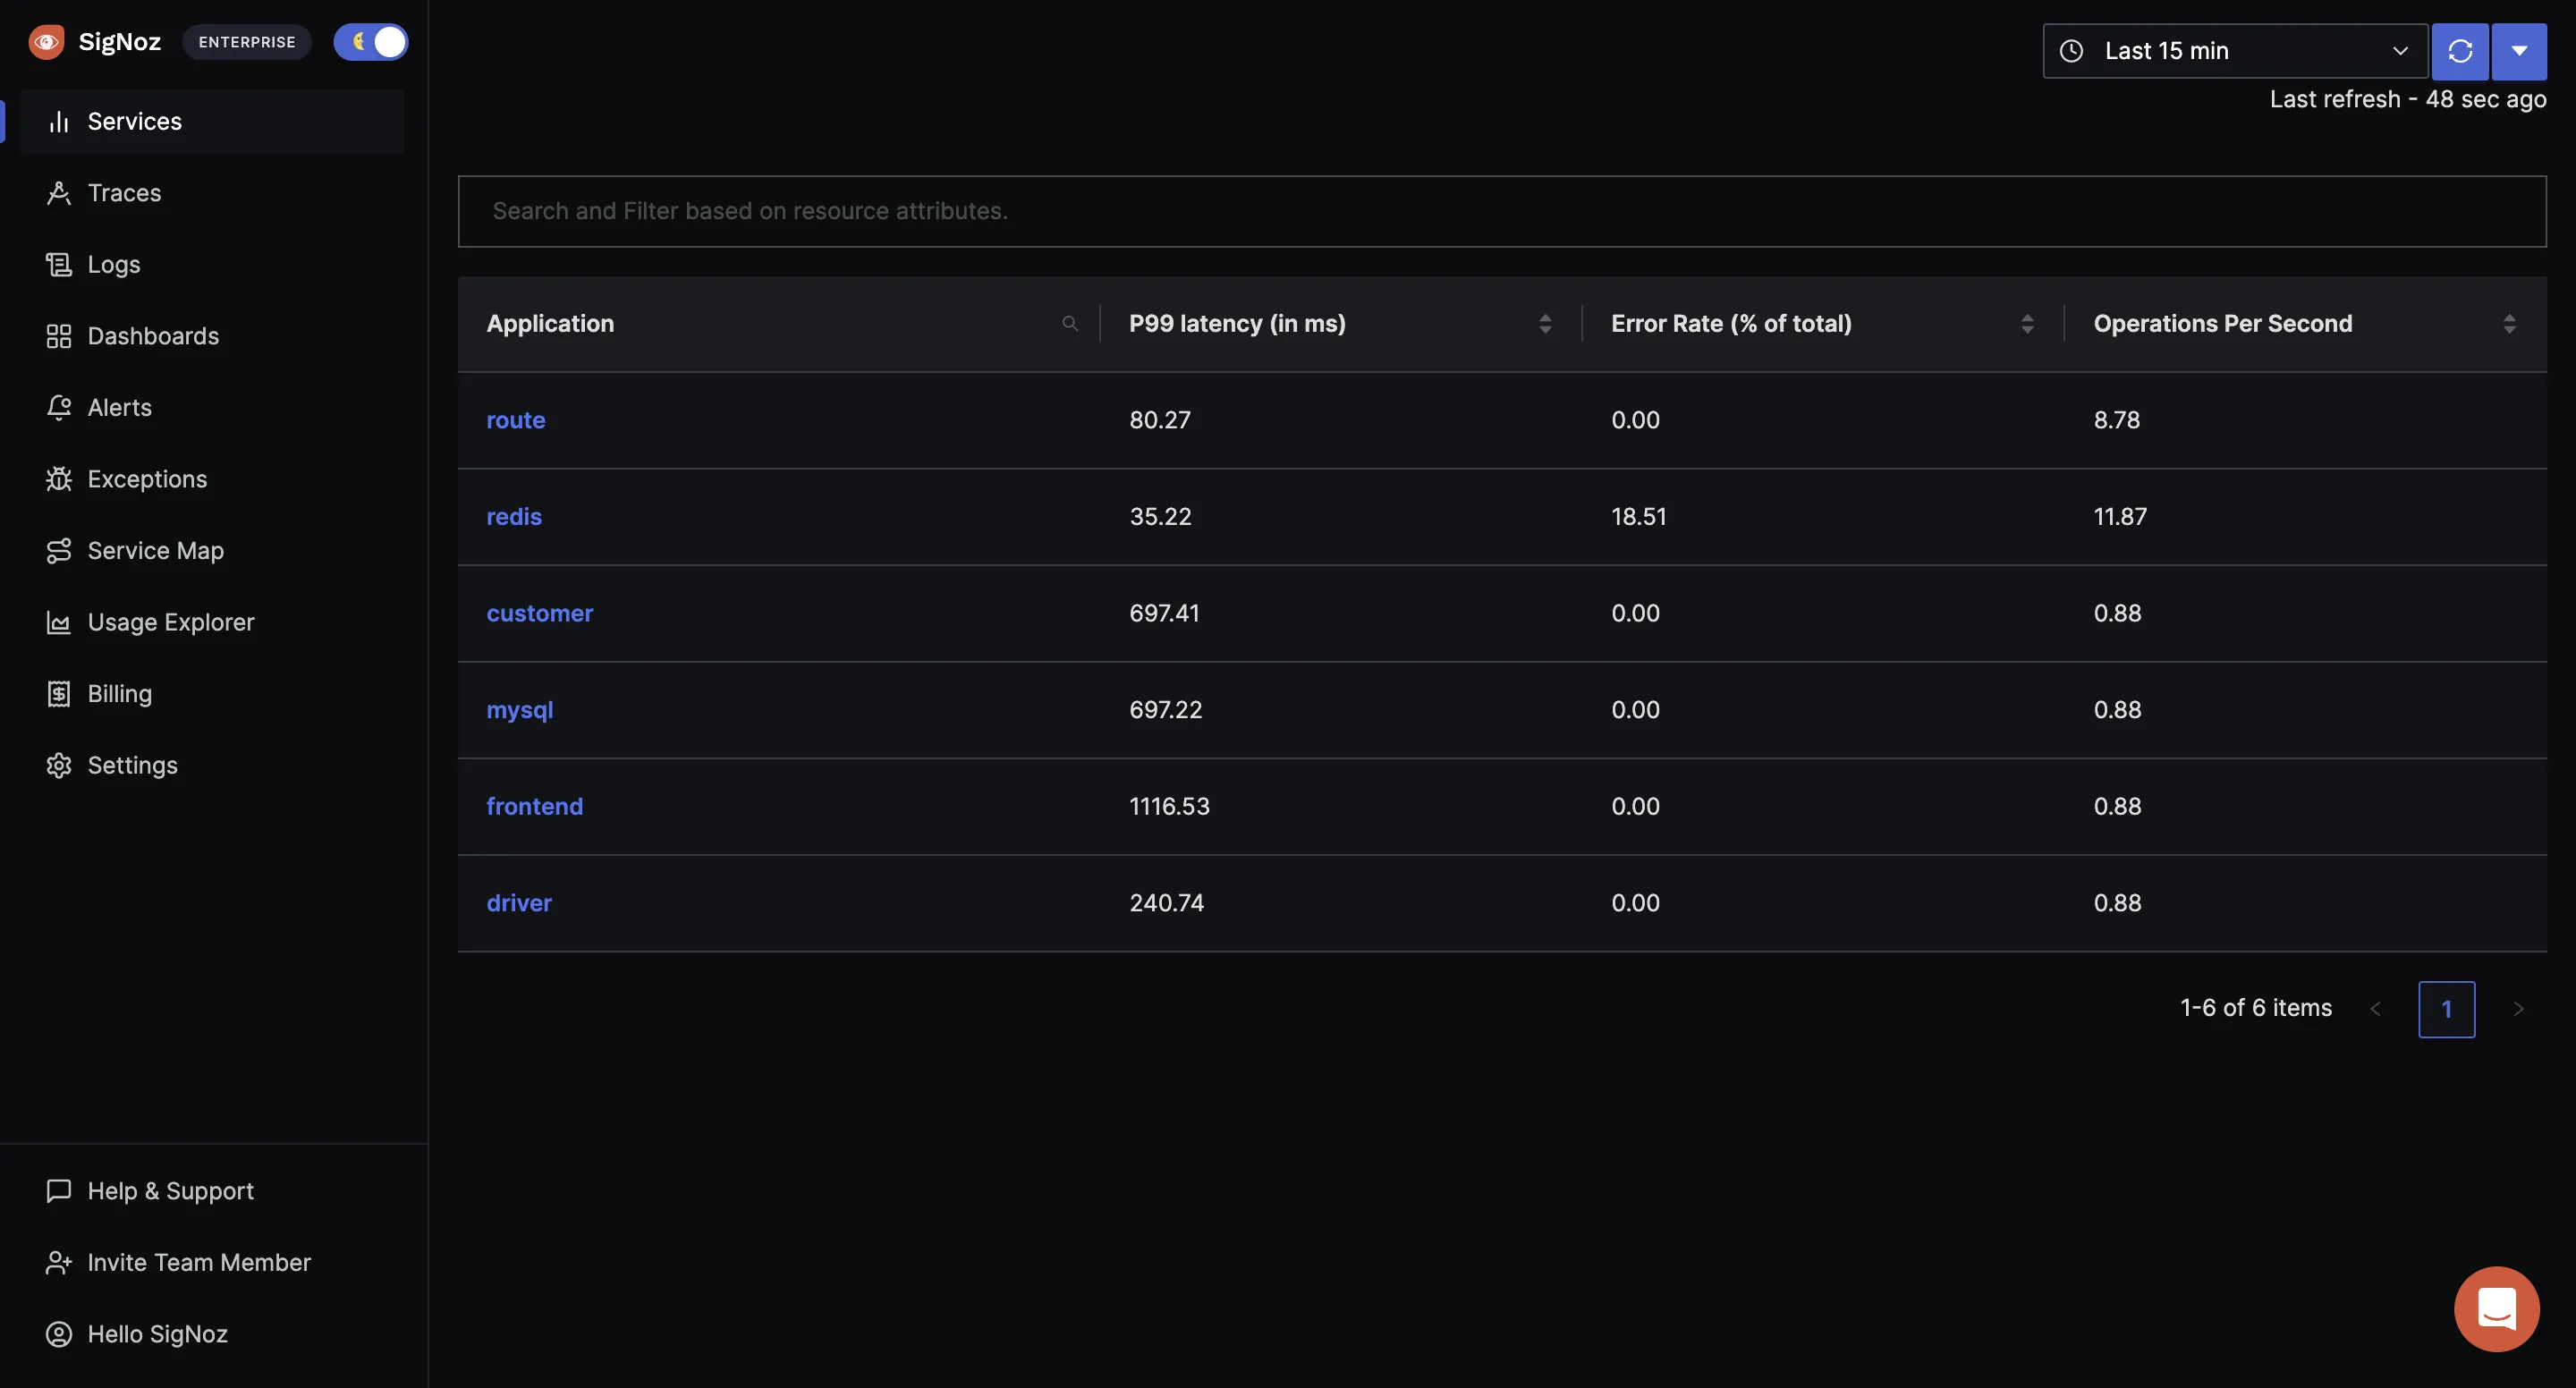
Step 8: Monitor your application with SigNoz
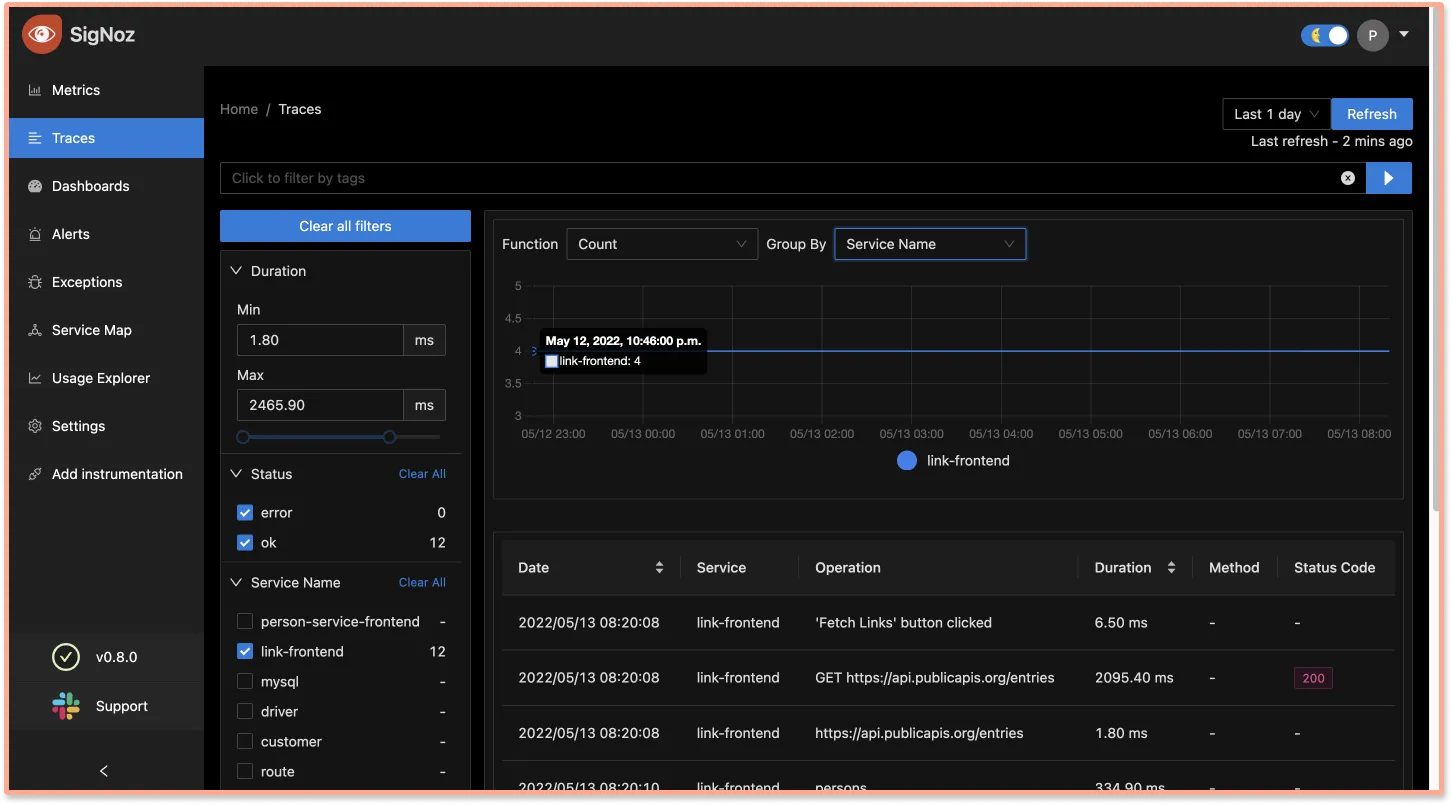
With SigNoz, you can monitor the data collected by OpenTelemetry from your sample React application. You can see end-to-end traces for your React application.
You can analyze your tracing data with powerful filters using the Traces tab on SigNoz dashboard.
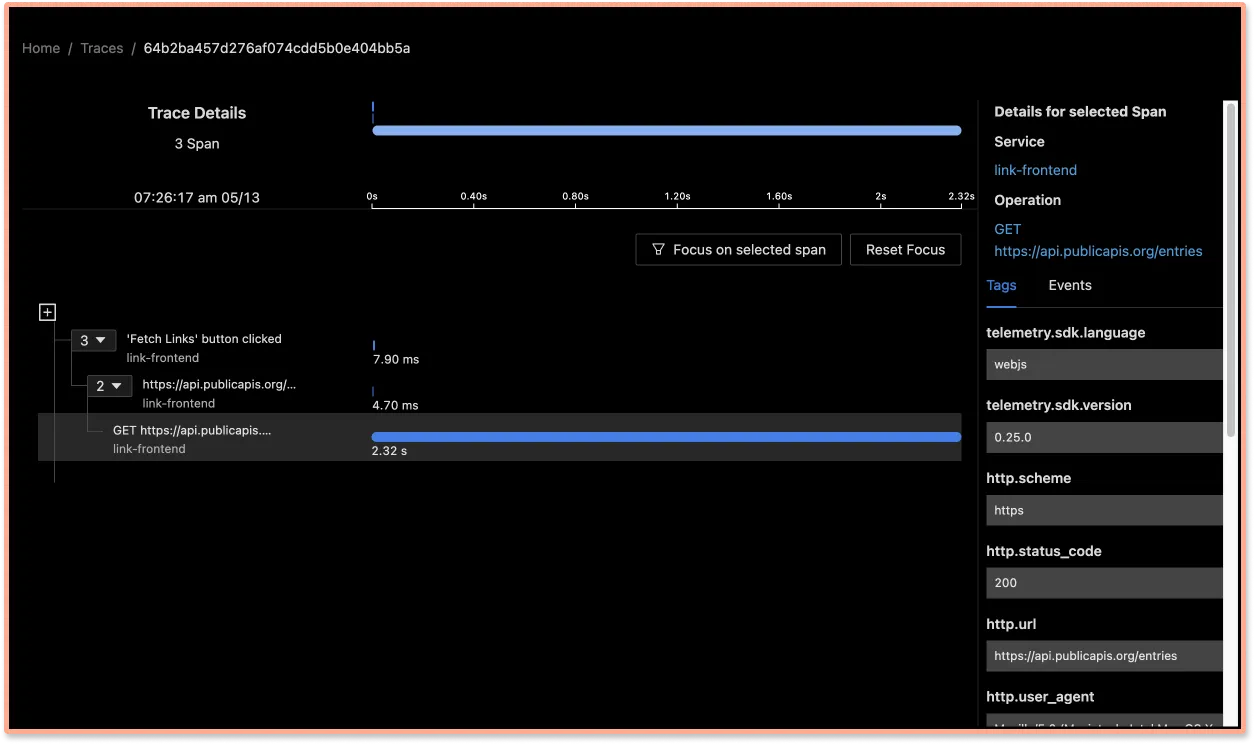
Using Flamegraphs and Gantt charts you can see a complete breakdown of your request.
Optimizing React Performance with OpenTelemetry Insights
OpenTelemetry data can be invaluable for optimizing your React application's performance. Here are some strategies:
- Identify slow-rendering components: Analyze your component render time metrics to find components that take longer to render.
- Optimize re-renders: Use the render count metrics to identify components that are re-rendering unnecessarily. Consider using
React.memooruseMemoto optimize these components. - Improve load times: Use distributed tracing to identify slow API calls or resource loads that are impacting your application's initial load time.
- Monitor user interactions: Create custom spans for important user interactions to ensure they're performing well.
Conclusion
Using OpenTelemetry Web libraries, you can instrument your frontend applications for end-to-end tracing. You can then use an open-source APM tool like SigNoz to ensure the smooth performance of your React applications.
OpenTelemetry is the future for setting up observability for cloud-native apps. It is backed by a huge community and covers a wide variety of technology and frameworks. Using OpenTelemetry, engineering teams can instrument polyglot and distributed applications with peace of mind.
SigNoz is an open-source observability tool that comes with a SaaS-like experience. You can try out SigNoz by visiting its GitHub repo 👇

If you are someone who understands more from video, then you can watch the our video tutorial on how to implement OpenTelemetry React libraries and monitor the application with SigNoz.
If you have any questions or need any help in setting things up, join our slack community and ping us in #support channel.

FAQs
How does OpenTelemetry differ from other monitoring solutions for React?
OpenTelemetry stands out due to its vendor-agnostic approach and standardized data format. Unlike proprietary solutions, OpenTelemetry allows you to switch between different backend systems without changing your instrumentation code. It also provides more granular control over what data you collect and how you collect it.
Can OpenTelemetry be used with existing React monitoring tools?
Yes, OpenTelemetry can be used alongside many existing monitoring tools. In fact, several popular monitoring solutions now support OpenTelemetry data ingestion. This allows you to gradually adopt OpenTelemetry without immediately replacing your current monitoring setup.
What is the performance impact of using OpenTelemetry in a React application?
While OpenTelemetry does add some overhead, it's designed to be lightweight. The exact impact depends on how extensively you instrument your application and how you configure sampling. In most cases, the performance impact is minimal compared to the insights gained. You can always adjust the sampling rate to find the right balance between data granularity and performance.
How can I ensure data privacy when using OpenTelemetry in my React app?
OpenTelemetry provides several ways to manage data privacy:
- Use attribute processors to redact sensitive information before it's exported.
- Implement custom samplers to control which traces are collected.
- Ensure your data is sent securely by using HTTPS for exporters.
- Be mindful of what data you're collecting in your custom instrumentation.
Always review your telemetry data to ensure you're not inadvertently collecting sensitive user information.
What is OpenTelemetry and why is it useful for React applications?
OpenTelemetry is an open-source observability framework that provides a standardized way to collect and export telemetry data (traces, metrics, and logs) from your applications. For React applications, it offers enhanced monitoring capabilities, allowing developers to track performance, identify bottlenecks, and debug issues more effectively across both frontend and backend components.
How does OpenTelemetry integration affect the performance of my React app?
OpenTelemetry is designed to have minimal impact on application performance. While it does add some overhead due to the instrumentation, this is generally negligible in most React applications. You can also configure sampling rates to further reduce any potential performance impact while still collecting valuable data.
Can OpenTelemetry be used with existing monitoring tools for React applications?
Yes, OpenTelemetry is designed to be vendor-agnostic. This means you can use it alongside many existing monitoring tools, or you can easily switch between different backend analysis tools without changing your instrumentation code. Many popular monitoring solutions now support ingesting OpenTelemetry data.
What types of data can I collect from my React application using OpenTelemetry?
With OpenTelemetry, you can collect various types of telemetry data from your React application, including:
- Traces of user interactions and API calls
- Performance metrics such as component render times and load times
- Custom events and logs
- Network requests and responses
- React component lifecycle events
Do I need to modify my existing React code significantly to implement OpenTelemetry?
While some code changes are necessary to implement OpenTelemetry, they are generally minimal and non-invasive. Most of the instrumentation can be done at the application level, and many libraries and frameworks have auto-instrumentation options. You may need to add some custom instrumentation for specific components or events you want to track.
How can OpenTelemetry help in debugging React application issues?
OpenTelemetry provides detailed tracing capabilities, allowing you to follow a request's journey through your entire application stack. This makes it easier to identify where errors occur or performance degrades. For React applications, you can trace issues from user interactions in the frontend all the way to backend service calls, providing a comprehensive view for debugging.
Is OpenTelemetry suitable for both small and large-scale React applications?
Yes, OpenTelemetry is scalable and can be beneficial for React applications of all sizes. For smaller applications, it provides valuable insights into performance and user experience. For larger, more complex applications, OpenTelemetry's distributed tracing capabilities become even more powerful, helping to manage and optimize performance across multiple services and components.
Further Reading
