OpenTelemetry and Jaeger | Key Features & Differences [2026]
OpenTelemetry is a broader, vendor-neutral framework for generating and collecting telemetry data (logs, metrics, traces), offering flexible backend integration. Jaeger, on the other hand, is focused on distributed tracing in microservices. Earlier Jaeger had its own SDKs based on OpenTracing APIs for instrumenting applications, but now Jaeger recommends using OpenTelemetry instrumentation and SDKs.
The original Jaeger client SDKs (based on OpenTracing) are archived and no longer maintained. For any new project, using the OpenTelemetry SDK is the only supported path for instrumenting your applications to send data to Jaeger.
Both OpenTelemetry and Jaeger are open-source projects incubated under Cloud Native Computing Foundation. OpenTelemetry and Jaeger enable application owners to set up monitoring and observability to measure application performance. But their solutions are meant for different problems. While OpenTelemetry helps generate telemetry data, Jaeger is a distributed tracing tool.
Here are some quick takeaways of OpenTelemetry vs Jaeger:
Scope and Functionality:
OpenTelemetry is a comprehensive tool for generating and managing telemetry data (logs, metrics, traces) and is vendor-agnostic, while Jaeger specializes in distributed tracing in microservices environments.Instrumentation and Data Collection:
OpenTelemetry provides a broad set of APIs and libraries for various languages to instrument applications, whereas Jaeger is focused on tracing and does not support logs or metrics.Backend Compatibility:
OpenTelemetry offers flexibility in choosing various backend systems and supports multiple data formats. In contrast, Jaeger acts as a backend for storing and visualizing trace data with specific storage backend support like Cassandra and Elasticsearch.User Interface and Features:
Jaeger provides a limited UI with core features focused on tracing, whereas OpenTelemetry, being primarily an instrumentation framework, relies on other tools for data visualization and analysis.
Before we deep-dive into differences of OpenTelemetry and Jaeger, let's have a brief overview of both projects.
What is Observability? In control theory, the term “observability” states that a system is observable if the internal states of the system can be determined by looking at its inputs and outputs. For distributed software systems, observability means how well we are able to troubleshoot our systems for performance issues with collected data from the system.
What is OpenTelemetry?
OpenTelemetry is an open-source project under the Cloud Native Computing Foundation (CNCF) that aims to standardize the generation and collection of telemetry data. Telemetry data includes logs, metrics, and traces.
It is a collection of APIs, SDKs, and client libraries that is used to generate telemetry data from your application code. The data you collect with OpenTelemetry is vendor-agnostic and can be exported in many formats.
The biggest advantage of using OpenTelemetry is that you have the freedom to choose a backend of your choice. You don’t get locked into a vendor, and engineering teams can get ramped up on a single technology to generate telemetry data.
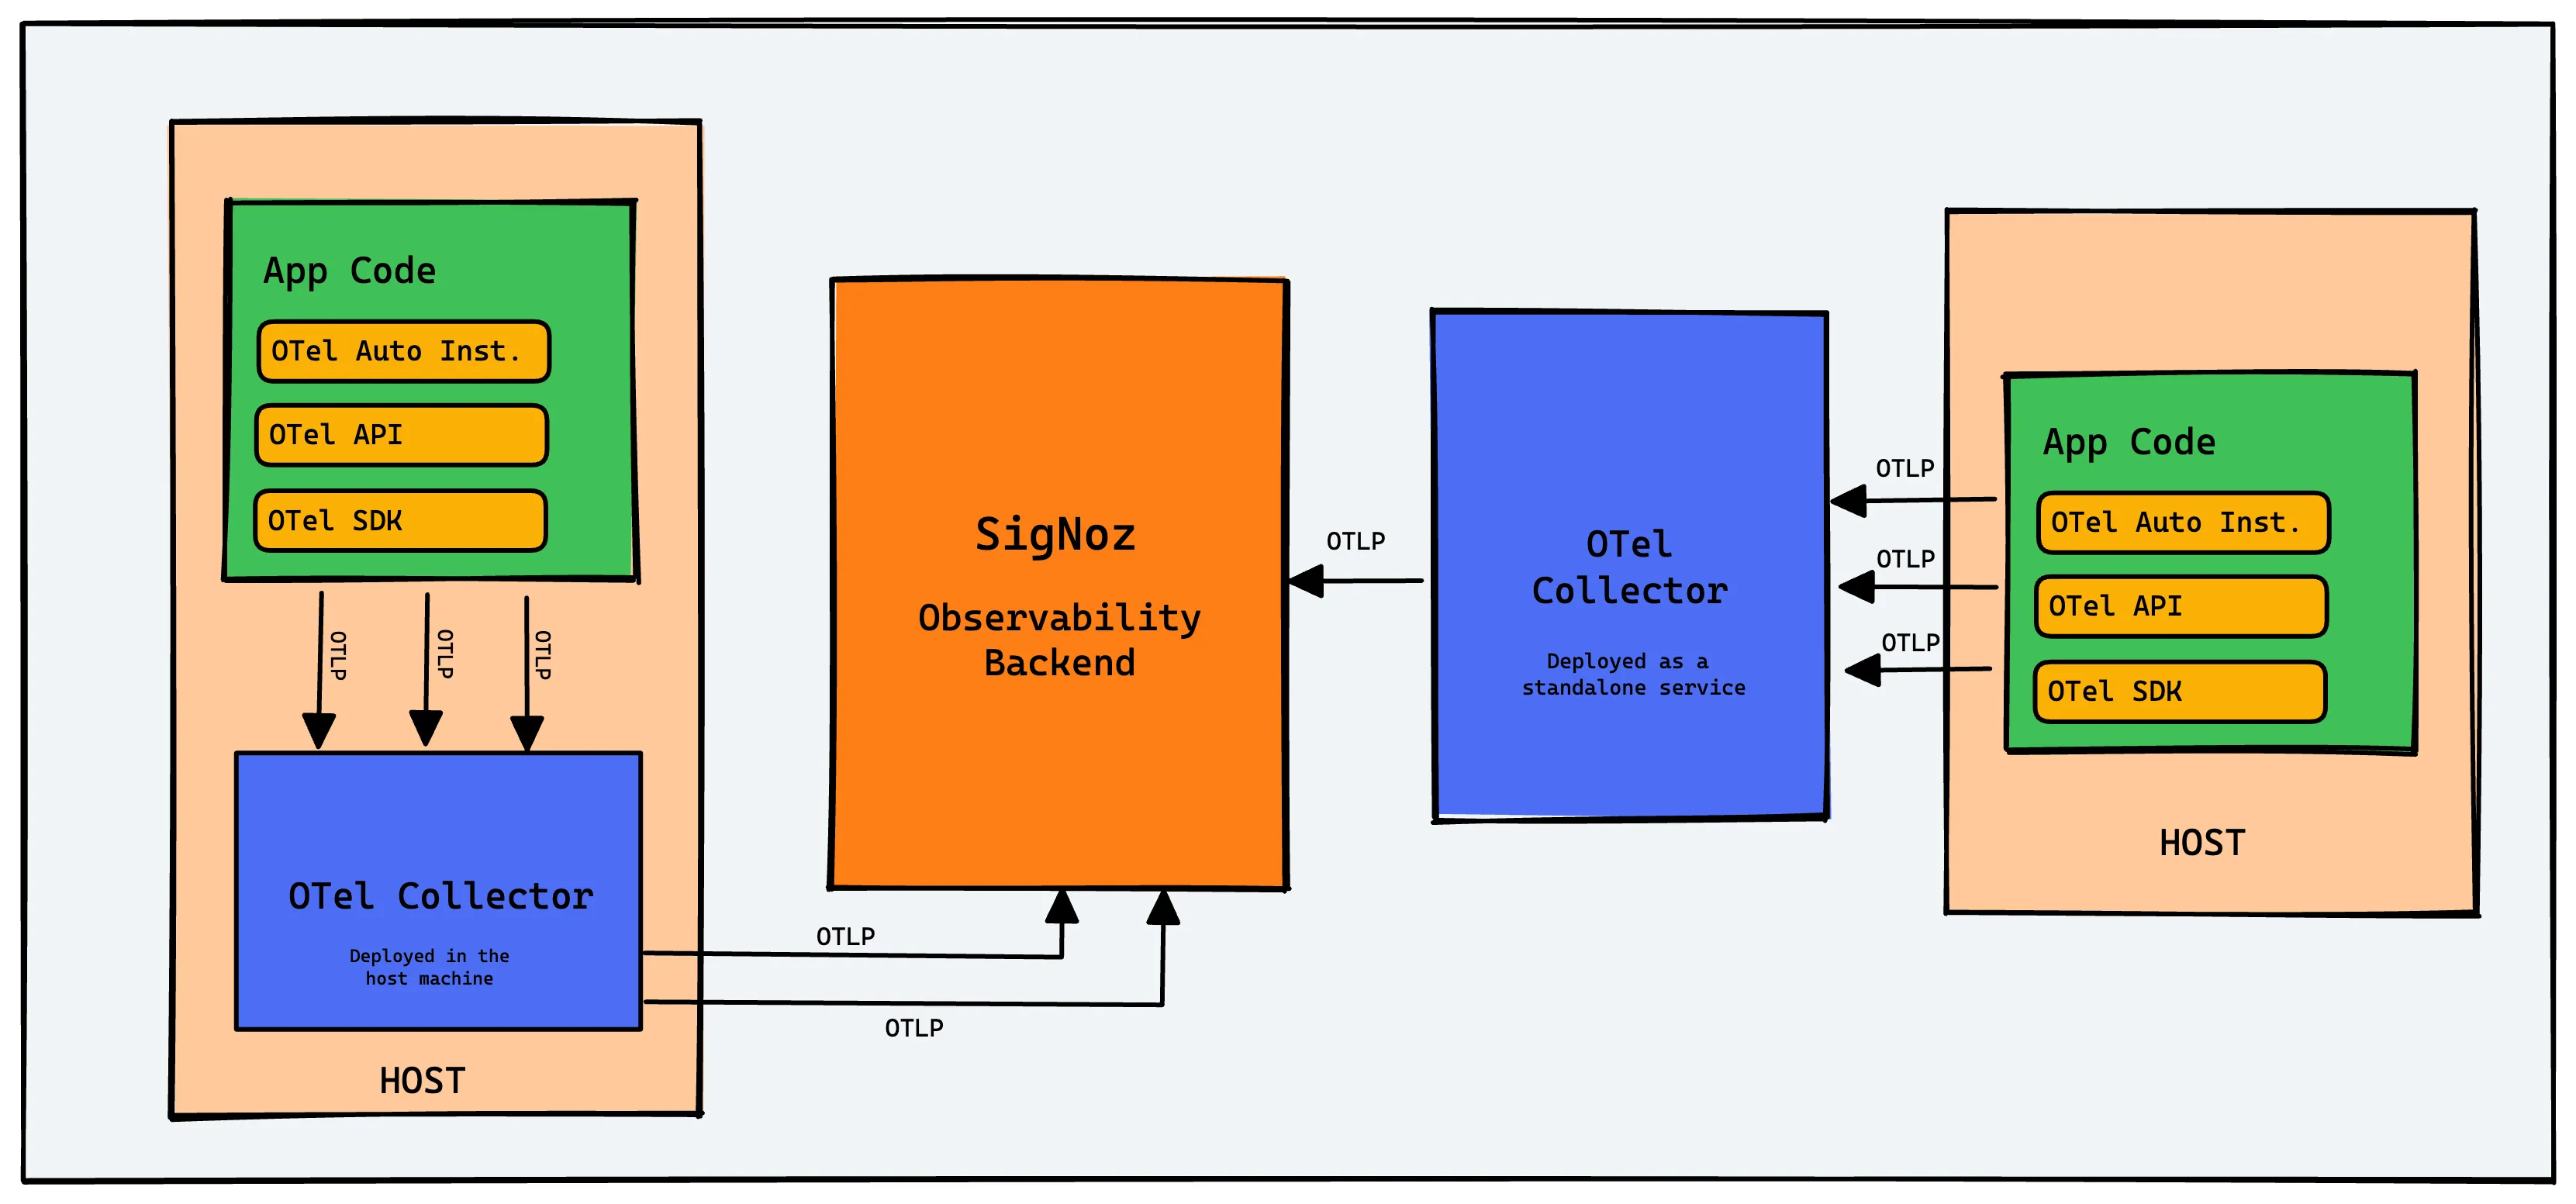
To integrate OpenTelemetry with your application code, you can use the OpenTelemetry client libraries of the required programming language. OpenTelemetry also provides a collector known as OTel (OpenTelemetry) collector that can be used to process and export telemetry data in multiple formats.
What is Jaeger?
Jaeger is a popular open-source distributed tracing tool that was originally built by teams at Uber and then open-sourced. It is used to monitor and troubleshoot applications based on microservices architecture.
A distributed tracing tool tracks user requests across services and gives a central overview of how different components of a microservices architecture interact to process user requests. Jaeger is used to store, analyze and visualize tracing data.
Jaeger does not support logs and metrics.
It provides instrumentation libraries that were built on OpenTracing standards. The libraries cover popular programming languages like Go, Java, Node, Python, C++, and C#. For storing trace data, Jaeger has a pluggable architecture. It has long supported scalable backends like Cassandra and Elasticsearch. More recently, Jaeger has also introduced experimental support for a simplified, built-in storage option.
The in-memory storage is not intended for production workloads. It’s intended as a simple solution to get started quickly and data will be lost once the process is gone.
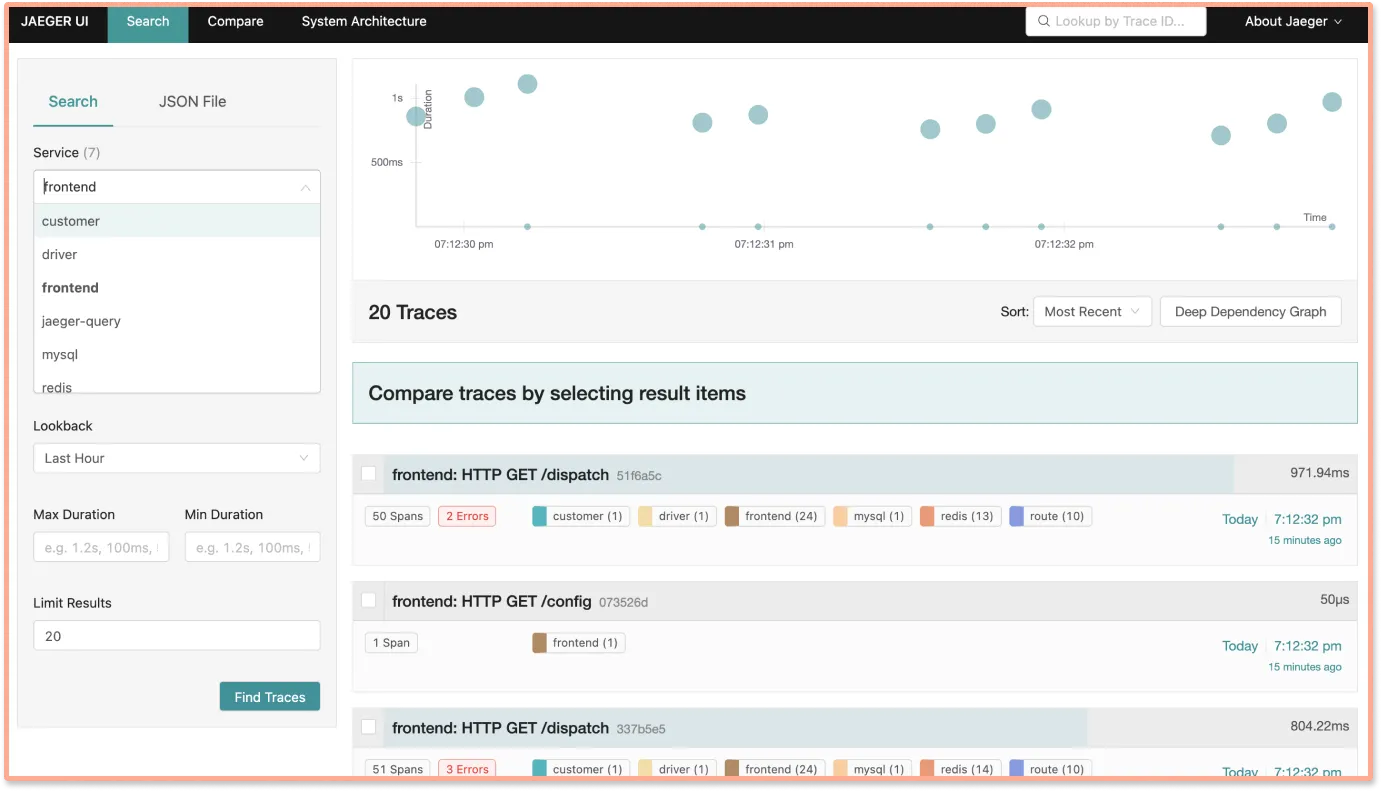
Jaeger provides a minimal UI to analyze the trace data captured.
Comparing OpenTelemetry and Jaeger
While both OpenTelemetry and Jaeger are tools that enable setting up observability for modern-day cloud-native applications, they are meant to solve different problems.
There are two major steps involved in setting up observability for your application:
- Collecting relevant data that indicates the application health
- Storing, managing, and visualizing the collected data to take quick actions
OpenTelemetry addresses the first step, while Jaeger is meant to address the latter. In the domain of observability, a tool like Jaeger is called an observability backend, while OpenTelemetry provides instrumentation. Instrumentation is the process of enabling your application code to generate telemetry data.
You can use OpenTelemetry as your instrumentation layer and Jaeger for storing and visualizing trace data.
The key differences between OpenTelemetry and Jaeger can be summarized in the following points:
- OpenTelemetry provides an instrumentation layer for your application code, while Jaeger is a backend analysis tool used for storage and visualization of trace data.
- Using OpenTelemetry libraries, you can generate logs, metrics, and traces. Jaeger does not support logs and metrics.
- OpenTelemetry can only be used to generate and collect data. It does not provide a storage layer. Jaeger provides Cassandra and Elasticsearch as two options for storing data.
- OpenTelemetry does not provide any web UI components. Jaeger comes with a web UI component that is used for visualizing trace data.
Key Features of OpenTelemetry and Jaeger
Both OpenTelemetry and Jaeger aim to improve the observability of cloud-native applications by targeting different levels of the observability stack.
The main features of OpenTelemetry as an instrumentation layer include:
- A single consistent instrumentation layer covering multiple programming languages and technologies
- Generation and collection of telemetry data that includes logs, metrics, and traces
- Supports exporting telemetry data in multiple data formats to a backend of choice
- Cross-language capabilities with the ability to produce telemetry data in consistent formats across all major programming languages
While OpenTelemetry gives you access to raw data needed to analyze application health, Jaeger provides the analysis and storage layer to the end-user, i.e., the application owner.
The main features of Jaeger as a distributed tracing tool include:
- Distributed transaction monitoring with traces
- Performance and latency optimization
- Root cause analysis
- Service dependency analysis
- Distributed context propagation
A better alternative to Jaeger
OpenTelemetry is the future of instrumentation for cloud-native applications. It is backed by a huge community of developers, observability vendors, and cloud vendors. Modern-day distributed software systems are complex to operate and troubleshoot.
Instrumenting every aspect of your application and infrastructure is the first critical step to keeping a check on application performance. OpenTelemetry can take care of the entire instrumentation layer as it supports multiple programming languages and technologies.
The next step is about choosing a backend analysis tool. Jaeger supports data formats of OpenTelemetry. But Jaeger is limited in terms of its UI and does only distributed tracing. For a robust monitoring and observability framework, you need a unified UI for both metrics, traces and logs. And that's where SigNoz is far more suited than Jaeger as a distributed tracing tool.
SigNoz is a full-stack application performance monitoring and observability tool which can be used in place of Jaeger. SigNoz is built to support OpenTelemetry natively. It also provides a fast OLAP database - ClickHouse as the storage backend.
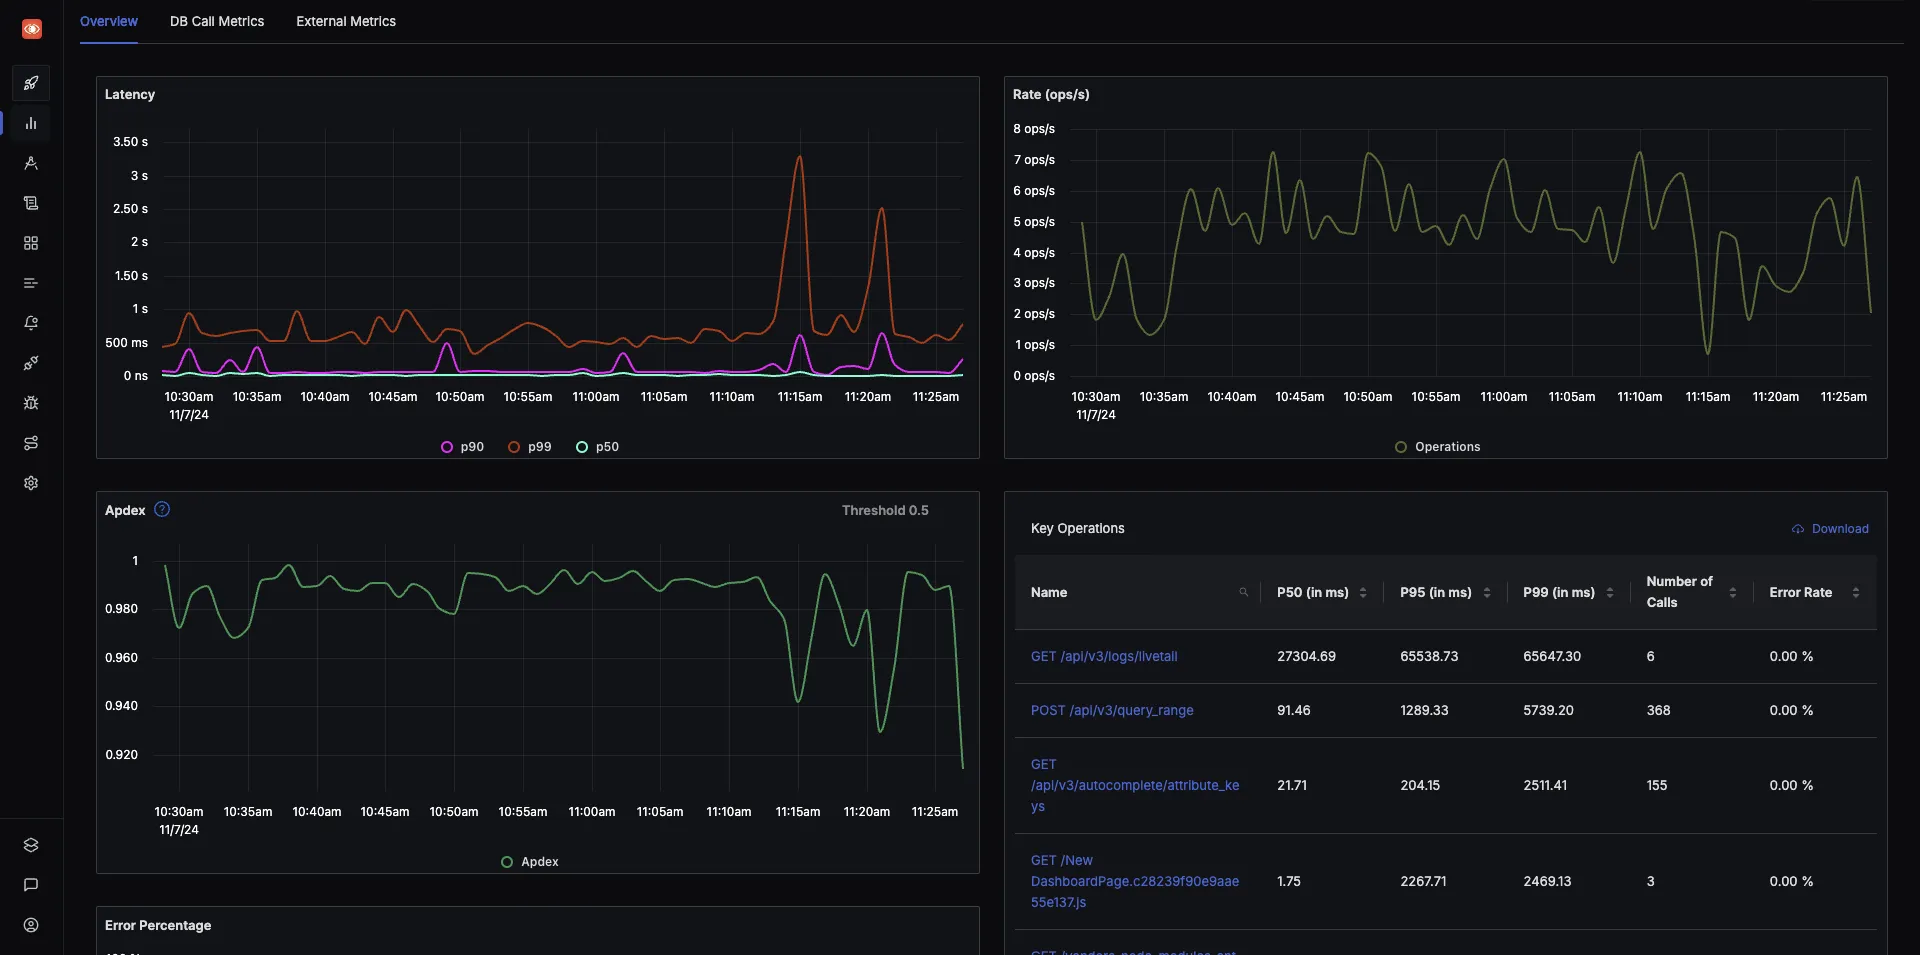
It comes with out-of-box application metrics charts.
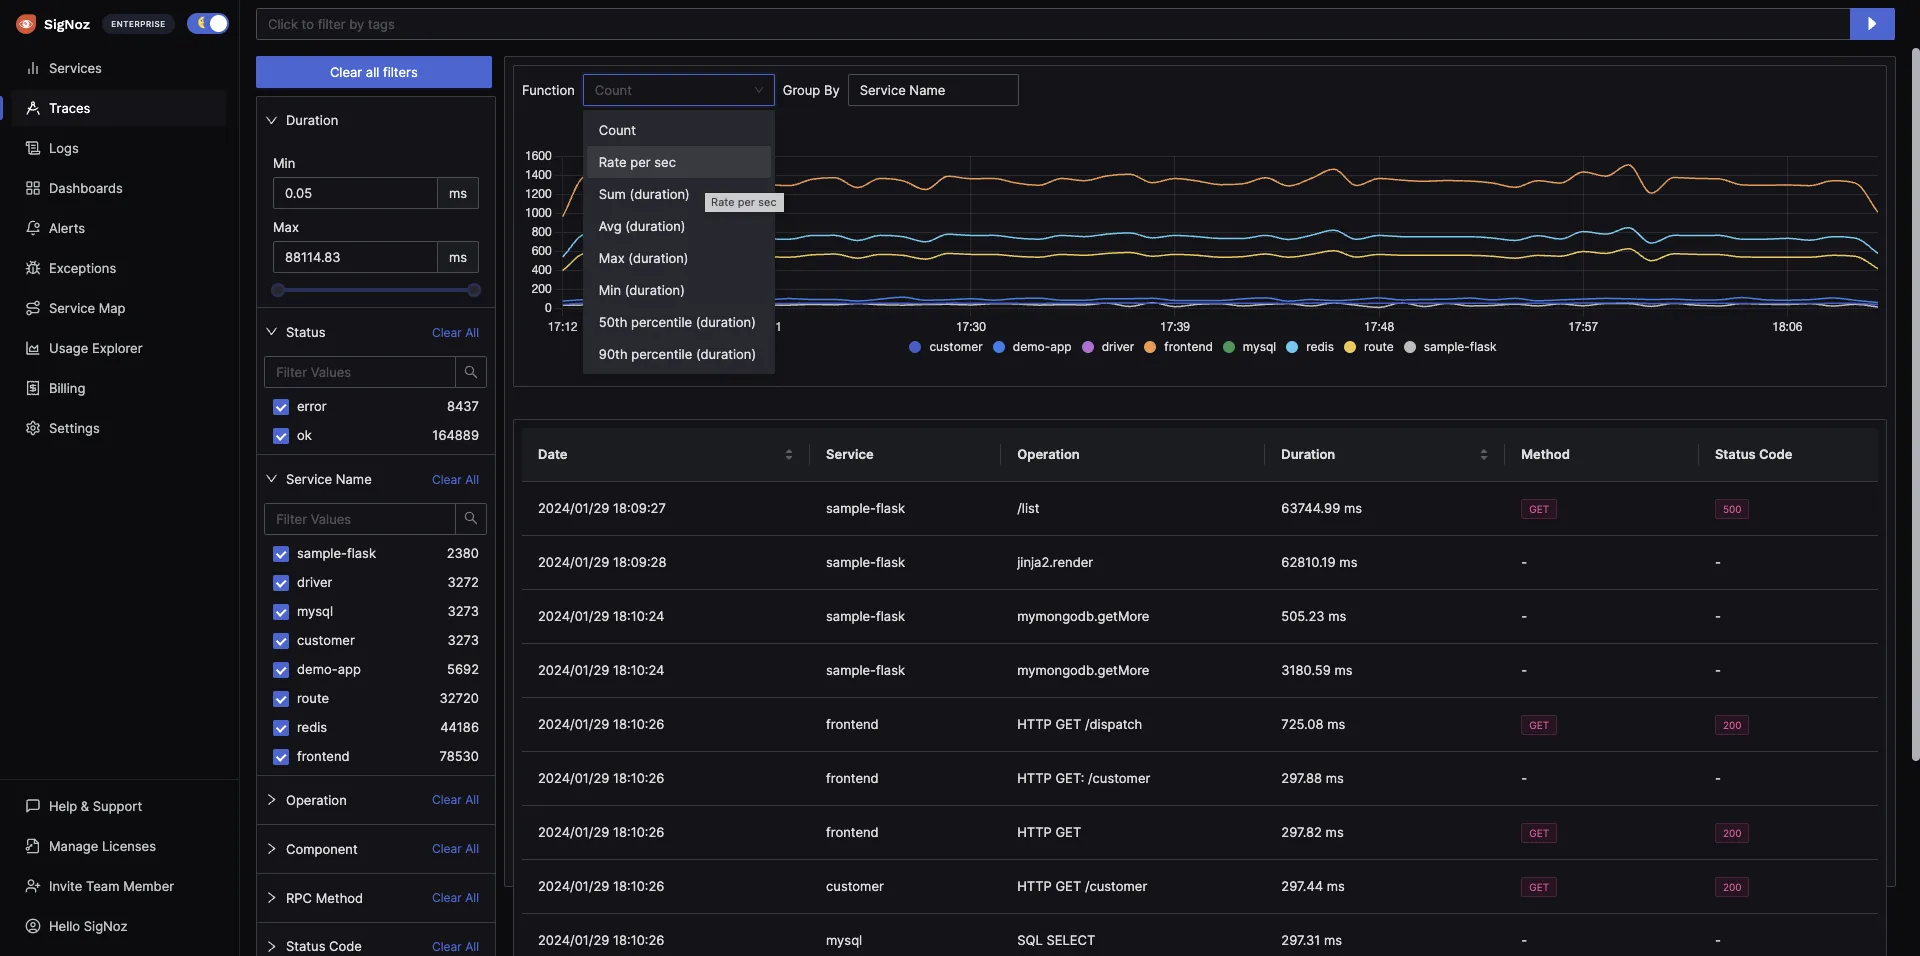
You can analyze tracing data with powerful filters. You can also analyze service level performance with aggregated trace metrics, like the p99 latency of a specific service.
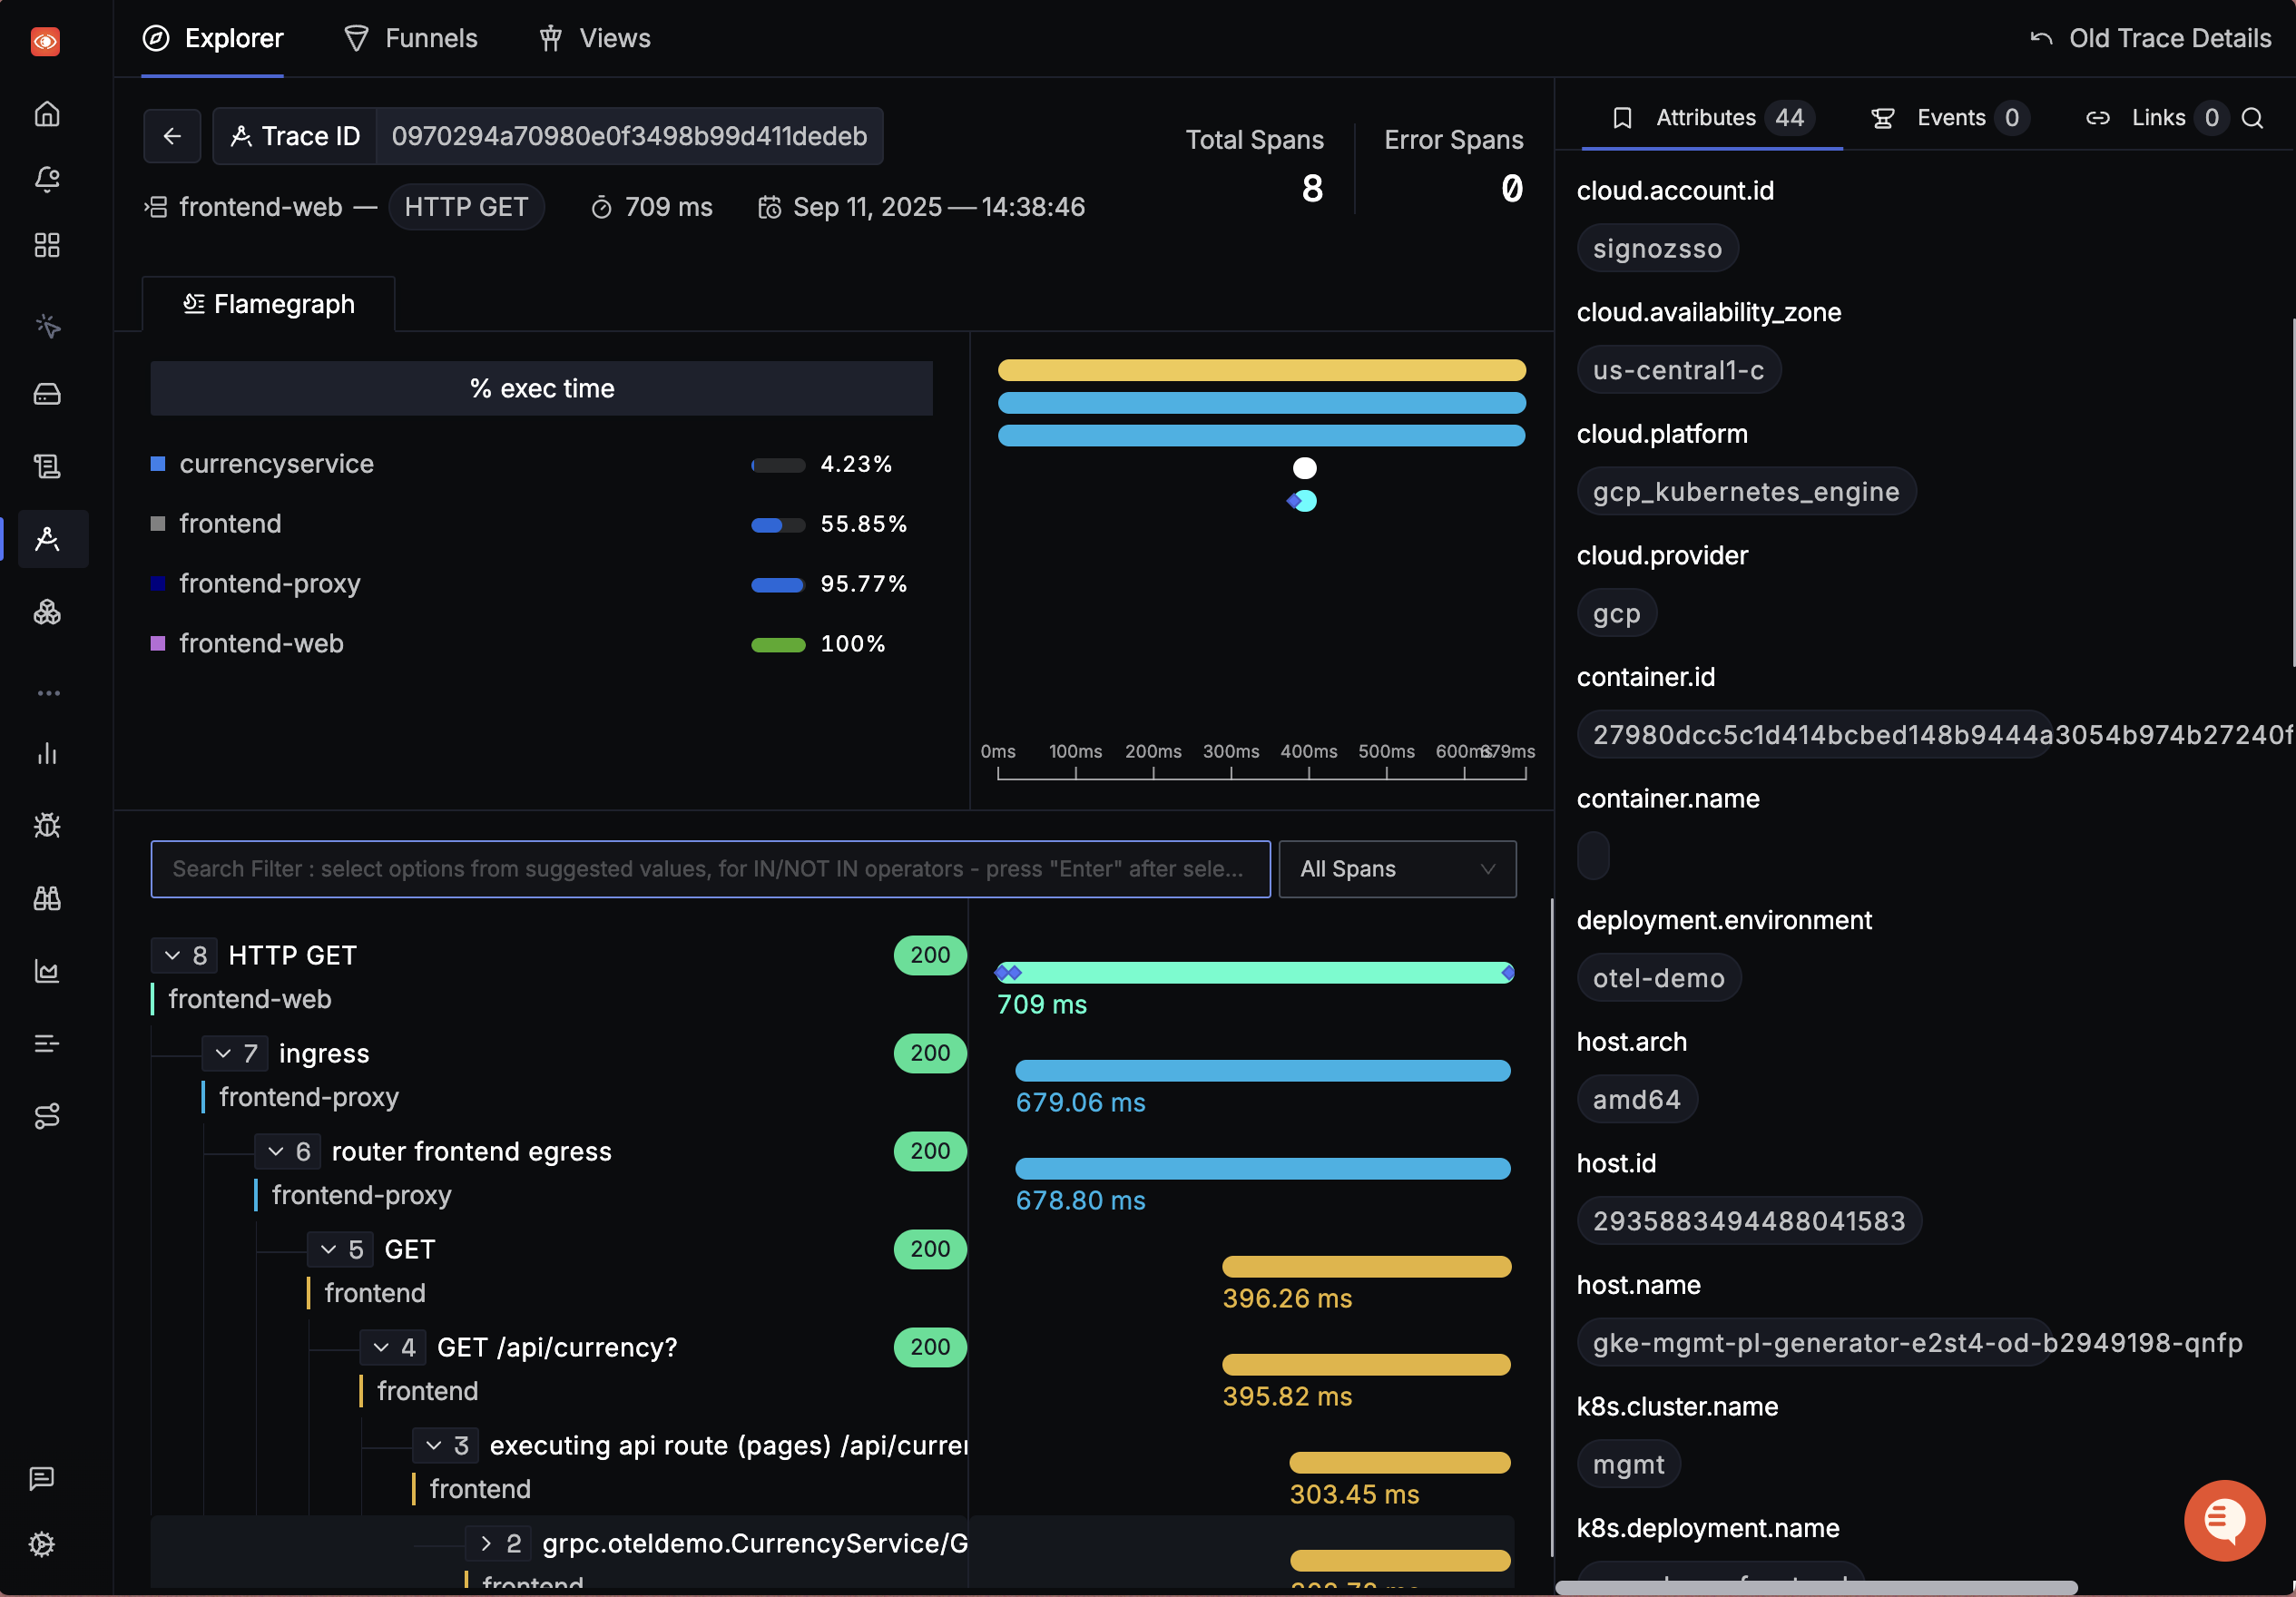
SigNoz also provides a rich visualization of tracing data with the help of Flamegraphs and Gantt charts. You can see exactly how a single event performed as part of an entire user request.
SigNoz Cloud is the easiest way to run SigNoz. Sign up for a free account and get 30 days of unlimited access to all features.

You can also install and self-host SigNoz yourself since it is open-source. With 24,000+ GitHub stars, open-source SigNoz is loved by developers. Find the instructions to self-host SigNoz.
Frequently asked questions
Does Jaeger use OpenTelemetry?
Jaeger had its own SDKs based on OpenTracing APIs for instrumenting applications. But now Jaeger recommends using OpenTelemetry instrumentation and SDKs for instrumentation.
Should I use OpenTracing or OpenTelemetry?
OpenTracing is now archived, and it is suggested to migrate to OpenTelemetry.
Further Reading
OpenTelemetry Collector - architecture and configuration guide
