Bringing out of the box application monitoring to Prometheus
Prometheus is undoubtedly growing as the native monitoring tool for Kubernetes. We have been using Prometheus to collect metrics about our infrastructure for a long, but setting it of the box is still painful
Prometheus is undoubtedly growing as the native monitoring tool for Kubernetes. We have been using Prometheus to collect metrics about our infrastructure for a long time and there are plenty of dashboards available to get the dashboards up fast. For some time, I have been wondering why there aren't out of box application metrics, something like node-exporter for infrastructure metrics.
Let me explain you with an example. Installing kube-state metrics and node-exporter in your instance sends a lot of metrics about that instance to Prometheus. If the metric labels are consistent then you can get the dashboard by using publicly available Grafana dashboards, such as Kubernetes Capacity Planning.
This dashboard includes graphs for CPU usage, memory usage, disk IO, network usage, etc. Everything is ready in a few minutes.
But when we want to monitor our applications, we need to attach exporters to every application, instrument metrics which you want to monitor and build custom dashboards for it.* I was quite surprised to see the exporter metrics so limited in capacity to mostly show just RPS and Latency without proper labeling. *Comparing it to the capabilities that the monitoring tool NewRelic provides, we can see it has to go a long way.
We recently open-sourced our observability platform on Github Check it here
Hence, I built a tool to give a try to extend the APM capabilities of Prometheus. Let me begin by showing some features.
Infra and Application Metrics from multiple clusters
We have 2 Clusters.
- the architecture of application in demo-cluster-1 is shown in image below
- demo-cluster-2 has a simple Django Application with sample endpoints
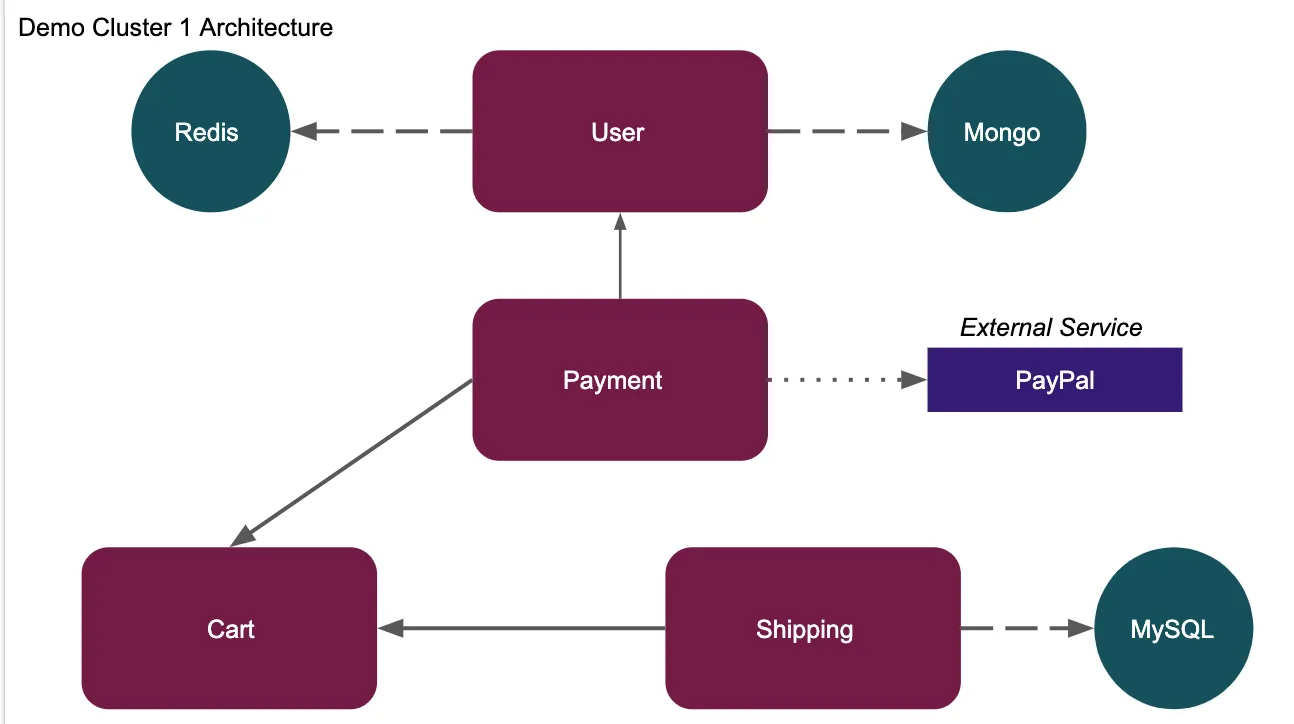 Fig 1. Architecture for Demo Cluster 1
By adding remote-write url with cluster labels you can visualise metrics from multiple Prometheus instances from different clusters. We have a running cortex at our backend that can be used for the following purposes:
- Long term storage of Prometheus metrics
- De-duplicating metrics for HA Prometheus setup
- Single pane of Grafana dashboard for metrics from multiple clusters
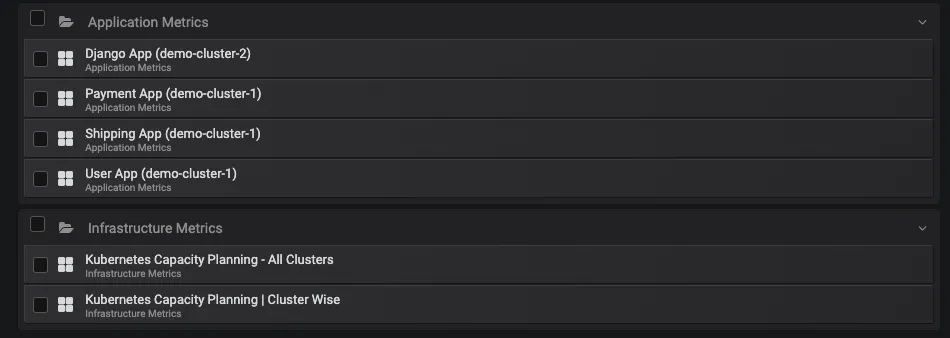 Fig. 2 Grafana Dashboards for application and infra metrics
Application metrics of Payment, Shipping and User micro-services from demo-cluster-1 and Django App from demo-cluster-2 as we can see in Fig.2 above.
Infrastructure metrics from both the clusters containing individual cluster metrics and aggregated metrics of all clusters.
How is your application performing?
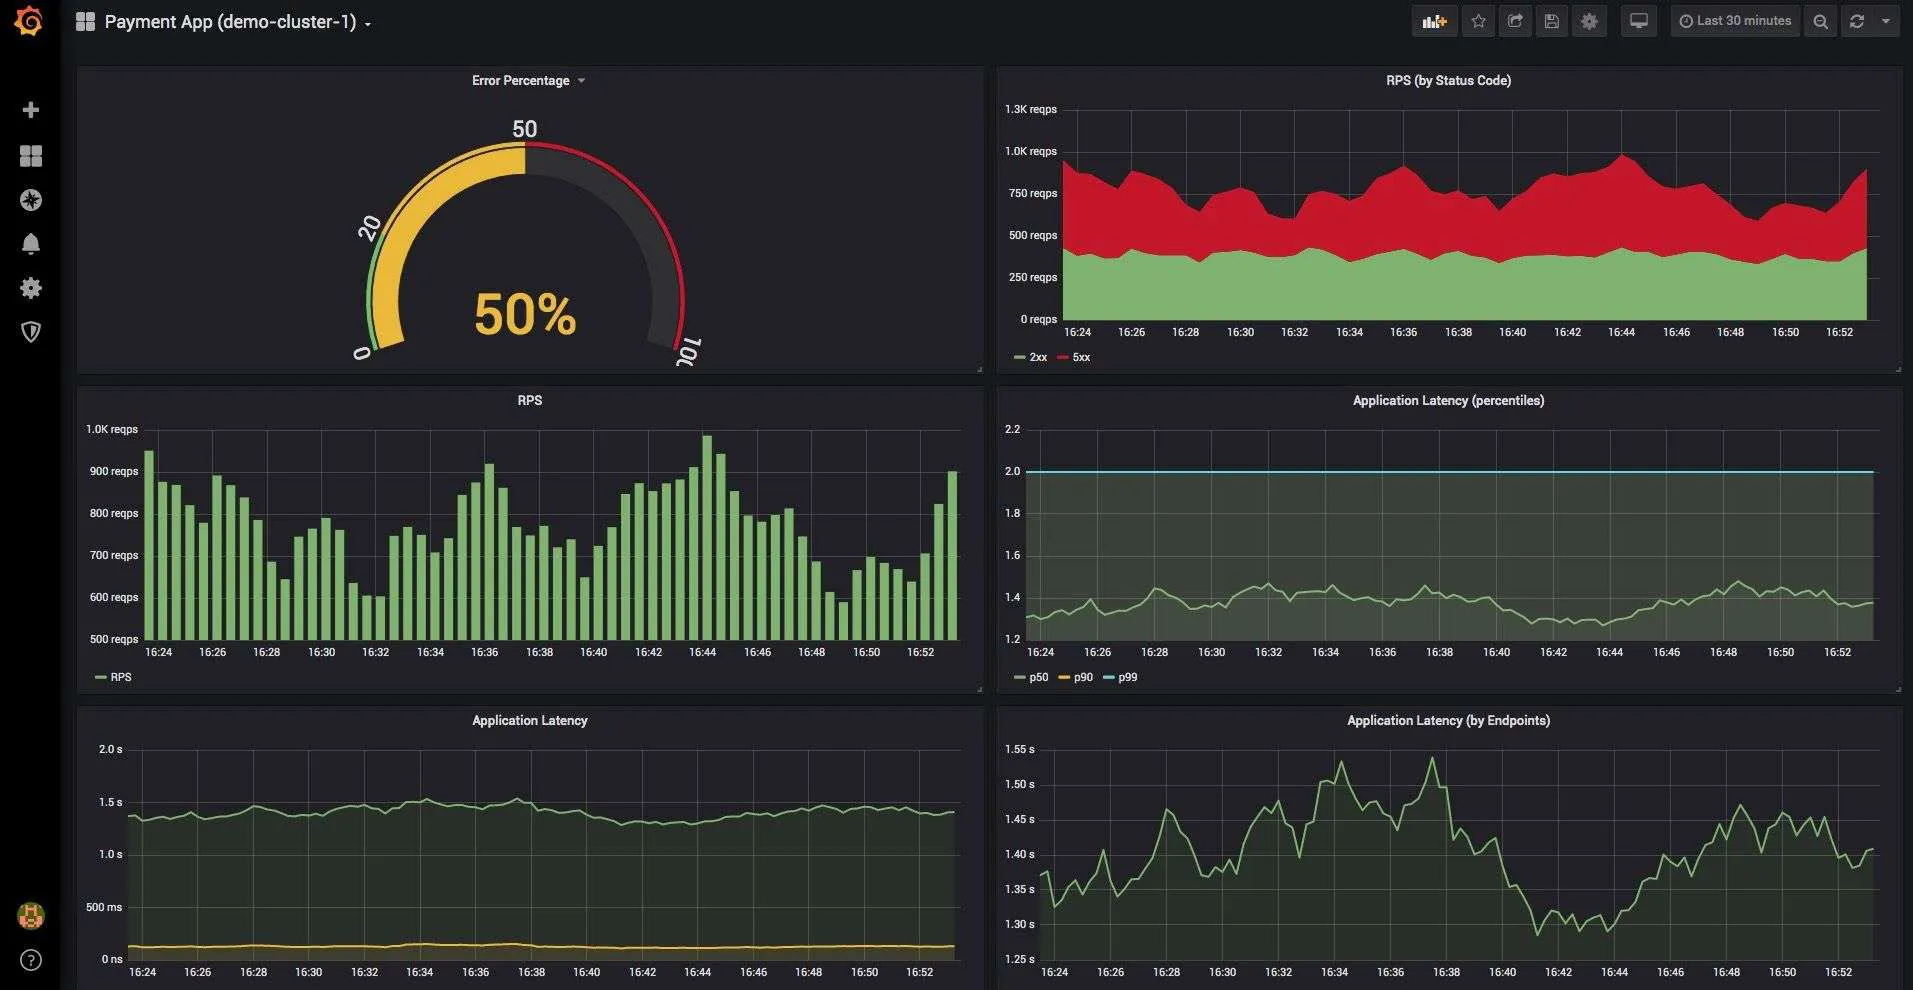
 Fg 3. RPS and latency metrics for application
Some cool features are:
Fg 3. RPS and latency metrics for application
Some cool features are:
- RPS by status codes - when you get 5xx error the graph will turn red
- Percentiles of requests duration - monitor how your 50, 90 and 99 percentiles look and get alerted when there is a sudden increase
- Distribution of complete application time - how much of time is being taken by Redis, Mongo, calls to external services, etc. This may tell you that a sudden increase in latency might be completely due to Redis and thus you should look into commands to Redis to drill down on problems.
- Latency by endpoints - you get to know which endpoints are performing slow and thus look into those specific endpoints
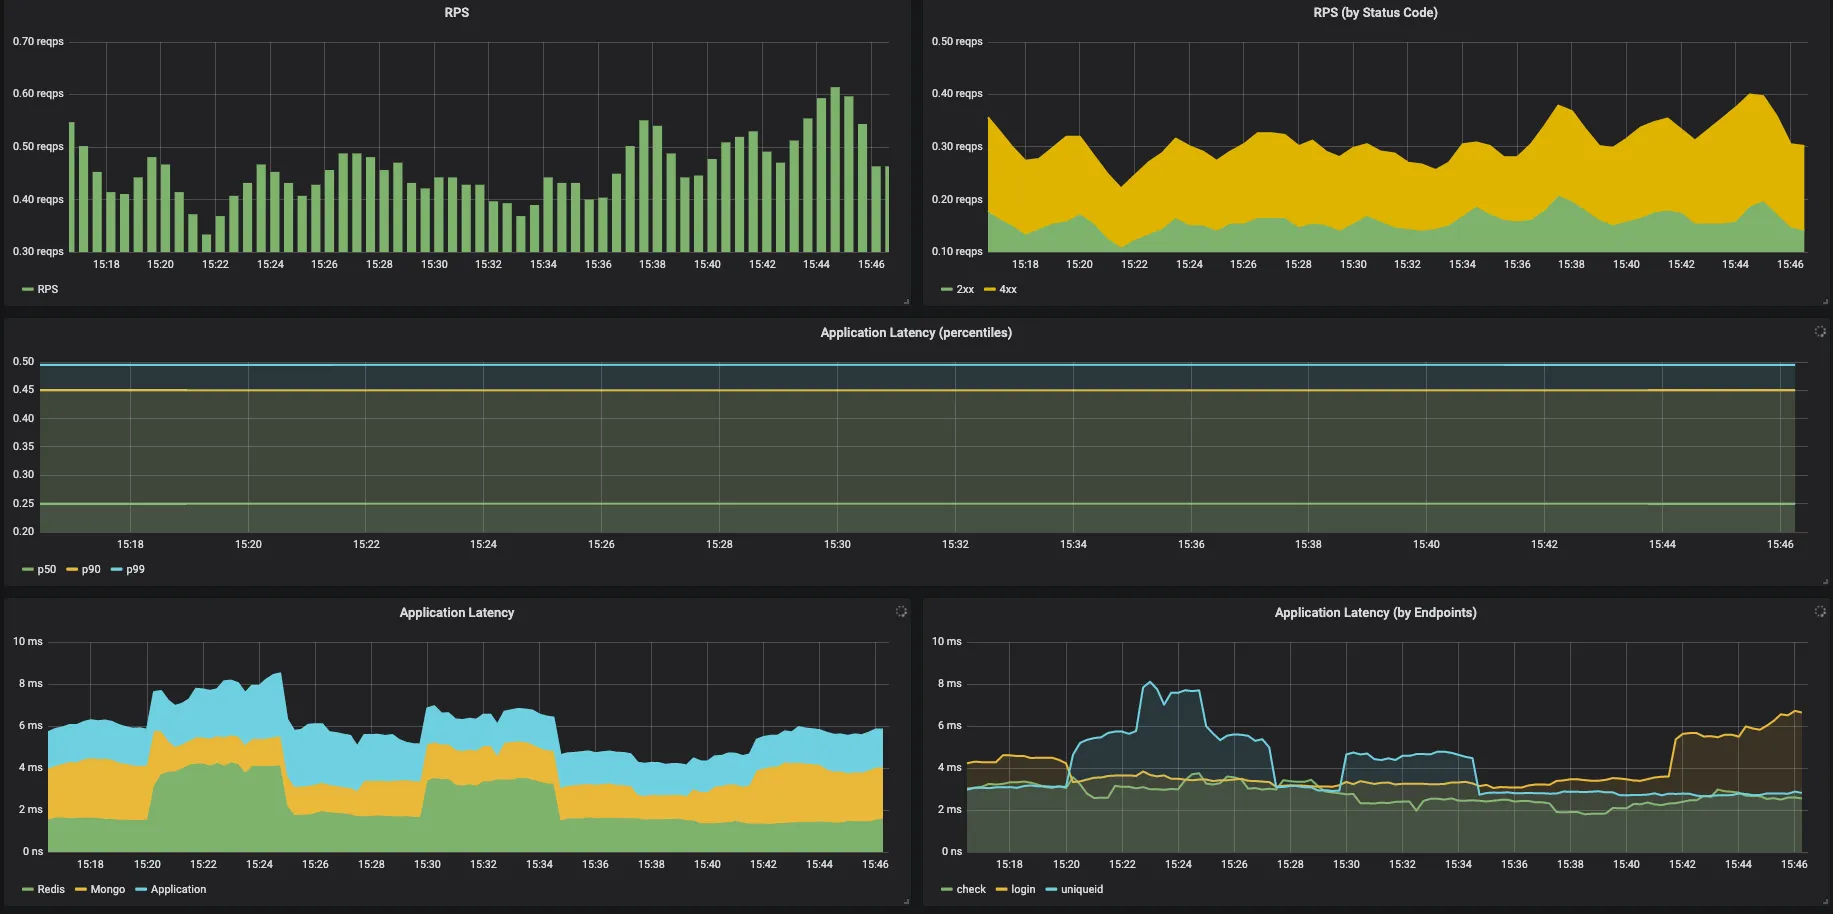
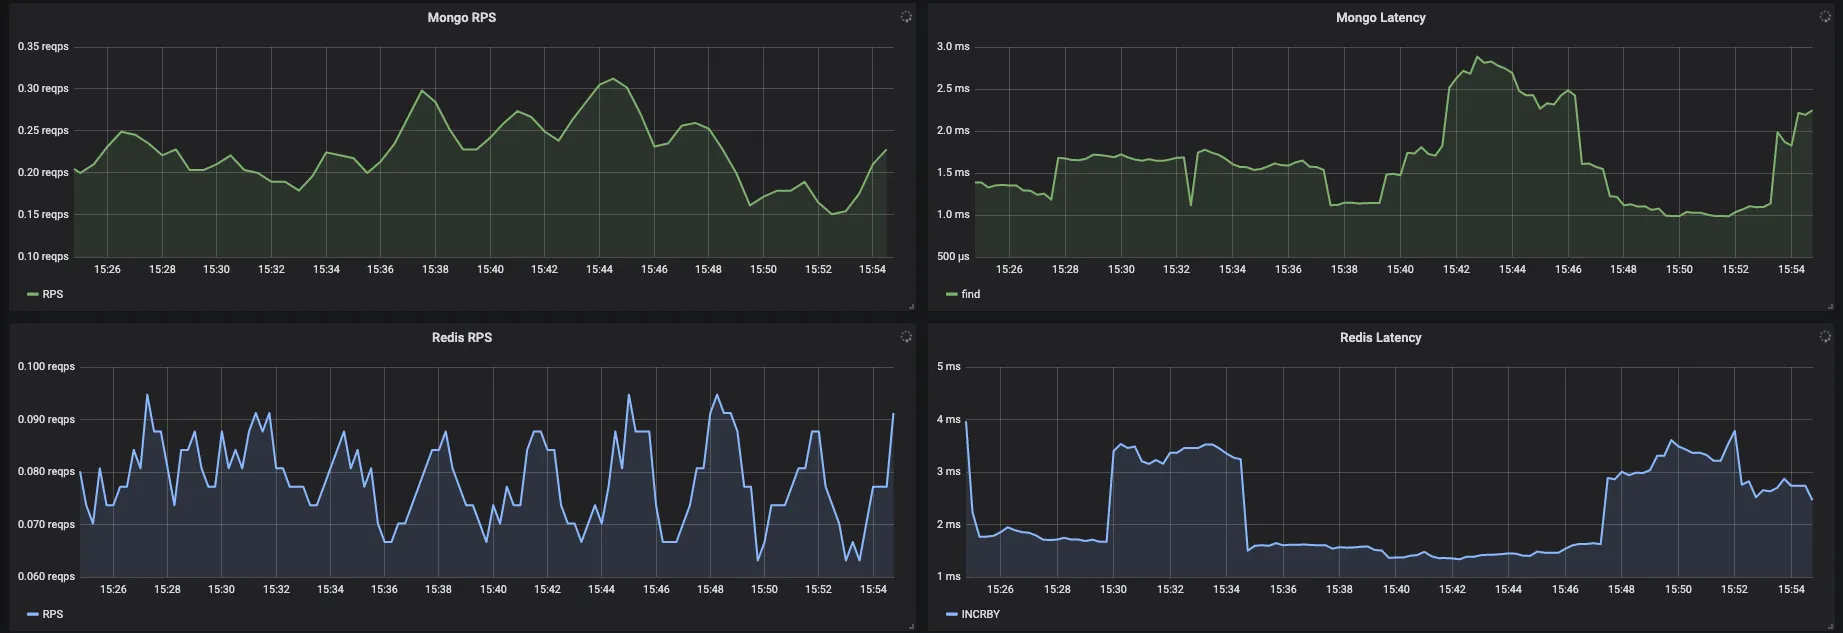 Fig. 4 Mongo & Redis - RPS and Latencies
- Mongo/Redis specific metrics - how many calls do the application make to mongo and Redis and how does the time taken by them look
- See which type of commands/queries are taking more time
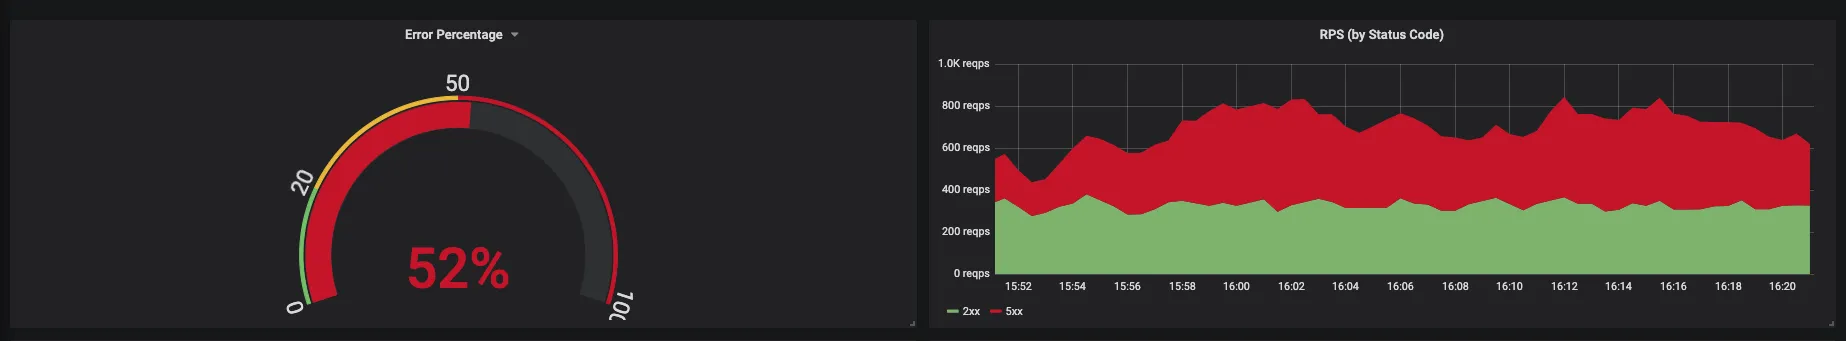 Fig. 5 Error report from application
- Error percentage and RPS by status codes
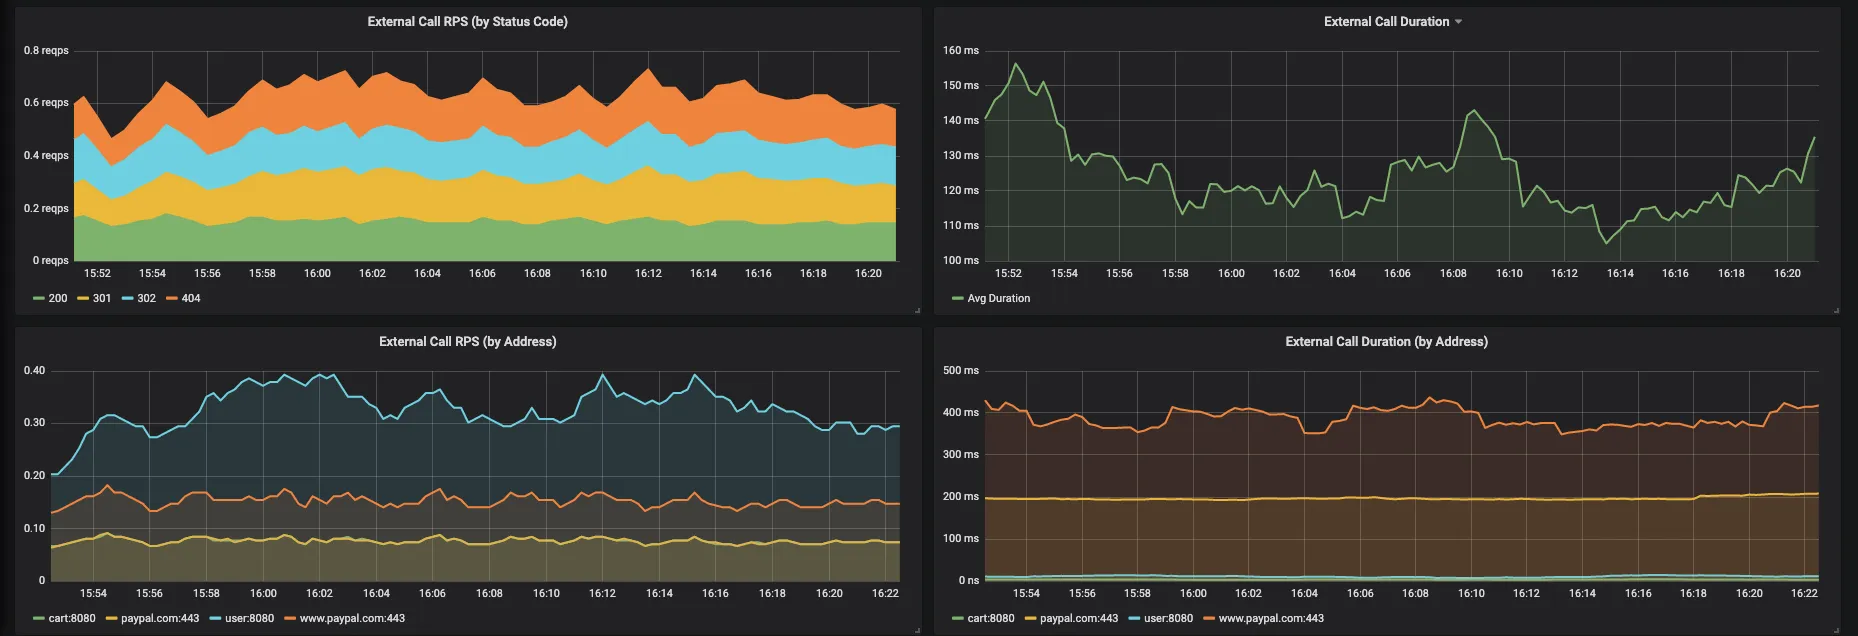 fig. 6 Metrics about external services
The payment service calls user and cart services apart from paypal.com. We can analyse:
- RPS of external calls by status code - now we can monitor how the calls to other micro-services are impacting this application
- Avg time taken by each of those external addresses. As we can see from the graph that calls to Paypal takes much larger time than the call to other services
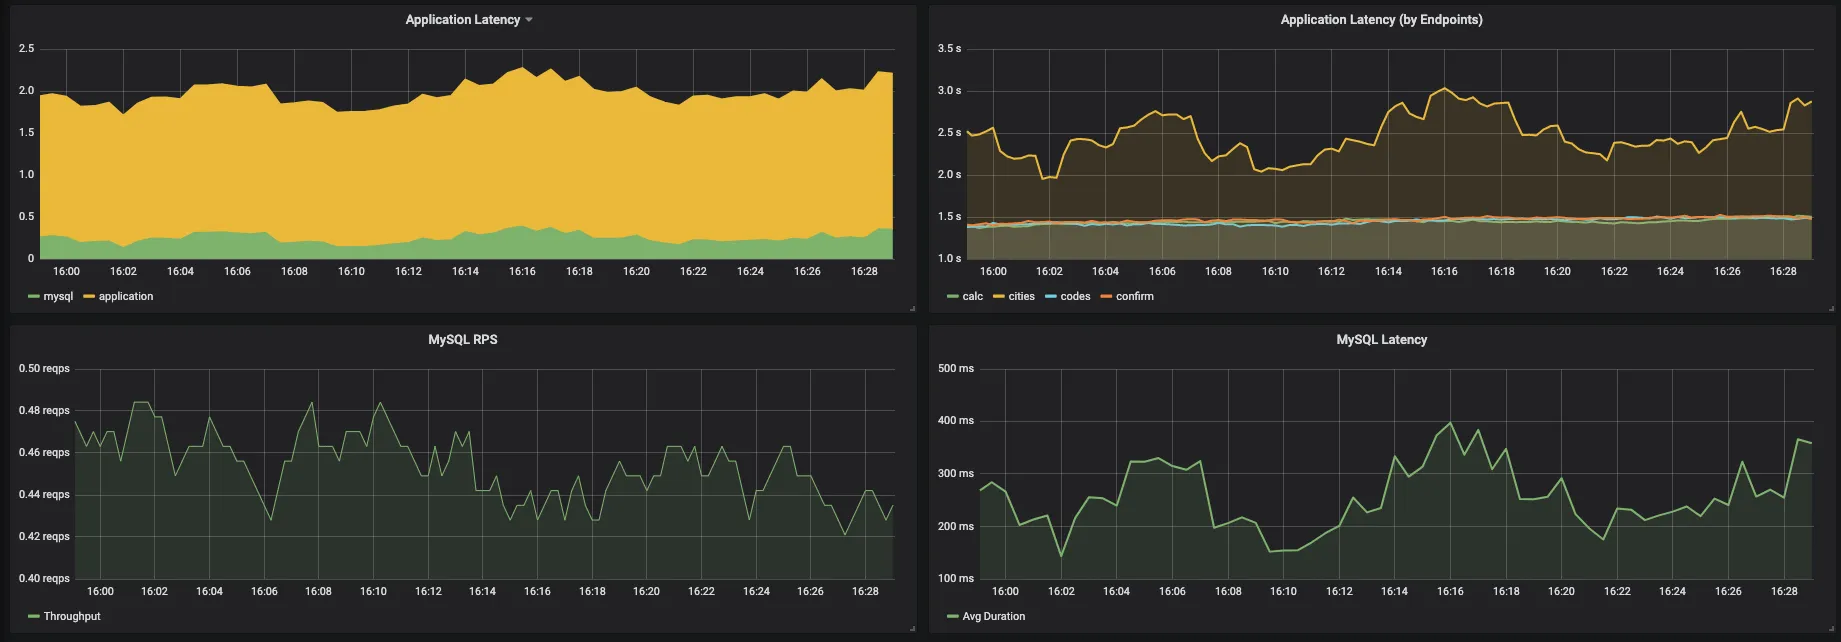 Fig. 7 Mysql performance on application queries
- In Shipping App, mysql is not the bottleneck in response time. Application is taking ~1.8s whereas mysql is taking ~0.3s to respond. Thus there is scope to improve your application logic to get better response time.
- Also, /cities API is taking ~2.5s whereas other apis like /calc, /confirm, /codes are taking ~1.5s to respond
Is it the same as using Redis/Mysql/Mongo exporter?
No, the exporters give metrics about Mysql/Redis/Mongo irrespective of the application. They give overall metrics and performance. What we are trying to achieve is from the application perspective. How are the Mysql/Redis/Mongo queries performing for that application? Maybe the queries from the application have high latency but the overall latency of Mysql/Redis/Mongo is well within the alert region.
Infrastructure Metrics
Demonstrating Kubernetes Capacity Planning dashboard
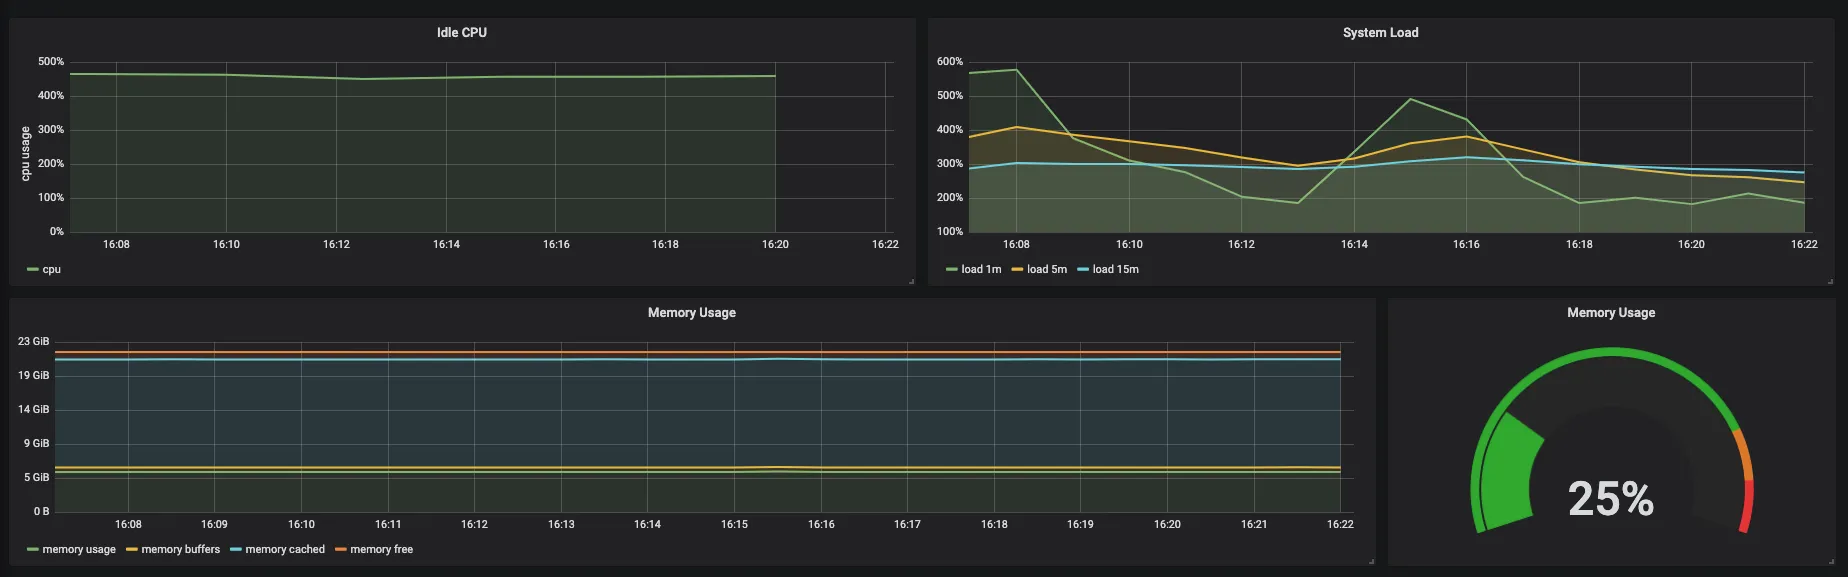 Fig. 8 CPU and memory usage
- In total there are 6 CPUs out of which 4.5 is idle on avg
- 1m, 5m, and 15m system load. More about load can be read here
- Memory usage patterns of all clusters aggregated by free, buffered and cached
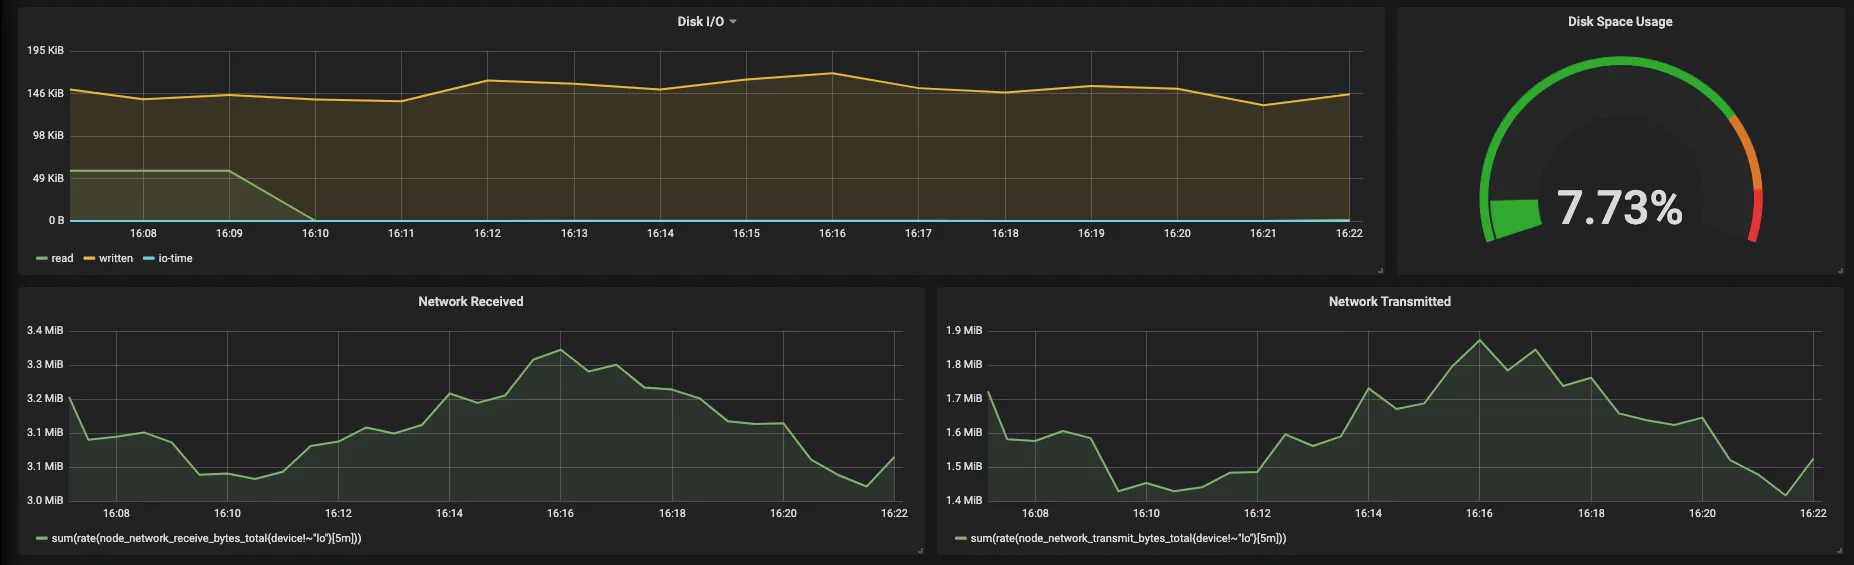 Fig. 9 DiskIO and Network usage
- Disk IO in terms of read, write and io
- Network usage of all clusters aggregated by received and transmitted bytes
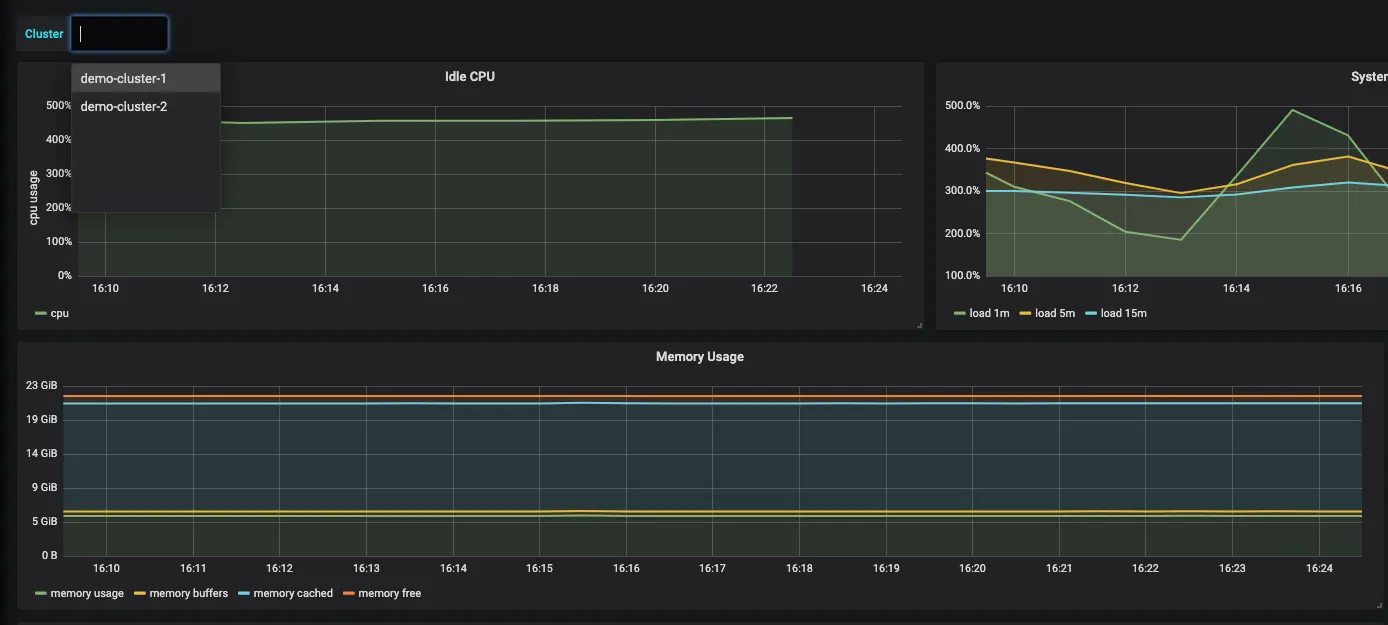 Fig. 10 Cluster-Wise infrastructure metrics
We can also monitor cluster-wise metrics by choosing the cluster name from the dropdown.
Fig. 10 Cluster-Wise infrastructure metrics
We can also monitor cluster-wise metrics by choosing the cluster name from the dropdown.
Popular USE (usage and saturation) metrics is coming up soon
What does it take to get those metrics and build those dashboards?
We build on top of Prometheus. All these features are pluggable to already running Prometheus instances also.
For completely new setups
- Install signoz agent
helm install stable/signoz-agent --name=signoz-agent --set cluster.name=demo-cluster-1 --set agent.licence=xxxxxxxxx
- Install Prometheus
helm install stable/promethues --name=prom-demo
We need to set a few flags like setting external_labels cluster and replica, remote_write details:
    --set server.global.external_labels.cluster=demo-cluster-1 \
    --set server.global.external_labels.replica=two
    --set serverFiles."prometheus\.yml".remote_write[0].url=xxxxx
    --set serverFiles."prometheus\.yml".remote_write[0].basic_auth.username=x
    --set serverFiles."prometheus\.yml".remote_write[0].basic_auth.password=x
- Remote Write url will send your samples to Cortex for long term storage
- Setting flag cluster will let you aggregate metrics across clusters
- Setting flag replica will enable HA Prometheus setup and will deduplicate metrics from multiple Prometheus instances from the same cluster
- Add signoz python package in your requirements.txt and re-build your docker image. This sensor will get your application metrics and send them to signoz-agent which shall let Prometheus scrape them
We have separate packages for different languages and thus enabling a wide variety of technologies in Python, NodeJs, Java, etc
- Setup a few environment variables in your* deployment.yaml*
            env:
              - name: NODE_IP
                valueFrom:
                  fieldRef:
                    fieldPath: status.hostIP
              - name: AUTOWRAPT_BOOTSTRAP
              	value: signoz
              - name: APP_NAME
              	value: payment
- NODE_IP for the sensor to communicate with the agent
- AUTOWRAPT_BOOTSTRAP to enable sensor
- APP_NAME to give a name to your application. This name will be visible in your Grafana dashboard
For those using Prometheus already
Skip Prometheus installation and rather only change the configuration to add remote_write urls and authentication
For those who only want managed Prometheus long term storage
Skip all steps and change your Prometheus config to include remote_write urls and authentication
What are the advantages over simple Prometheus?
- Managed long term storage
- Multi cluster view on a single pane of window
- Enabling HA Prometheus setup by running multiple prom instances
- Out of box application metrics
- Zero Instrumentation
- Pre-built Grafana dashboards on Infrastructure and Application metrics
Achieving all the above in-house is work of 4-5 weeks at least
How can I try out the product?
The product is currently available in private beta
Reach out to us on Signoz Website or DM me. For any Prometheus related queries, I am reachable at:
If you want to dig deeper, it is worth reading how OpenTelemetry compares to Prometheus, which Prometheus alternatives exist, and how these approaches stack up against dedicated APM tools.
On a mission to make monitoring essential and affordable to every business
