Decoding PostgreSQL Monitoring | 101 Guide
Monitoring PostgreSQL for performance issues is critical. PostgreSQL is a powerful open-source relational database system that stands out for its robustness, scalability, and strong emphasis on extensibility and standards compliance. In this guide on PostgreSQL monitoring, we will cover key PostgreSQL metrics that should be monitored, best practices for monitoring PostgreSQL and some tools with which you can set up PostgreSQL monitoring.

What is PostgreSQL?
PostgreSQL is an open-source relational database management system. The PostgreSQL project was started in 1986 at the University of California. It was originally named Postgres and was finally renamed to PostgreSQL in 1996 to highlight its support for SQL querying language.
PostgreSQL is widely adopted due to its ability to store and scale complicated data workloads. it is technically an object-relational database allowing the creation of custom data types and supporting advanced features like inheritance and polymorphism.
It supports fully ACID-compliant transactions and implements a unique feature called Multiversion Concurrency Control. This allows multiple transactions to run simultaneously without causing traffic jams or requiring locks.
It also offers a variety of extensions like PostGIS for geospatial data (used in applications like Uber), Citus for data sharding and distribution, and PG embedding for AI applications.
Monitoring the PostgreSQL database is important to ensure that the database is able to do its work effectively.
Key Metrics for PostgreSQL Monitoring
Monitoring PostgreSQL allows you to track query performance, resource utilization, uptime and availability, etc. Let’s have a look at important metrics that should be monitored for PostgreSQL.
Query Throughput and Latency Metrics
It doesn’t matter what type of machine or database you use if your queries are taking a longer time to execute than they should. So, always keep track of the latency of queries if it’s going up exponentially with the size of your tables or database.
Consider the analogy of a library: each query is a request for information. To understand the pace of this interaction, let's calculate the average latency using the following SQL query:
SELECT query, mean_exec_time
FROM pg_stat_statements
ORDER BY mean_exec_time DESC
LIMIT 5
This query fetches the top 5 queries based on their mean execution time, providing insights into potential bottlenecks. You can also see the other metrics from the pg_stat_statements table, like the number of calls or min and max execution times according to your requirements.
Analyzing this data helps identify which queries might be causing performance issues, allowing for targeted optimization efforts.
Disk Utilization and I/O Operations
PostgreSQL is responsible for managing how data is stored on disk and how it's retrieved when needed. This process is not usually visible to the end user but is crucial for the database's performance.
Disk utilization and I/O operations are key aspects of PostgreSQL's performance. Disk utilization refers to how much disk space the database is using. I/O operations involve reading from or writing to disk storage. Both are important because they can significantly affect the speed and efficiency of the database. High disk utilization or inefficient I/O operations can slow down the database.
You can use the below query to regularly monitor how much disk space is being used by different objects in the PostgreSQL database:
SELECT object_type, object_name, schema_name, size FROM
(SELECT
    'Table' AS object_type,
    relname AS object_name,
    schemaname AS schema_name,
    pg_total_relation_size(relid) as size_bytes,
    pg_size_pretty(pg_total_relation_size(relid)) AS size
FROM
    pg_catalog.pg_statio_user_tables
UNION
SELECT
    'Index' AS object_type,
    indexrelname AS object_name,
    schemaname AS schema_name,
    pg_total_relation_size(indexrelid) as size_bytes,
    pg_size_pretty(pg_total_relation_size(indexrelid)) AS size
FROM
    pg_catalog.pg_stat_all_indexes
) as data
ORDER BY
    size_bytes DESC
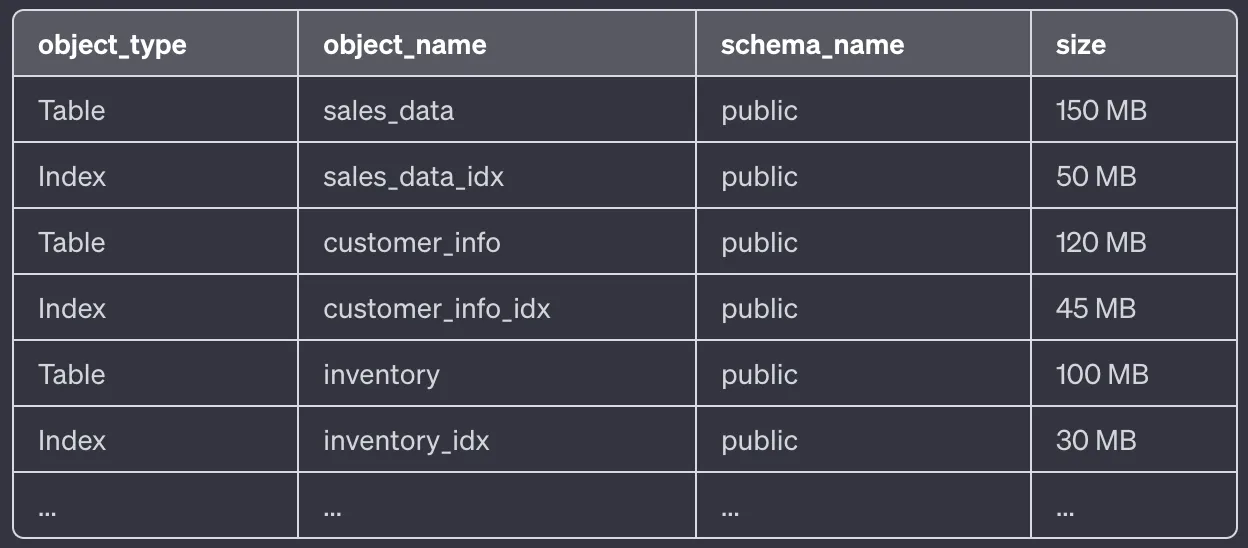
The query calculates the size of each table and index, both in bytes (size_bytes) and in a human-readable format (size), using a function called pg_size_pretty.
The following things are happening in the query:
- The first part of the query selects all user tables (
pg_statio_user_tables) in the database, getting their name, schema, and size. - The second part does the same for all indexes (
pg_stat_all_indexes). - These results are then combined and ordered by the size in bytes (
size_bytes), with the largest objects appearing first.
Below is a sample output that you can get with the above query.
If you're using PostgreSQL and want to check if you have any extra indexes that might be affecting your database's performance, you can use a simple query. This will show you a list of all the indexes in your database:
SELECT * FROM pg_catalog.pg_stat_all_indexes
You will get an output like below:

The idx_scan column tells you how many times each index has been used. If the number is high, the index is probably helping your queries run faster. But if it's low or zero, the index might not be very useful and could even be slowing down your database. By identifying such indexes, you can decide whether to keep them or remove them to improve your database's efficiency.
Connection Health and Pooling
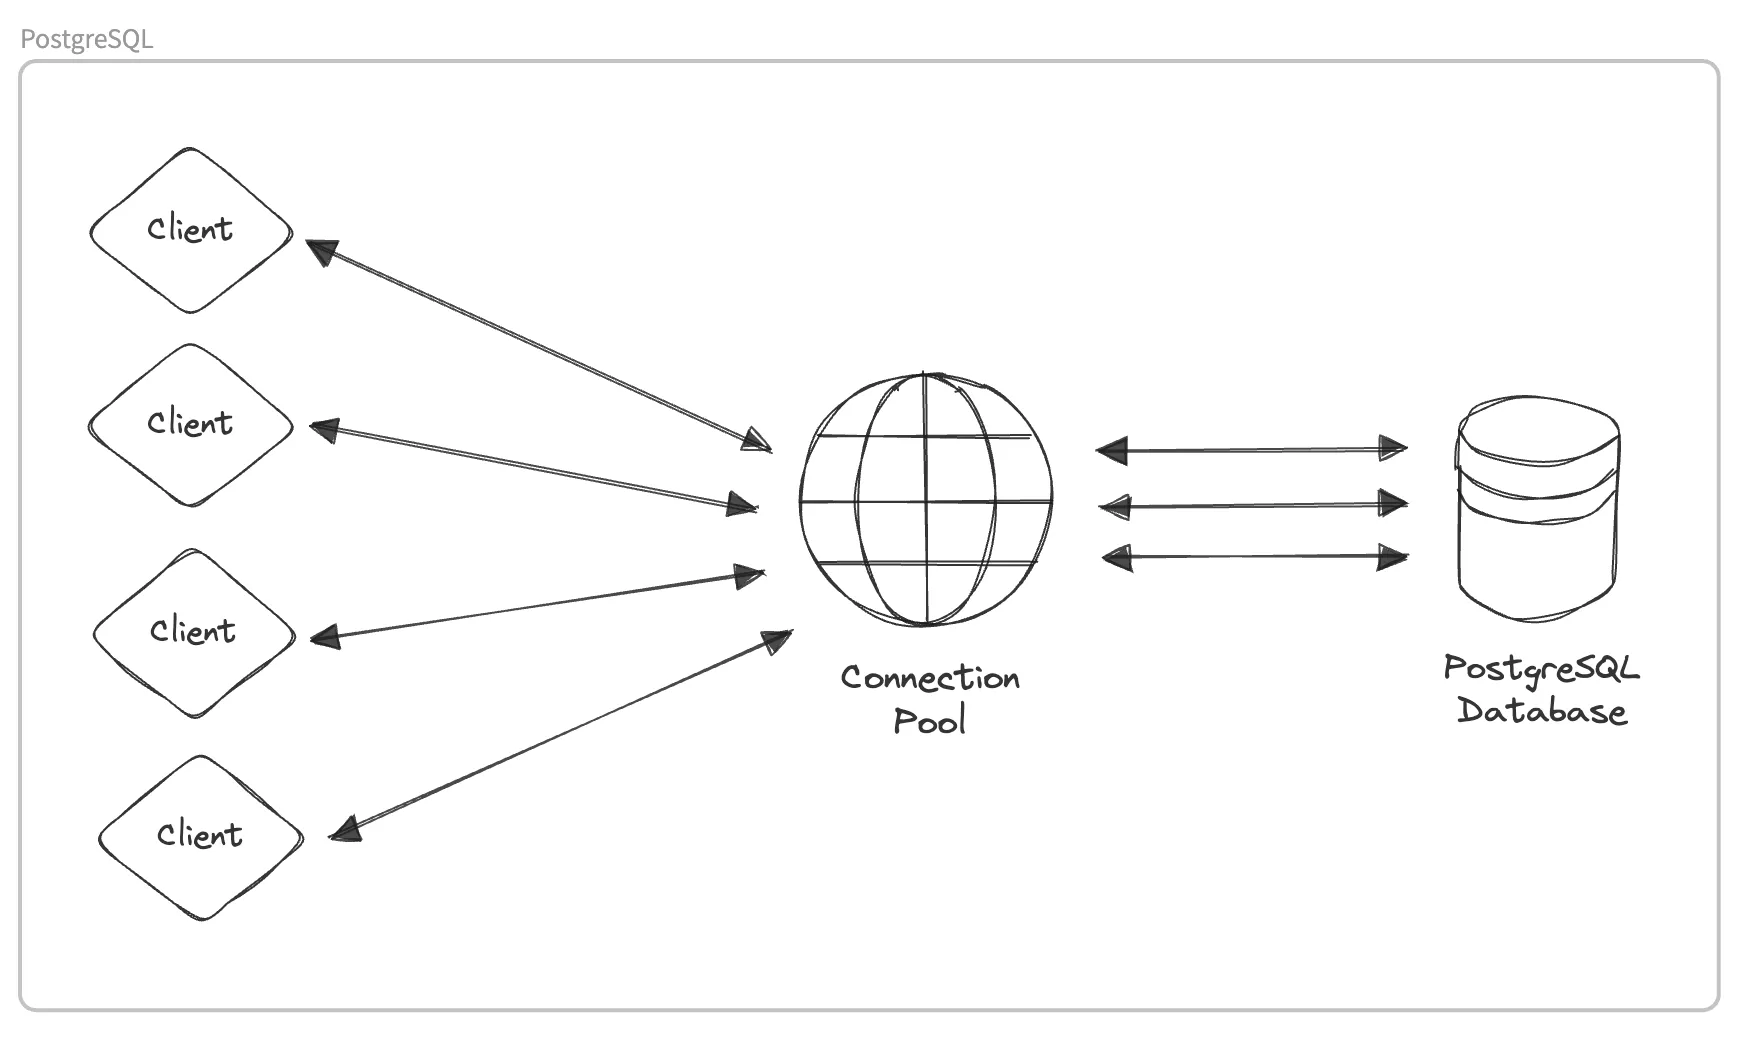
Connection health and pooling are critical components of a well-optimized PostgreSQL environment. Picture a busy cocktail party. Healthy connections are like smooth conversations. Let's visualize this concept:
You can implement connection pooling directly in your application code. In the case of a monolithic application, you can create a common connection pool that can be used across the entire application.
You can effectively manage connection pooling without integrating it into your application code by using third-party tools like PgBouncer. PgBouncer is a PostgreSQL connection pooler. You can configure PgBouncer to balance connection loads and boost your PostgreSQL database performance.
Any target application can be connected to it as if it were a PostgreSQL server, and Pgbouncer will create a connection to the actual server, or it will reuse one of its existing connections.
You can leverage PgBouncer admin console to monitor a number of important metrics. Once connected, you can use the SHOW STATS command to provide various metrics that help monitor and understand the performance and behavior of the connection pool.
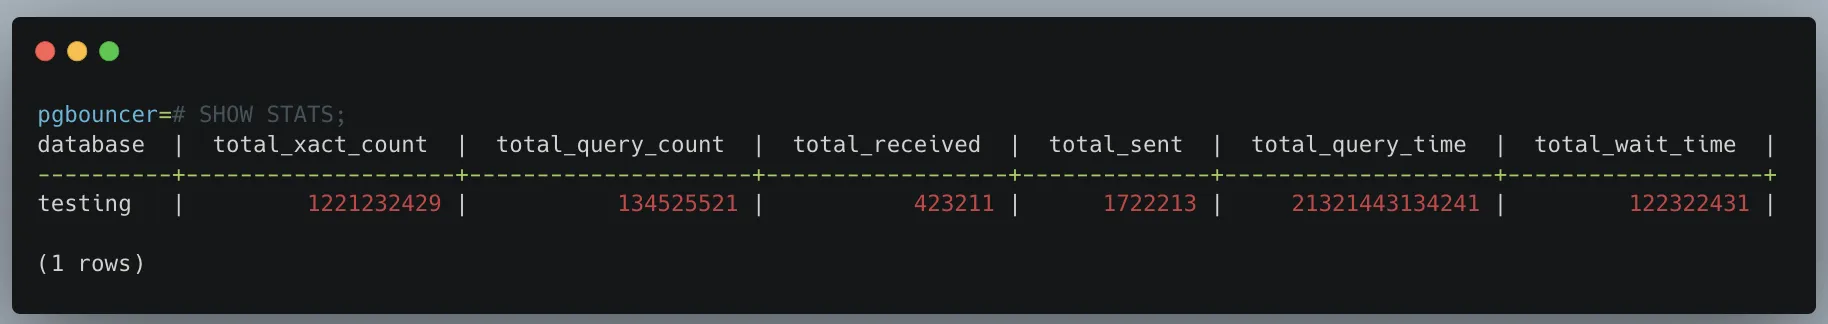
Some of the key PostgreSQL metrics that you can access with the SHOW STATS command are as follows:
- Total Requests (total_xact_count): The total number of SQL transactions (or sessions) that have been processed.
- Total Queries (total_query_count): The total number of SQL queries that have been executed.
- Received Data (total_received): The total amount of data received from clients, usually measured in bytes.
- Sent Data (total_sent): The total amount of data sent to clients, also typically measured in bytes.
- Total Query Time (total_query_time): The total time spent on executing queries. This is often in microseconds and gives an idea of the database load and the efficiency of the queries.
- Average Transaction Duration (avg_xact_time): The average duration of a transaction. This helps in understanding the performance of the database in handling transactions.
- Average Query Duration (avg_query): Similar to the average transaction duration, this metric shows the average time taken to execute a query.
- Total Transactions (total_xact_count): The total number of transactions processed.
- Total Queries (total_query_count): The total number of queries executed.
- Active Server Connections (active_server_conns): The number of active connections to the PostgreSQL server.
- Maximum Server Connections (max_server_conns): The maximum number of connections to the PostgreSQL server.
In this and related commands for PgBouncer, the total figures are since process start. The averages are updated every stats_period you have configured in config.
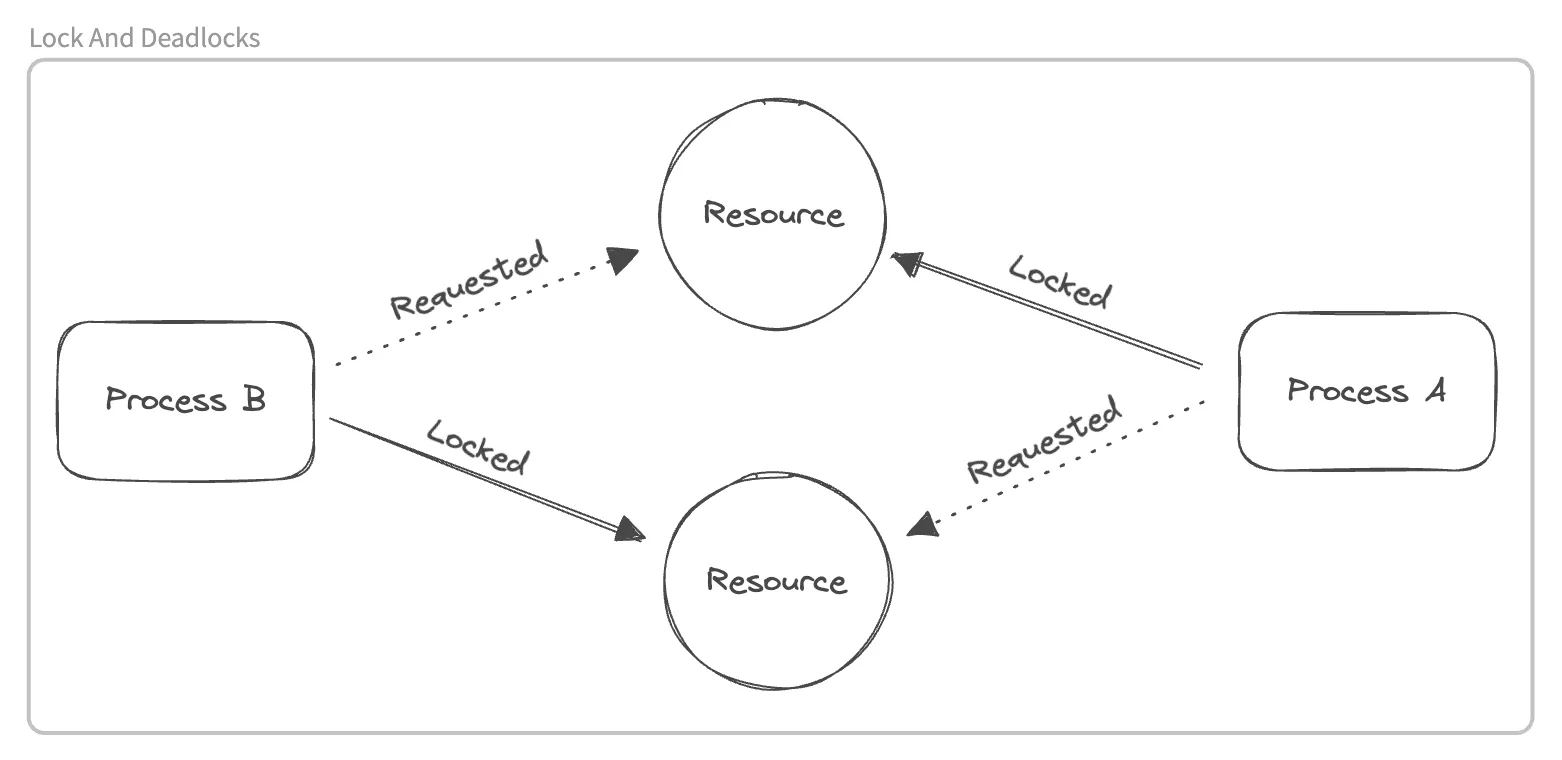
Understanding Locks and Deadlocks
In PostgreSQL, locks and deadlocks play a critical role in maintaining data integrity. A lock is a mechanism that prevents multiple transactions from accessing the same resource concurrently to avoid conflicts and ensure consistency. A deadlock occurs when two or more transactions are blocked, each waiting for the other to release a lock, resulting in a standstill. Visualize this scenario:
To monitor your PostgreSQL for locks and deadlocks, you can use in-built as well as third-party tools.
pg_locks: This is a PostgreSQL system view that provides information about all the current locks in the database. It shows details like the type of lock, the process ID (PID) of the process holding the lock, and what specific database resource is being locked (like a table, row, etc.).pg_stat_activity: This view complementspg_locksby providing additional context about each process, such as which database it's connected to. Joiningpg_lockswithpg_stat_activityusing the PID allows you to see not just the locks but also which database and queries are involved.
The provided SQL query joins pg_locks with pg_stat_activity to show a comprehensive view of the current locks:
SELECT
    pg_locks.pid,
    pg_stat_activity.datname,
    pg_locks.mode,
    pg_locks.relation,
    pg_locks.page,
    pg_locks.tuple
FROM
    pg_locks
JOIN
    pg_stat_activity ON pg_locks.pid = pg_stat_activity.pid
Here's what a sample output might look like:
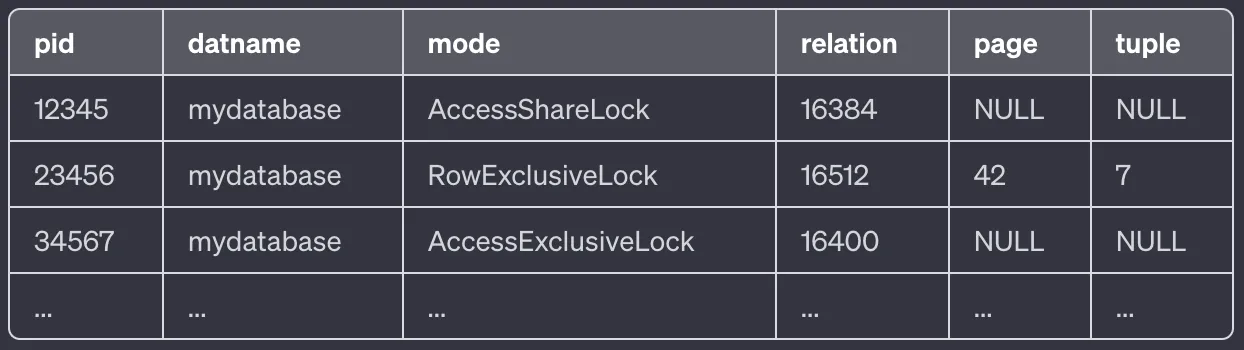
Monitoring for locks and deadlocks involves regularly running queries against pg_locks and pg_stat_activity to identify any potential issues. By keeping an eye on these views, you can proactively address locking scenarios and take corrective actions to ensure smooth database operation.
These queries can be scheduled as part of regular monitoring tasks to promptly detect and resolve any lock-related issues in your PostgreSQL database.
You can use manual tools as well, like PGAdmin, to administrate what’s going on, but in production, manual tools might not work. You can monitor with tools like SigNoz, which can help you visualize and monitor your PostgreSQL metrics. You can also set alerts on important metrics.
Now that you have some idea of key PostgreSQL metrics that you need to monitor, let’s go through some best practices of PostgreSQL monitoring.
Best Practices of PostgreSQL Monitoring
Establishing Baselines of PostgreSQL Performance
Establishing performance baselines is essential to understand the normal behavior of your PostgreSQL database under typical operational conditions.
This process involves:
- Identifying Key Performance Metrics: Focus on important metrics like query execution times, transaction rates, and resource utilization (CPU, memory, disk I/O). These metrics provide insights into the database's performance during regular operations.
- Collecting and Analyzing Historical Data: It's important to collect data over a significant period to establish an accurate baseline. This historical analysis helps you recognize normal operational patterns and natural fluctuations. To collect historical data, you need a tool like SigNoz for storing data over time and accessing it through charts and dashboards.
- Using
pg_stat_statementsandpg_stat_activity: These tools are crucial for capturing detailed performance metrics. They aid in understanding typical workload patterns and spotting any deviations from the norm. - Documenting Baseline Values: Keep a detailed record of baseline values for critical metrics. This documentation acts as a reference point for identifying deviations and abnormal behavior. Ensure that this documentation is updated regularly to reflect any changes in the database environment or workload.
Defining Thresholds For PostgreSQL Monitoring
Defining precise performance thresholds is crucial for the timely identification of abnormal conditions and potential issues in PostgreSQL monitoring. This involves:
- Determining Critical Metrics: Identify essential metrics such as CPU usage, memory consumption, and disk I/O that reflect the normal operational state of your database. Understanding these metrics is key to setting meaningful thresholds.
- Setting Threshold Values Based on Baselines: Establish threshold values for each critical metric by referring to the established performance baselines. These thresholds represent the acceptable ranges of performance beyond which action may be needed.
- Incorporating Dynamic Thresholds: Consider implementing dynamic thresholds that can adjust according to varying conditions such as time of day, expected workload fluctuations, or specific operational events. This approach allows thresholds to be more contextually relevant and reduces false alarms.
- Regular Reviews and Updates: Periodically review and adjust these threshold values to align with changes in database workloads, system upgrades, or evolving business requirements. This ensures that the monitoring system remains effective and responsive to the current state of the database.
- Integrating with Alerting Mechanisms: Link these thresholds with your alerting systems to notify the relevant teams when thresholds are breached. This enables prompt investigation and intervention, minimizing potential impacts on database performance and availability.
- Balancing Sensitivity and Practicality: Set thresholds that are sensitive enough to detect real issues but not so tight that they generate excessive false positives. Finding this balance is critical for effective monitoring.
Setting up Alerts and Notifications
Implementing a robust alerting mechanism is a key component of effective PostgreSQL monitoring. This ensures administrators are promptly notified when performance metrics exceed defined thresholds. To optimize this process:
- Selecting Alerting Tools: Choose the most suitable alerting tools or frameworks that integrate well with your PostgreSQL environment. Popular choices include SigNoz, Prometheus, Nagios, or PostgreSQL's built-in alerting features. The selection should be based on factors like compatibility, scalability, and ease of integration.
- Defining Alert Rules: Create alert rules that are based on the established thresholds for each critical metric. These rules should be precise to minimize false alarms while ensuring no significant issue goes unnoticed.
- Configuring Notification Channels: Set up diverse notification channels to cater to different preferences and urgencies. This may include emails, Slack messages, SMS, or integration with incident management systems. Ensure these channels are reliable and regularly tested.
- Implementing Escalation Plans: Develop an escalation plan that defines how alerts are routed to relevant personnel based on the severity of the issue. This may involve notifying different team members or roles depending on the time of day or the nature of the alert.
- Testing Alerting Mechanisms: Regularly test the alerting system to ensure it works as expected. This includes testing the alert triggers, notification delivery, and response times.
- Documenting Alerting Protocols: Maintain clear documentation of the alerting process, including the configuration of alert rules, the rationale behind threshold settings, and the escalation procedures. This documentation is vital for onboarding new team members and for reference during incident response.
- Balancing Alert Sensitivity: Strive to find a balance in alert sensitivity. Overly sensitive alerts can lead to alert fatigue, while too low sensitivity might miss critical issues. Regular reviews and adjustments of alert thresholds and rules can help maintain this balance.
Regular Audits in Performance Tuning
Regular audits are essential for maintaining and enhancing the health and efficiency of your PostgreSQL database. This process involves:
- Scheduling Performance Reviews: Conduct scheduled performance reviews and audits to assess the database's overall health. This includes examining query performance and system resource utilization.
- Analyzing and Optimizing Queries:
- Utilize tools like
pg_stat_statementsto identify and analyze slow queries. - Optimize queries through methods like index improvements, rewriting SQL statements, or adjusting database configurations.
- Utilize tools like
- Reviewing PostgreSQL Configurations:
- Continuously review and adjust PostgreSQL configurations to align with evolving workloads and performance needs.
- Ensure that the database settings are tuned to the current operational requirements.
- Assessing Resource Allocation:
- Regularly evaluate the allocation of resources such as CPU, memory, and disk space.
- Ensure that the database has the necessary resources to efficiently handle the current and anticipated workload.
- Documenting Audit Findings:
- Keep thorough documentation of audit findings, including performance improvements and any changes made.
- This documentation serves as a valuable reference for future tuning and audits.
Best Tools for PostgreSQL Monitoring
Now that you have learned about the key metrics to monitor for PostgreSQL and understood the best practices for PostgreSQL monitoring, let’s go through the best tools for PostgreSQL monitoring.
Below is the list of best tools for monitoring the PostgreSQL database.
SigNoz
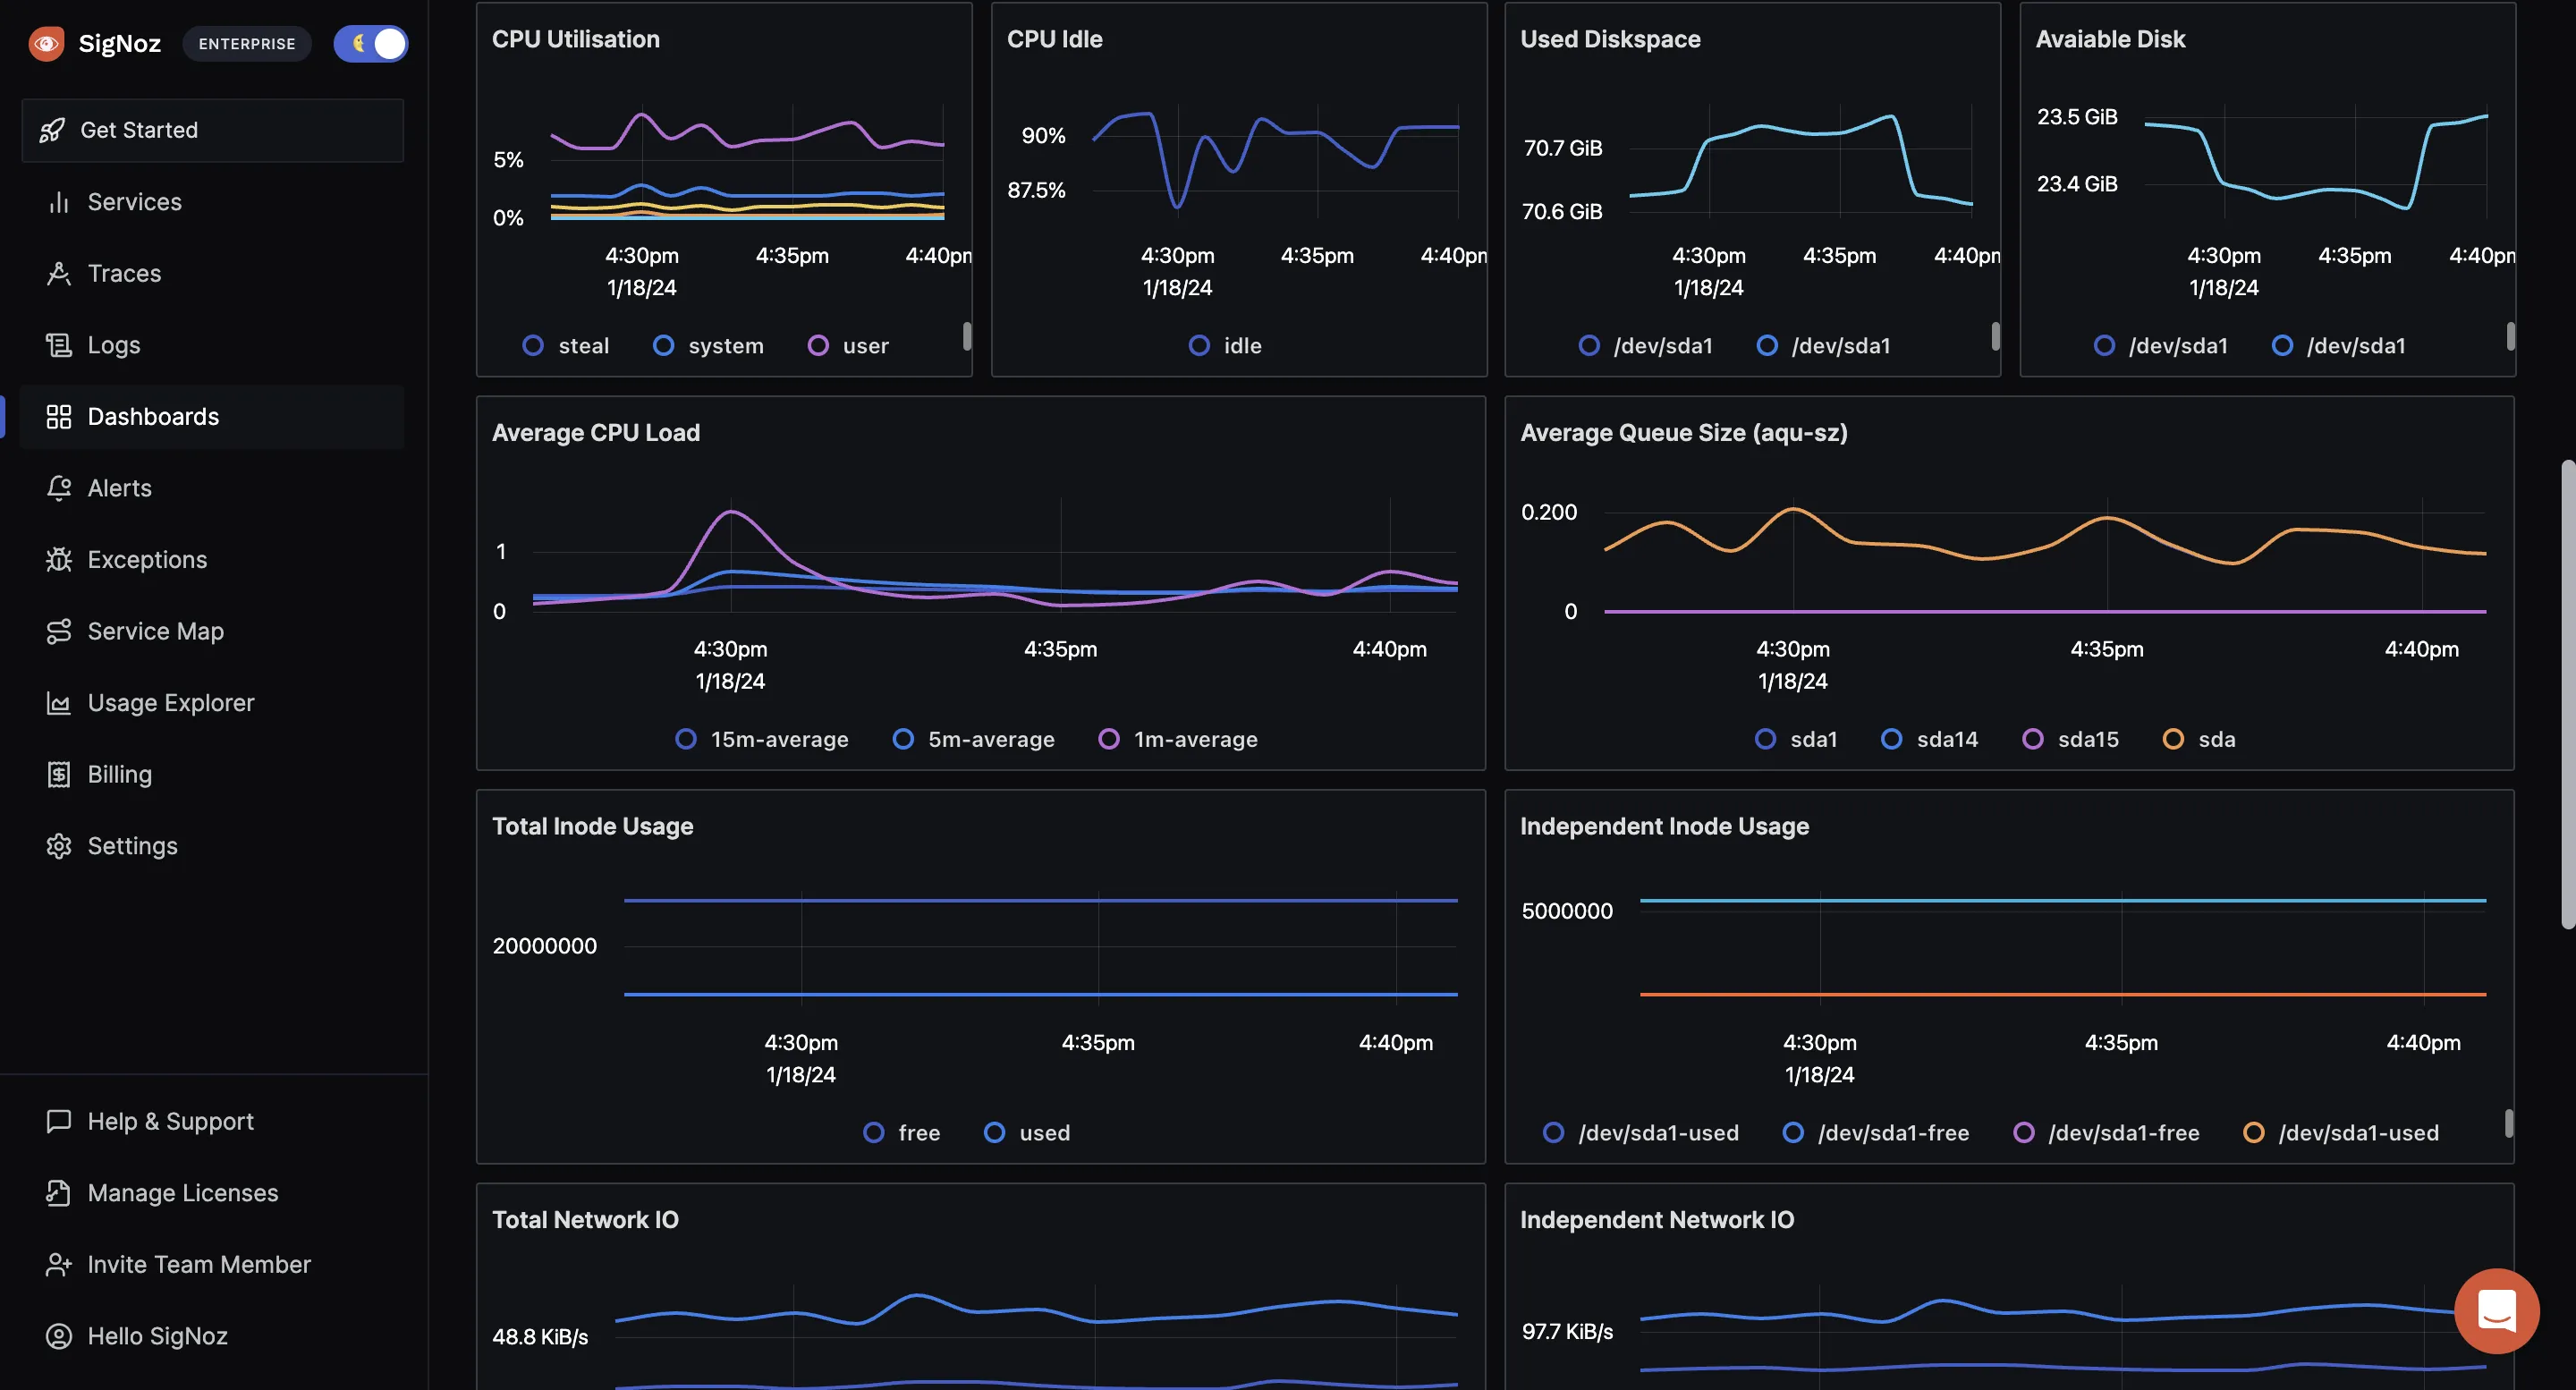
SigNoz is an open-source monitoring tool that excels in PostgreSQL metrics monitoring through OpenTelemetry. It collects PostgreSQL metrics using the OpenTelemetry Collector and visualizes this data effectively. SigNoz allows users to monitor key database metrics, enabling a comprehensive analysis of database performance. Its ability to set up customized dashboards and alerts makes it particularly useful for tracking and managing the health and efficiency of PostgreSQL instances.
For a more detailed exploration of how SigNoz performs PostgreSQL monitoring, you can visit their guide: Monitor PostgreSQL metrics with OpenTelemetry.
pgAnalyze
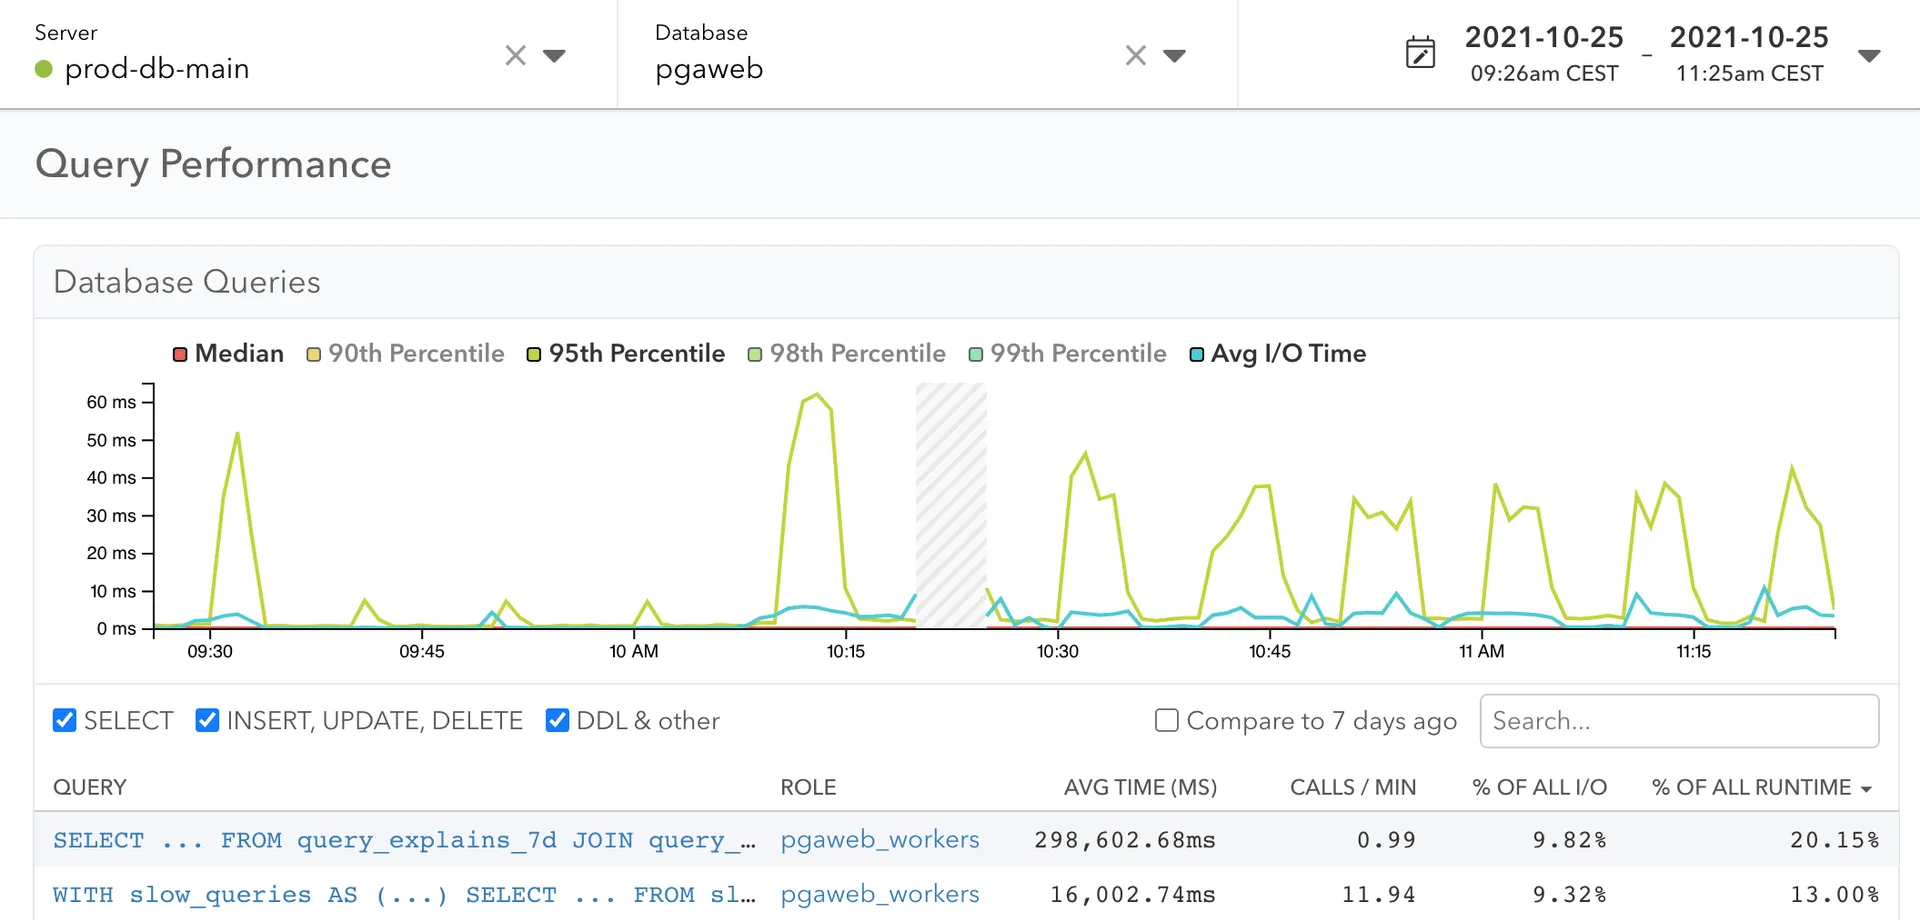
Pganalyze is a comprehensive monitoring tool designed specifically for PostgreSQL databases. It provides deep insights into the performance of PostgreSQL instances, helping database administrators and developers to optimize and maintain their database systems effectively.
The tool offers features like performance monitoring, query analysis, log insights, etc.
pgDash
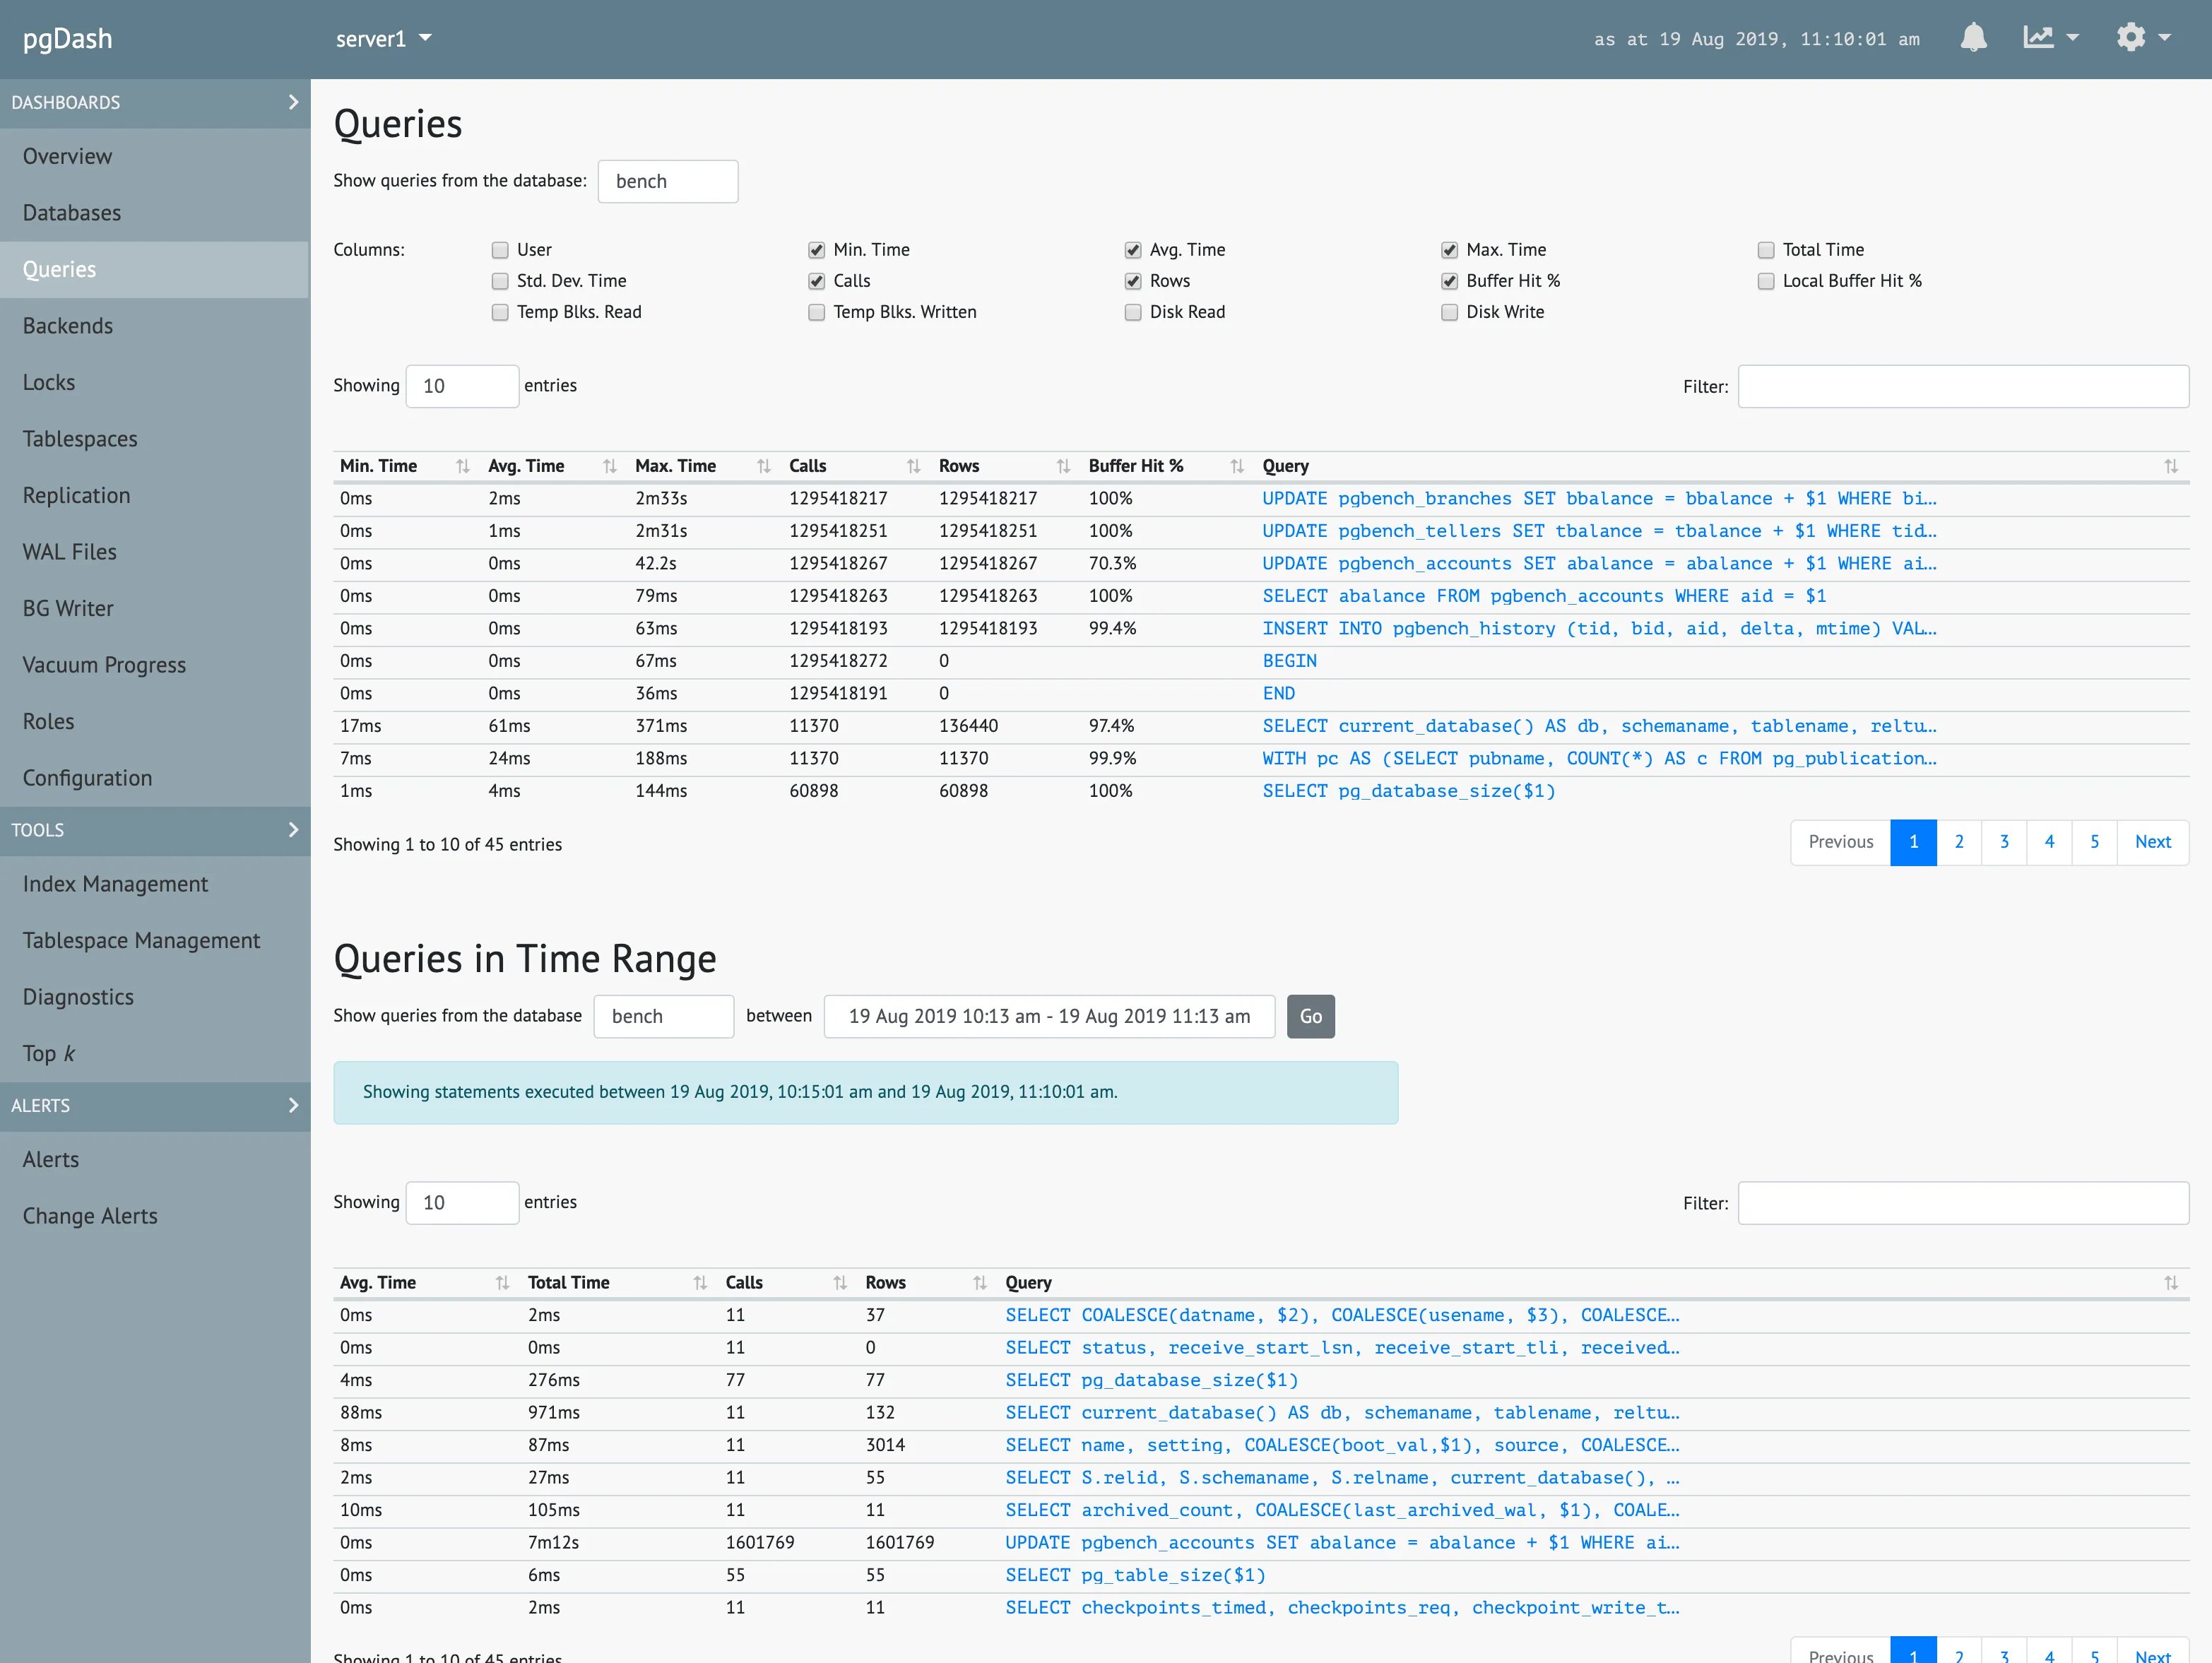
PgDash is a comprehensive diagnostic and monitoring solution for PostgreSQL. It offers core reporting and visualization capabilities, presenting in-depth data about PostgreSQL performance.
Key features include extensive SQL query information with time-series graphs and execution plans, diagnostics for scanning potential issues, and monitoring of replication metrics. PgDash also provides insights on tables, indexes, locks, and backends, along with team sharing capabilities.
It supports integrations with systems like AWS CloudWatch and PgBouncer, and offers alerting options. PgDash is available in both SaaS and self-hosted formats and is compatible with AWS RDS and Aurora.
Prometheus
Prometheus is an open-source monitoring solution that offers a multi-dimensional data model with time series data identified by metric name and key-value pairs. It features a powerful query language (PromQL) for detailed data analysis and supports efficient data storage, both in-memory and on local disk.
Prometheus provides flexible visualization options, including integration with Grafana, and is designed for reliable operation, with each server operating independently. It also offers precise alerting based on PromQL with an alert manager for handling notifications. Additionally, Prometheus is highly extensible, with many client libraries and integrations for third-party data.
New Relic
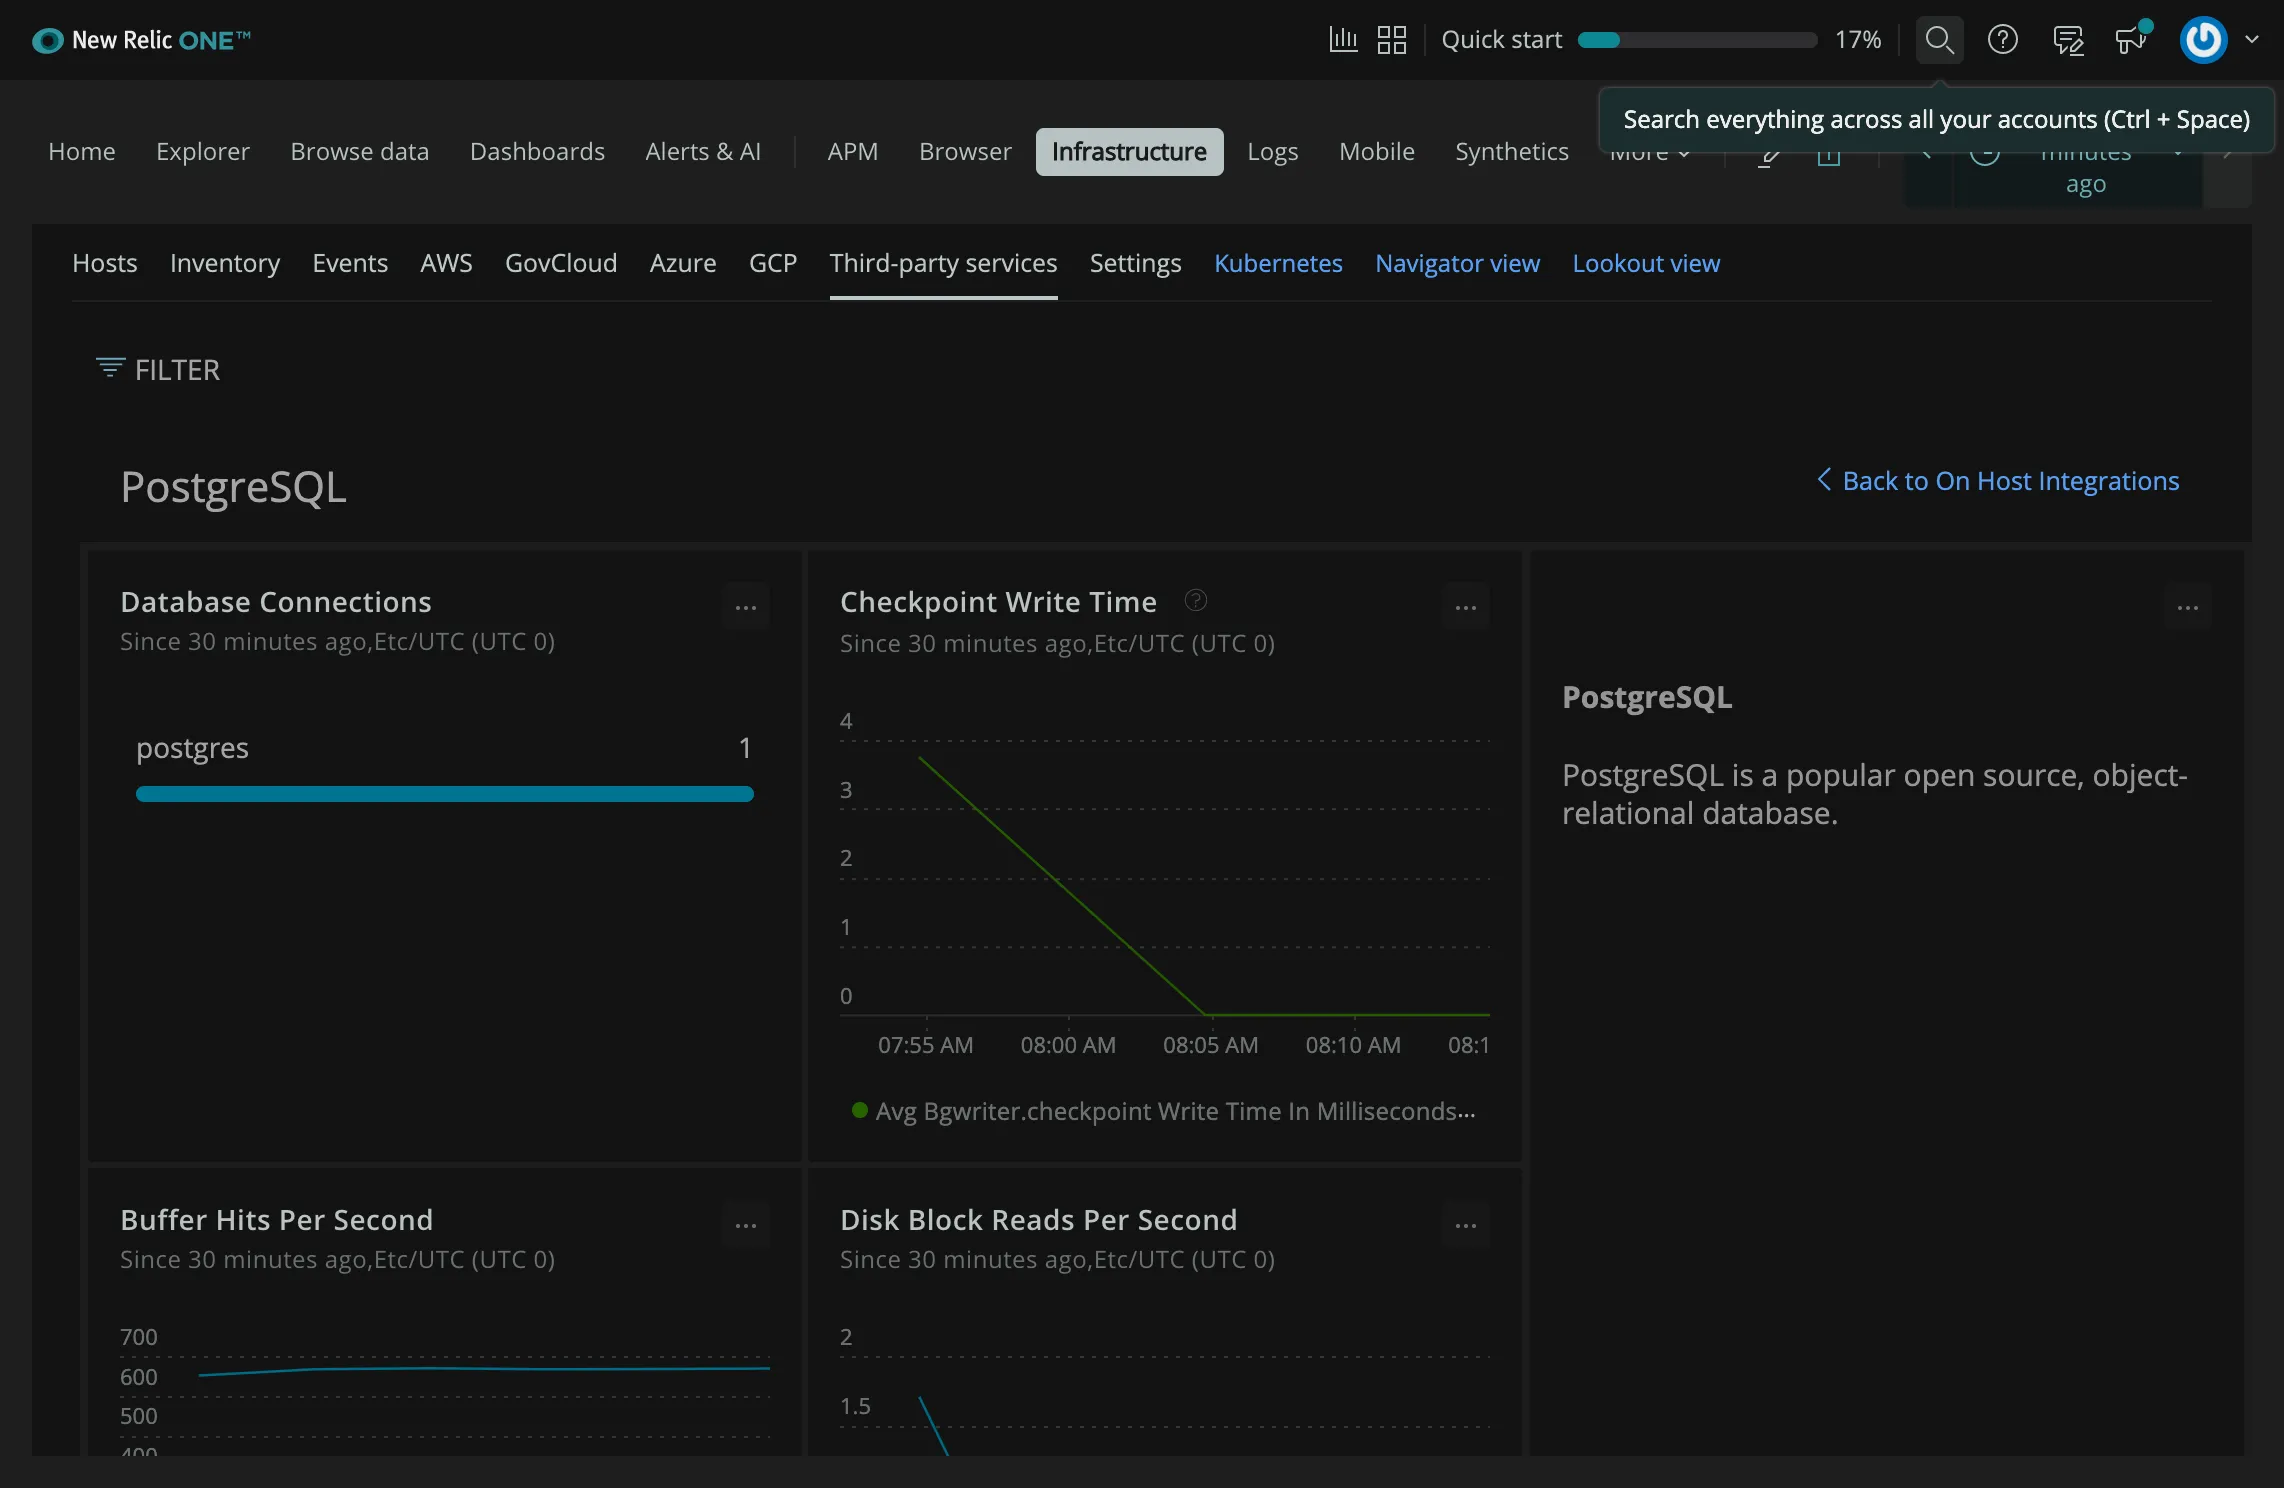
New Relic is a versatile performance monitoring tool that offers robust features for monitoring PostgreSQL databases. It provides detailed insights into database performance, including query analysis, throughput, and response times.
With New Relic, users can track and visualize key metrics like transaction volumes, error rates, and service response times. Its alerting system notifies users about performance anomalies or system issues. Additionally, New Relic supports integration with cloud and on-premise PostgreSQL instances, offering a comprehensive view of database health and performance in real time.
Datadog
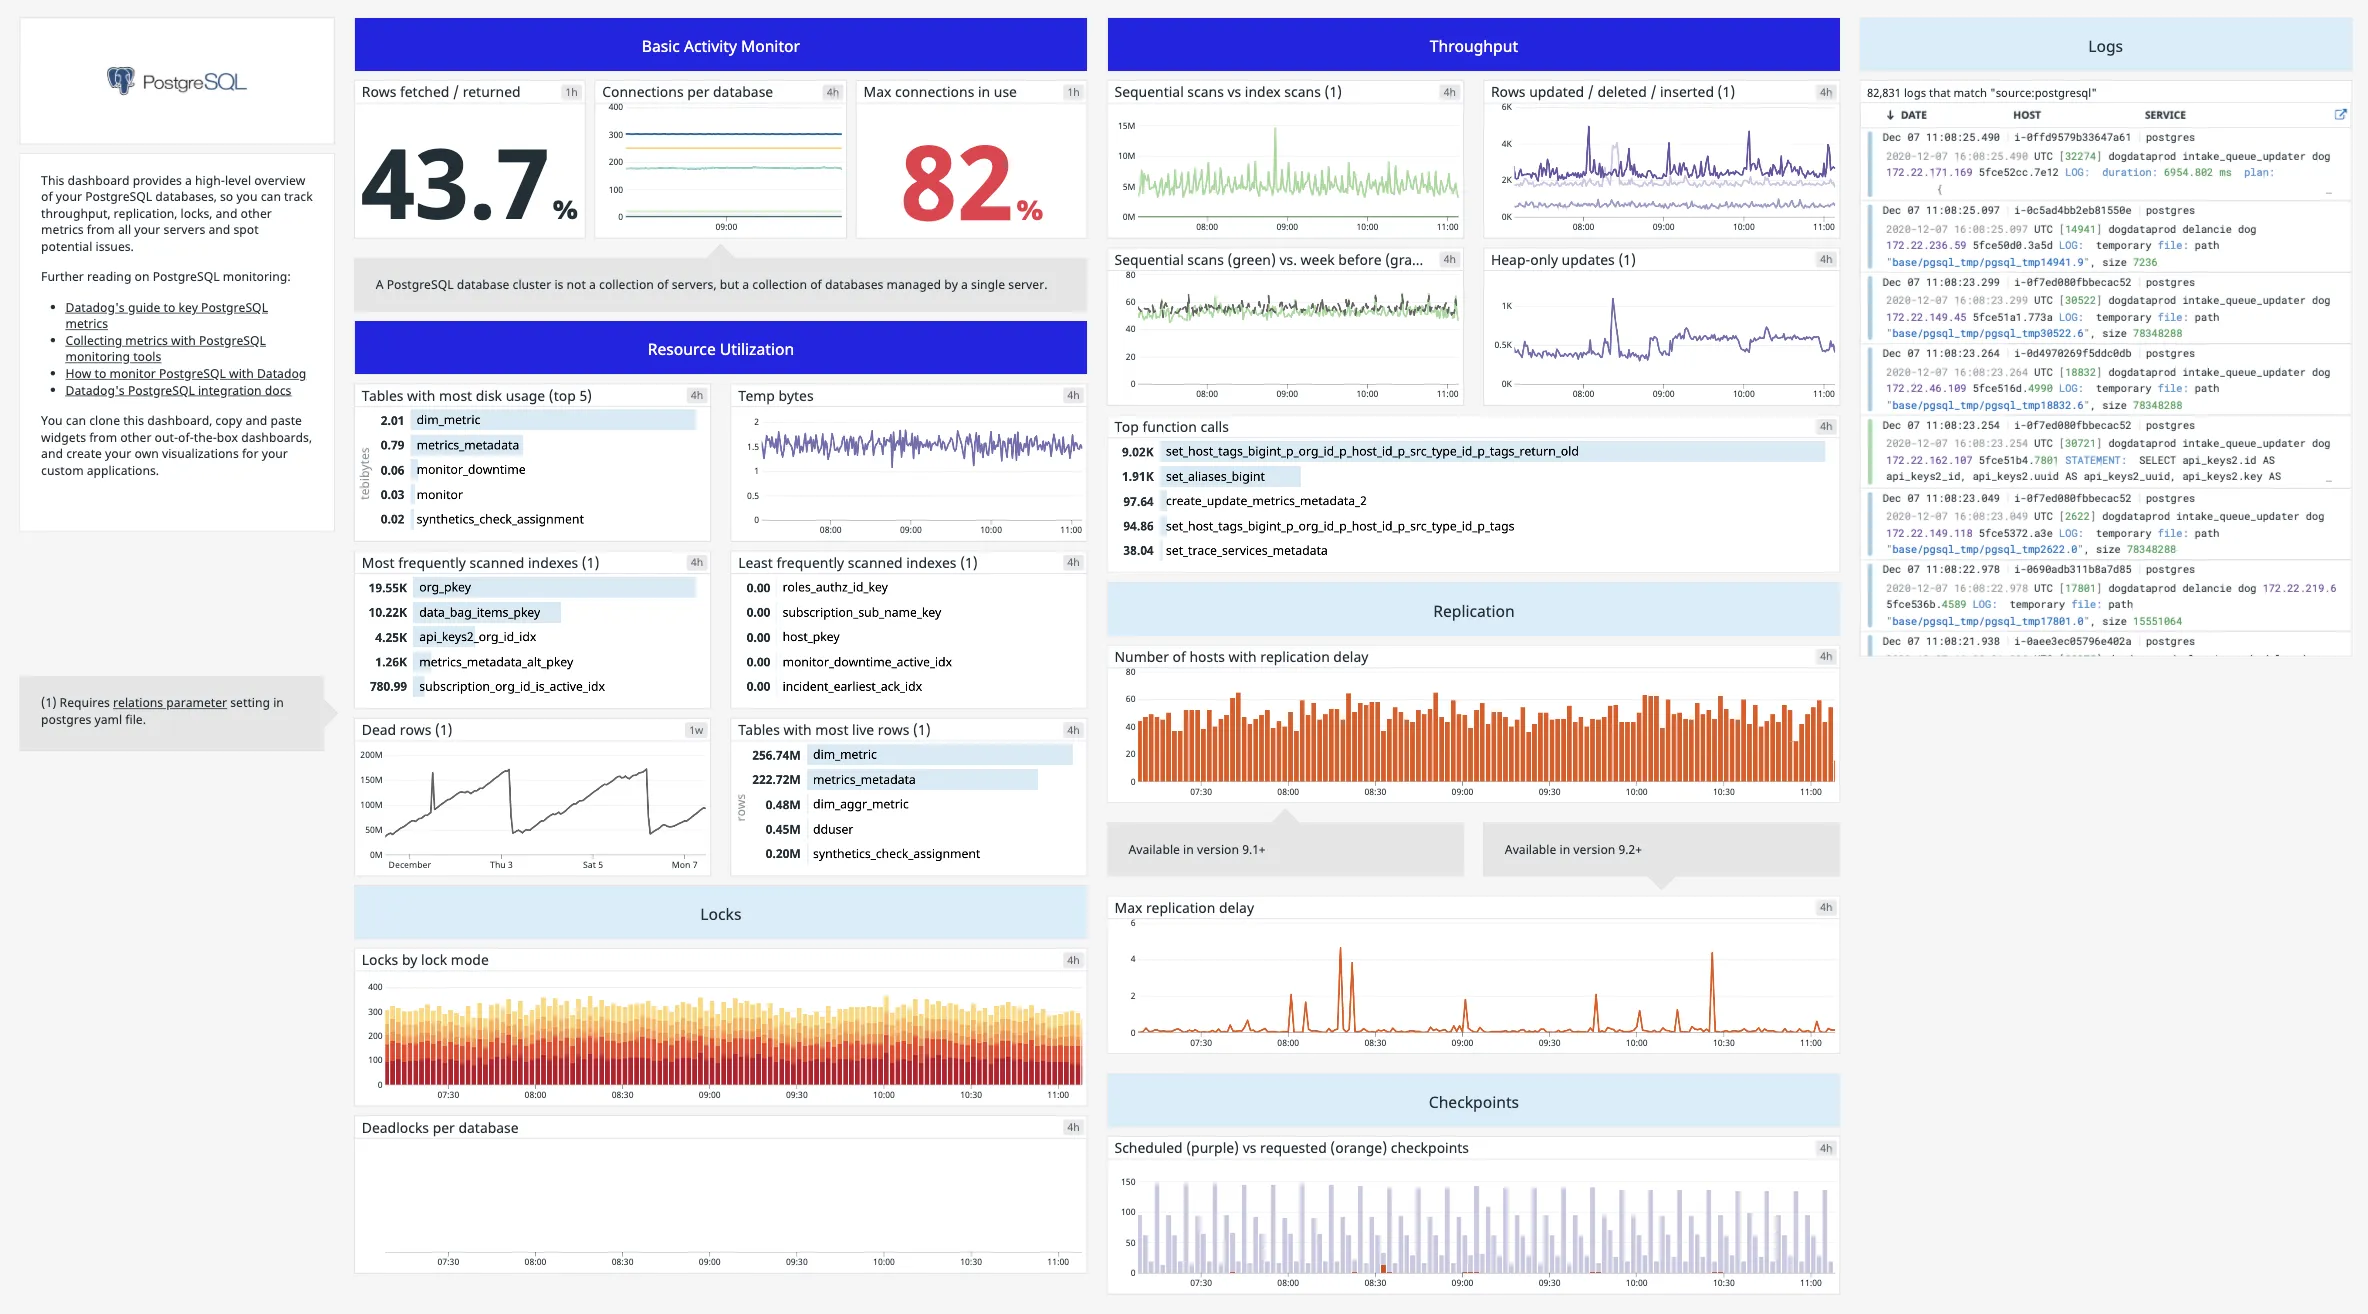
Datadog is a robust monitoring tool that provides comprehensive insights for PostgreSQL databases. It automatically collects data from PostgreSQL's statistics collector, enabling visibility into key metrics in a customizable dashboard.
Datadog's integration facilitates query-level performance insights, allowing for the optimization of slow queries. It also supports tracing PostgreSQL queries within applications, aiding in identifying bottlenecks. This versatility makes Datadog ideal for both high-level monitoring and detailed performance analysis of PostgreSQL databases.
Grafana
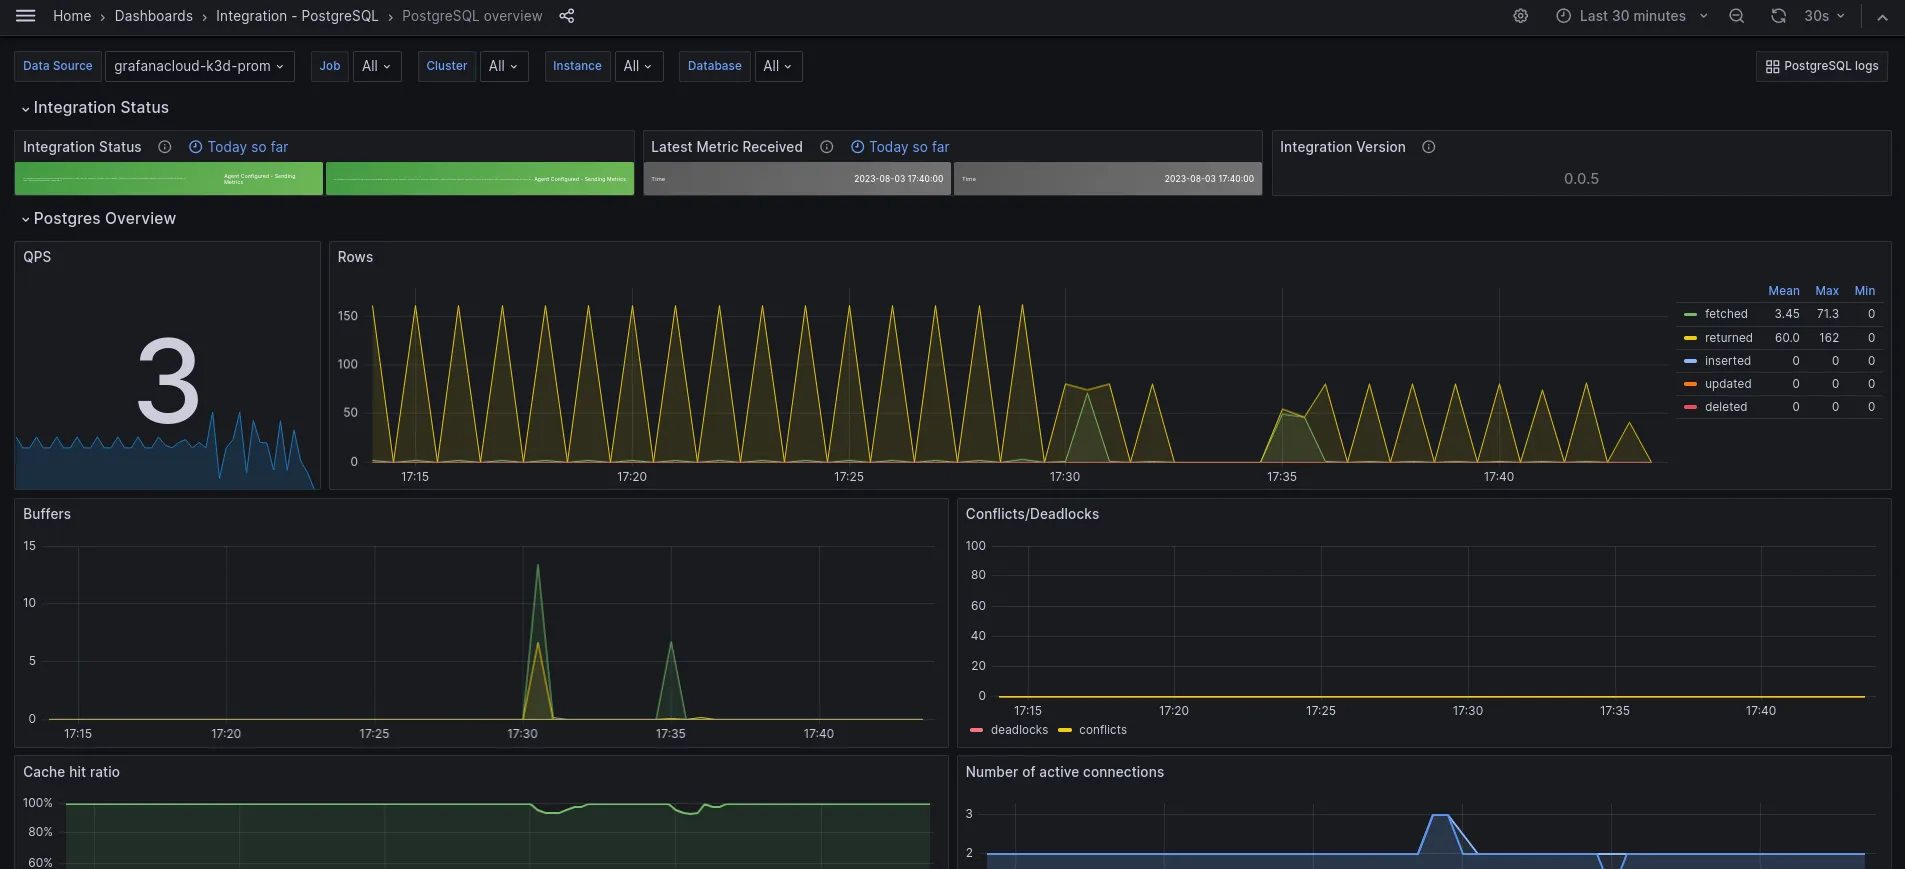
Grafana is a powerful visualization and analytics software that integrates seamlessly with PostgreSQL for monitoring and data analysis. It enables users to create interactive, real-time dashboards to visualize PostgreSQL metrics and logs.
Grafana's versatility lies in its support for various data sources, including PostgreSQL, allowing for comprehensive database monitoring. Users can customize dashboards to track specific PostgreSQL metrics, set up alerts, and analyze long-term trends. This makes Grafana an essential tool for database administrators and teams who need to keep a close eye on database performance and health.
Conclusion
In this post, we covered all the aspects of effective PostgreSQL monitoring. We went through some key metrics for PostgreSQL monitoring, covered best practices that you should follow when setting up PostgreSQL monitoring, and then covered top tools that you can use for PostgreSQL monitoring.
A monitoring tool that allows you to store, query, and visualize PostgreSQL monitoring metrics can help you debug performance issues quickly. For modern applications based on a distributed architecture, it is important to correlate your PostgreSQL metrics with the rest of the application infrastructure.
SigNoz is a full-stack open-source observability tool that can help you monitor your PostgreSQL instances while also providing monitoring for the rest of your application. It provides metrics, logs, and traces under a single pane of glass. When you use SigNoz for PostgreSQL monitoring, you can correlate your important metrics with traces and logs, and that can help you debug potential issues quickly.
SigNoz cloud is the easiest way to run SigNoz. You can sign up here for a free account and get 30 days of unlimited access to all features.
You can also install and self-host SigNoz yourself. Check out the docs for installing self-host SigNoz.
Further Reading
