Troubleshooting Python with OpenTelemetry Tracing
In the classic definition, Observability is something one step beyond monitoring; it’s how easy our system is to understand with the architecture and monitoring we have. The problem is a familiar one: we have monitoring tools but they’re not answering our question. This article shows how a Python developer can go from having traces but not answers, to fully understanding the root cause of a latency issue.

The Problem: Python Monitoring without Observability
Let’s lay out our scenario: we’re using a Python application with automatic monitoring from the OpenTelemetry Python SDK. It’s correctly monitoring the number of requests we’re getting, and it’s able to tell us that there are some extreme spikes in latency.
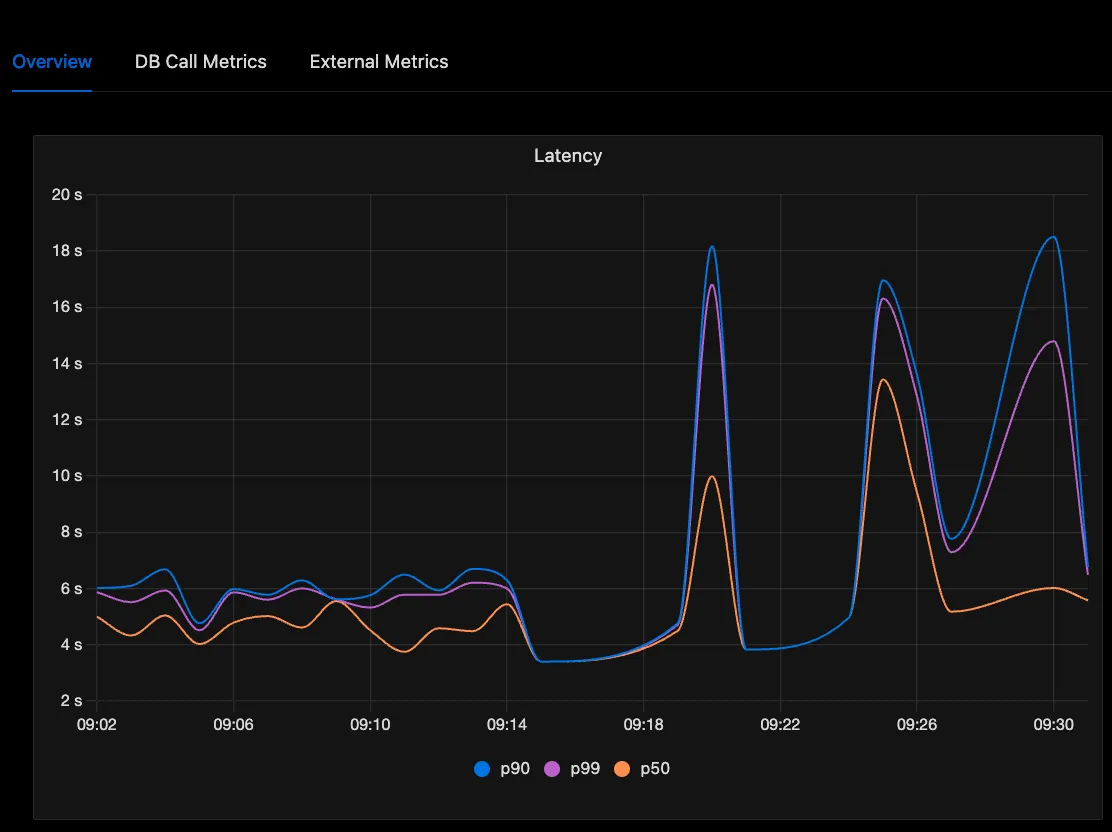
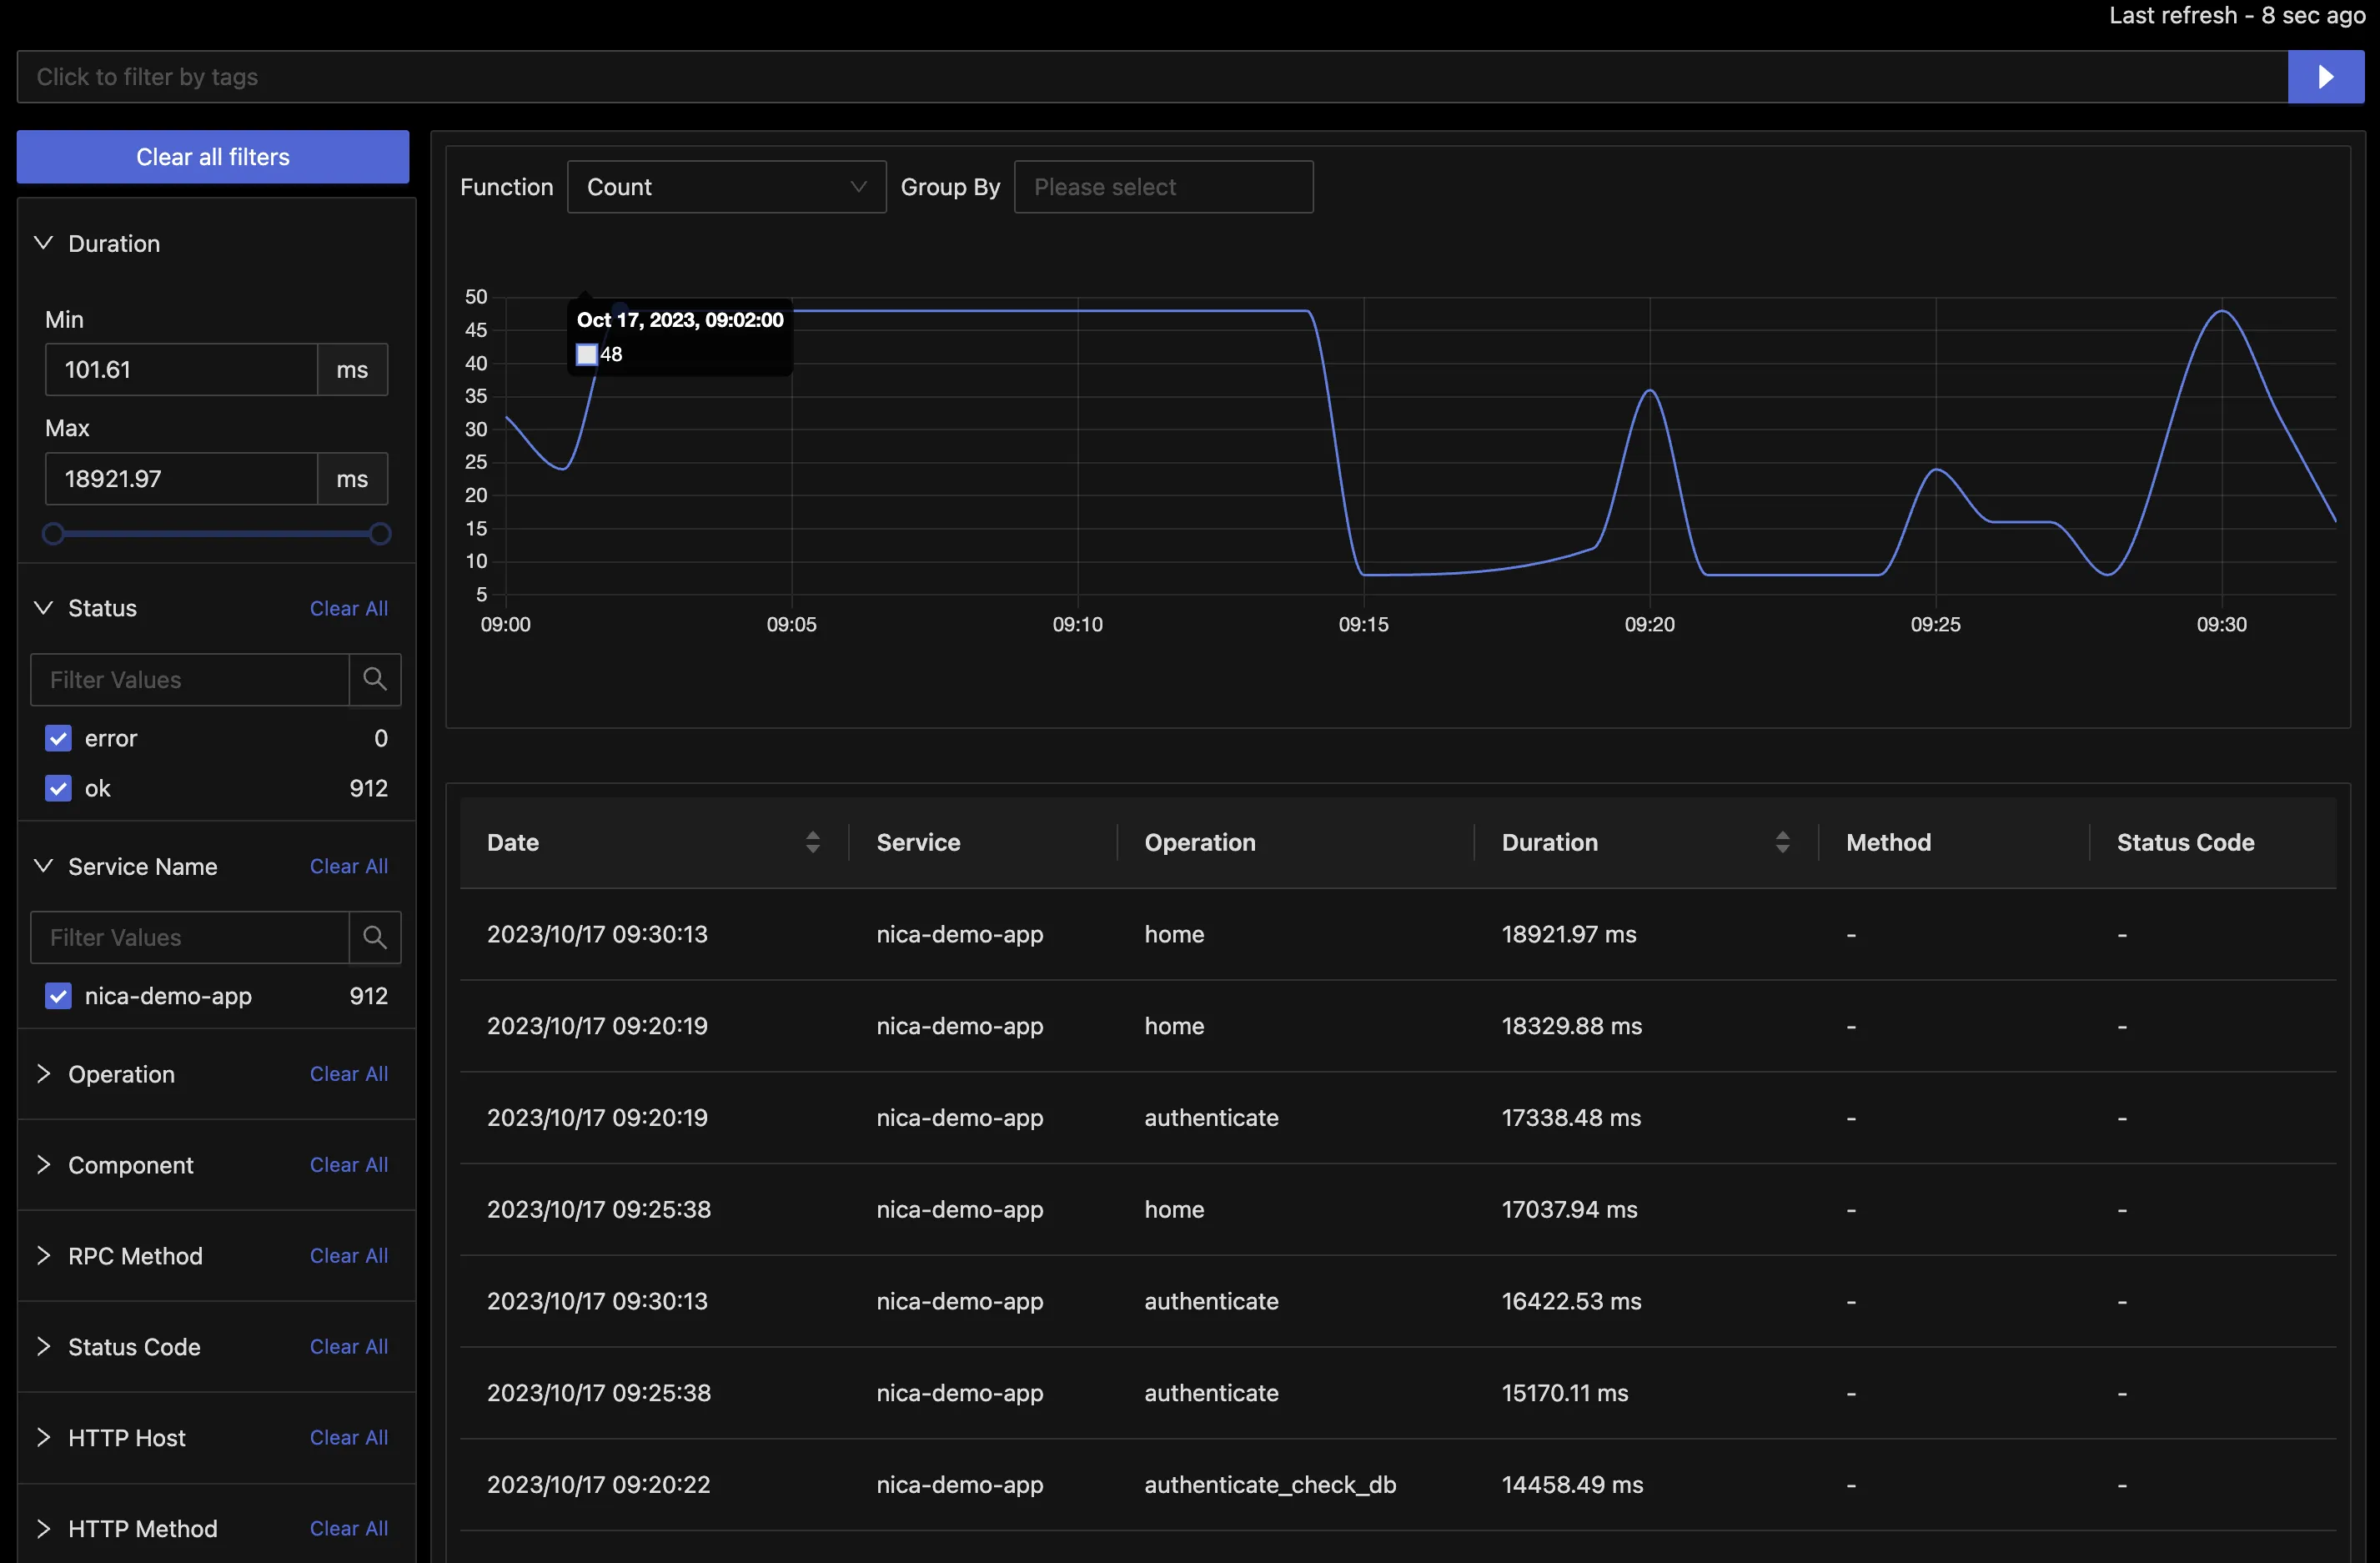
So, we definitely have monitoring working, in that it’s showing us there’s a problem and it’s frequent enough to be a concern for all users. Let’s dive in further and we’ll see the current setup lacks Observability. First let’s take a look at traces and sort them by duration. Sure enough we’ve got traces for some requests that took too long to handle:
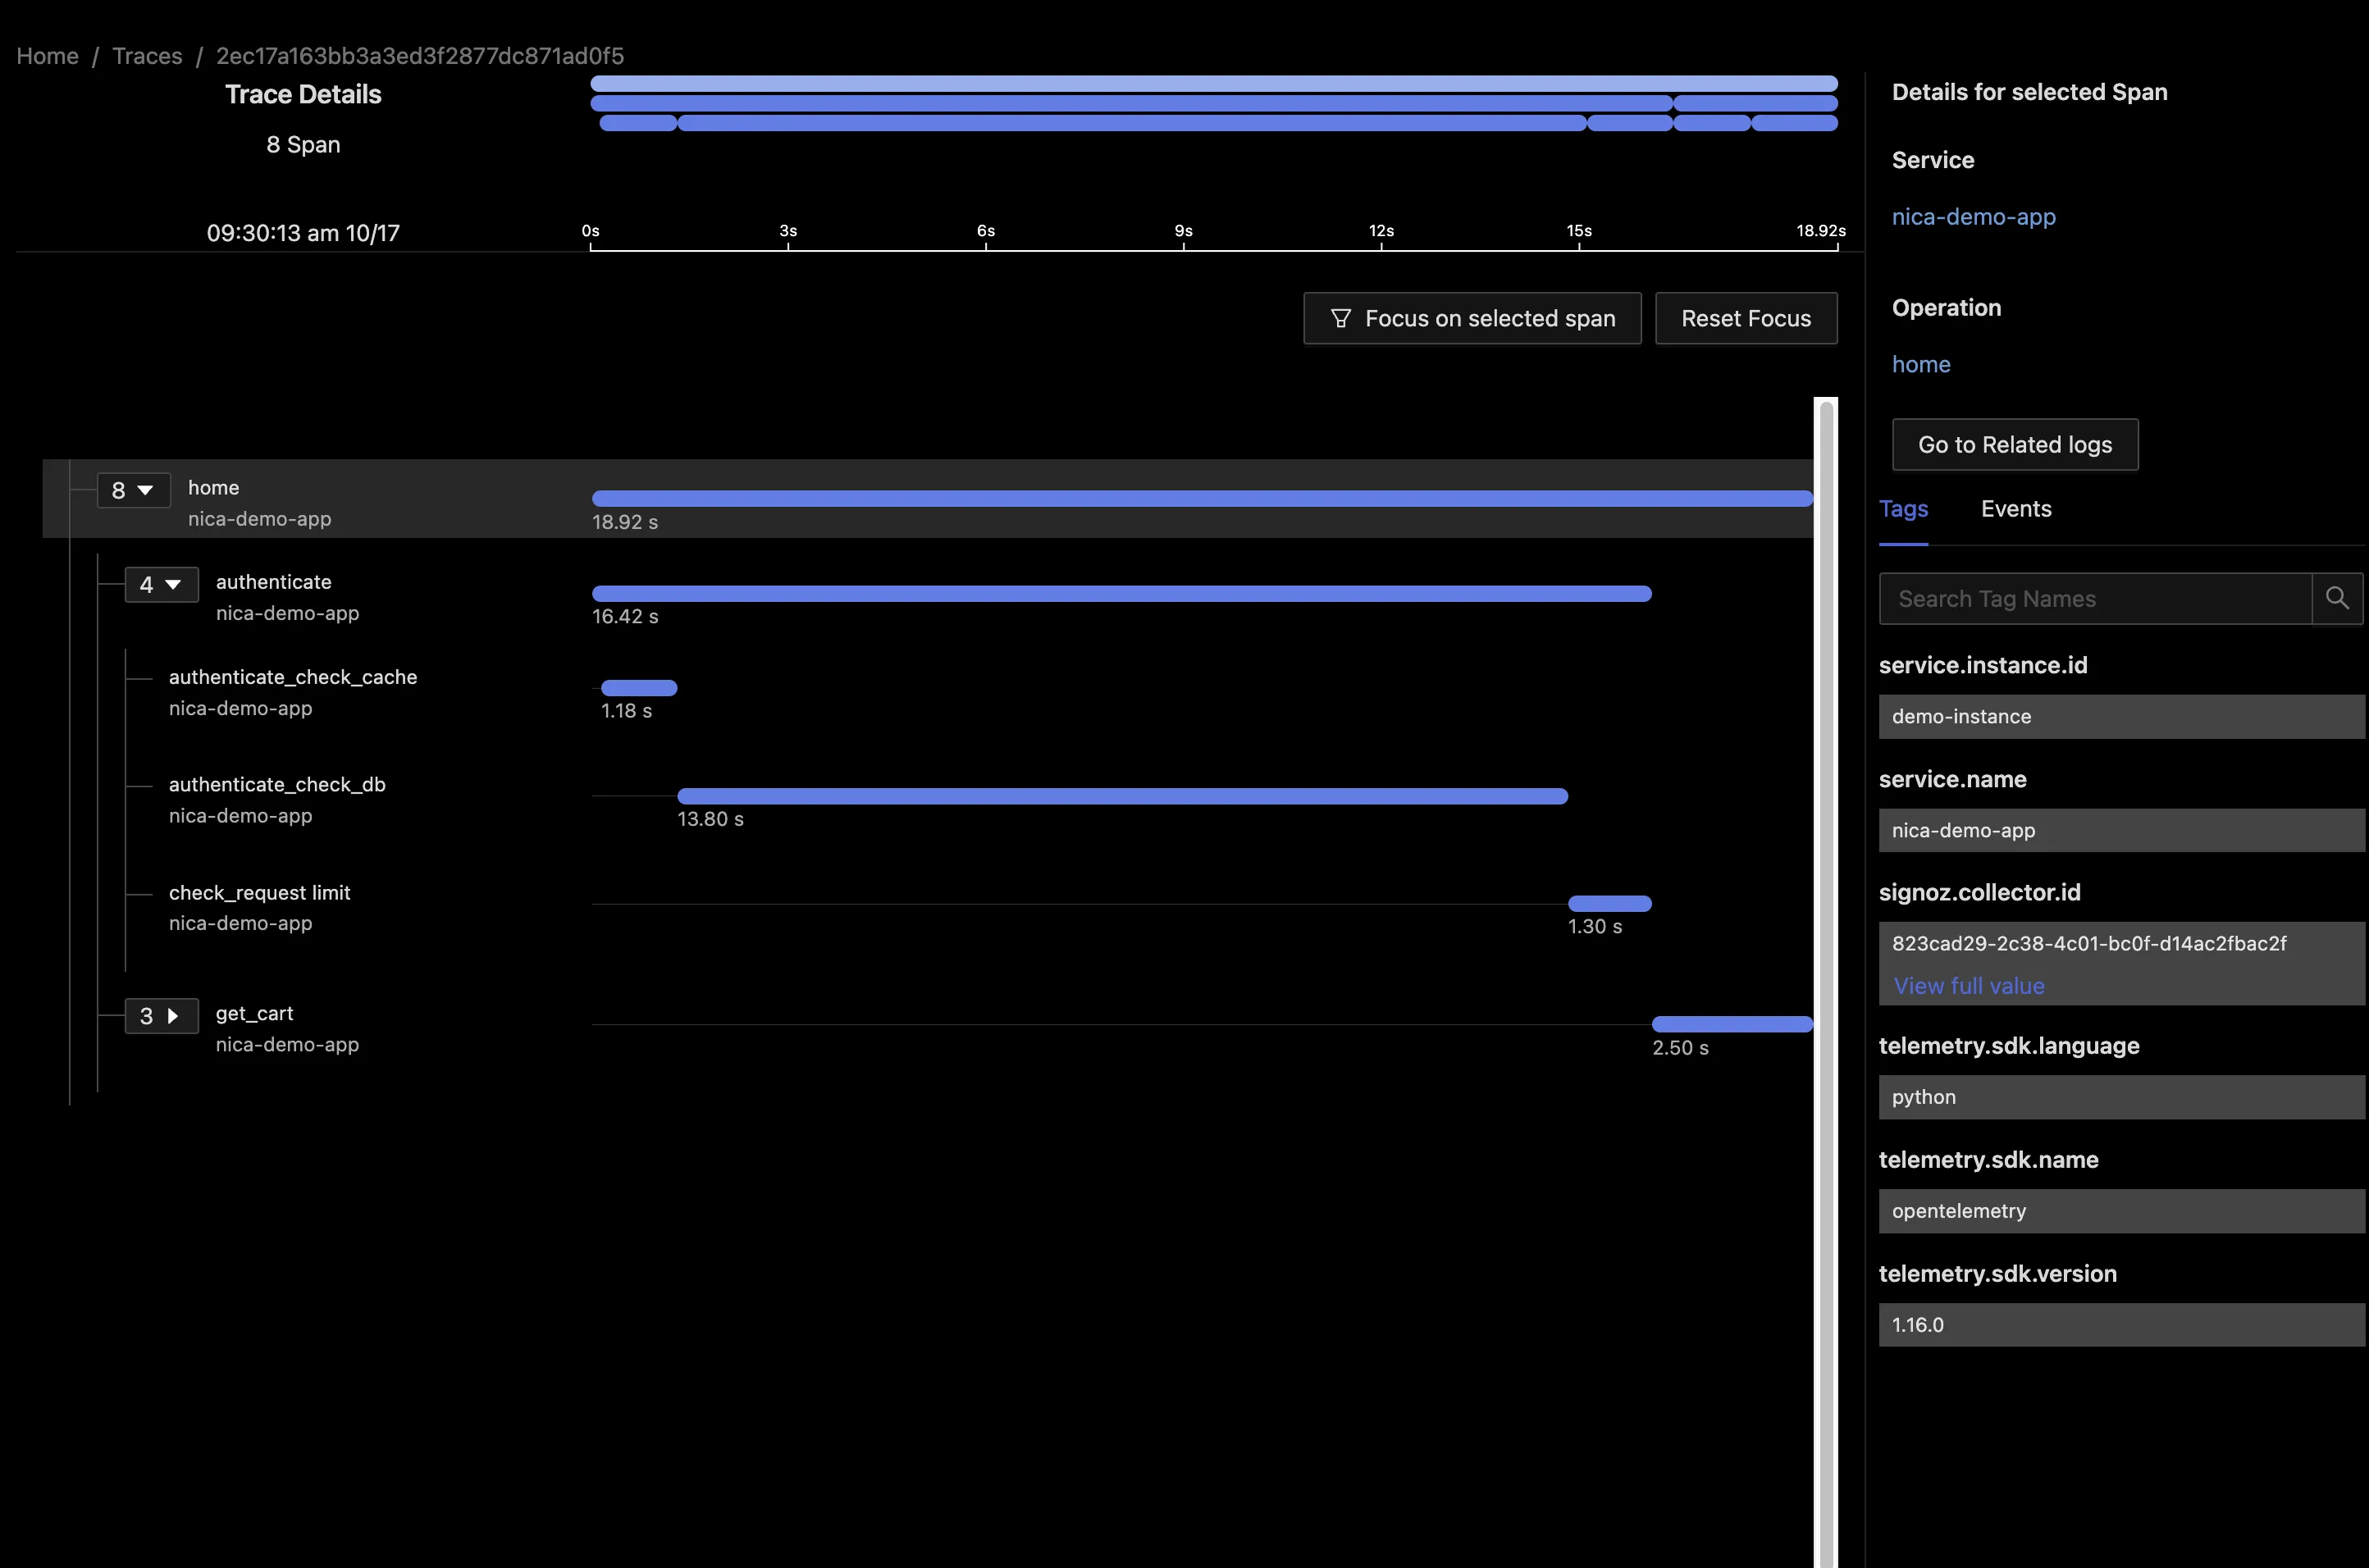
When we dive into these traces we get another clue: there’s almost 13 seconds spent in a database request, authenticate_check_db.
Here we get to one of the interesting facts about Observability: systems are more observable the more knowledge and experience you have with the system. It’s possible that a senior developer who’s worked with this codebase for years will know one of two things right away:
- Why
authenticate_check_dbcan intermittently perform slowly - Failing that, how to check logs within the database and connect the log lines with this trace
In those cases, the ‘clues’ we have from OpenTelemetry will be enough to point the way to the cause. But we need to admit in these cases that we don’t really have great observability implemented. A junior developer would be totally lost at this point, not least because there are no identifying attributes on this request. We’ll be hard pressed to connect this trace to another logged request elsewhere, unless our OpenTelemetry setup has already linked the logs at the time trace was measured.
This guide will show you how to go from this state to one where any developer who works with this service should be able to diagnose the problem very quickly from within their SigNoz OpenTelemetry dashboard.
How to Improve OpenTelemetry Observability
To add depth to this tracing information, we’ll start by checking for a config-level fix, then add attributes to our trace, next we’ll add full-fledged events, and finally add child spans to the trace that give a complete view to anyone looking at OpenTelemetry data from this Python application.
Can Ops fix this problem without my doing anything?
One question we should ask before going any further: is it possible that our operations team can help us before we go much deeper? When we first set up OpenTelemetry monitoring with automatic instrumentation, the developers would have had little to no involvement, with all the setup being done in configuration, making sure the OpenTelemetry SDK effectively wrapped your application code. Before diving in with custom markers for our traces, we should check in with whoever implemented tracing in the first place to ask if anything can change at the configuration level.
For example, the OpenTelemetry collector may be removing attributes or dropping important traces, and a change to these settings may shed light on the problem. Admittedly, in this case it’s not likely, but it’s worth a check before we start adding calls to our application code.
Add attributes to identify requests
The first thing we’d like to do is to differentiate these requests slightly. Currently our user authentication method request doesn’t show the user that’s logging. We can fix this by adding an attribute to our span.
from opentelemetry import trace
[...]
def authenticate_check_db(user)
	current_span = trace.get_current_span()
	current_span.set_attribute("user", user)
This will send our user as a span attribute. Attributes are key-value pairs only, and we shouldn’t add long serialized strings as attributes. That’s a better use for events, listed below.
Now when we look at traces, we can see a user for each authenticate_check_db span.
Add semantic attributes
In the OpenTelemetry semantic conventions for database calls, there are specific attributes that can provide valuable context for tracing and monitoring. Here are some attributes that might help diagnose a problem with intermittent:
- db.operation: It describes the type of database operation being performed, such as SELECT, INSERT, UPDATE, or DELETE.
- db.cached: indicates whether the query result is fetched from a cache, often the culprit in intermittent latency.
- db.rows_affected: It represents the number of rows affected by the database operation. This can be crucial for monitoring the impact of write operations.
Adding these attributes requires that we start a new span from the tracer object. To follow the standard your span kind should be client.
with tracer.start_as_current_span("db_operation_span"):
    # Add attributes for db.operation, db.cached, and db.rows_affected
    span = trace.get_current_span()
    span.set_attribute("db.operation", "SELECT")
    span.set_attribute("db.cached", db_return_cached)
    span.set_attribute("db.rows_affected", db_return_rows)
Add events to traces for unusual occurences
Events are even simpler than attributes, encoding a string at a particular time in span execution. These events are discrete moments or points of interest within the span's duration, such as method calls, network requests, or any significant activity. Events capture context, timestamps, and optional attributes. In my first attempt at this example I added events for db_query_start and db_query_end but this really isn’t right. Events capture points in time, but if you’re measuring the time between a start and an end, you really want a span.
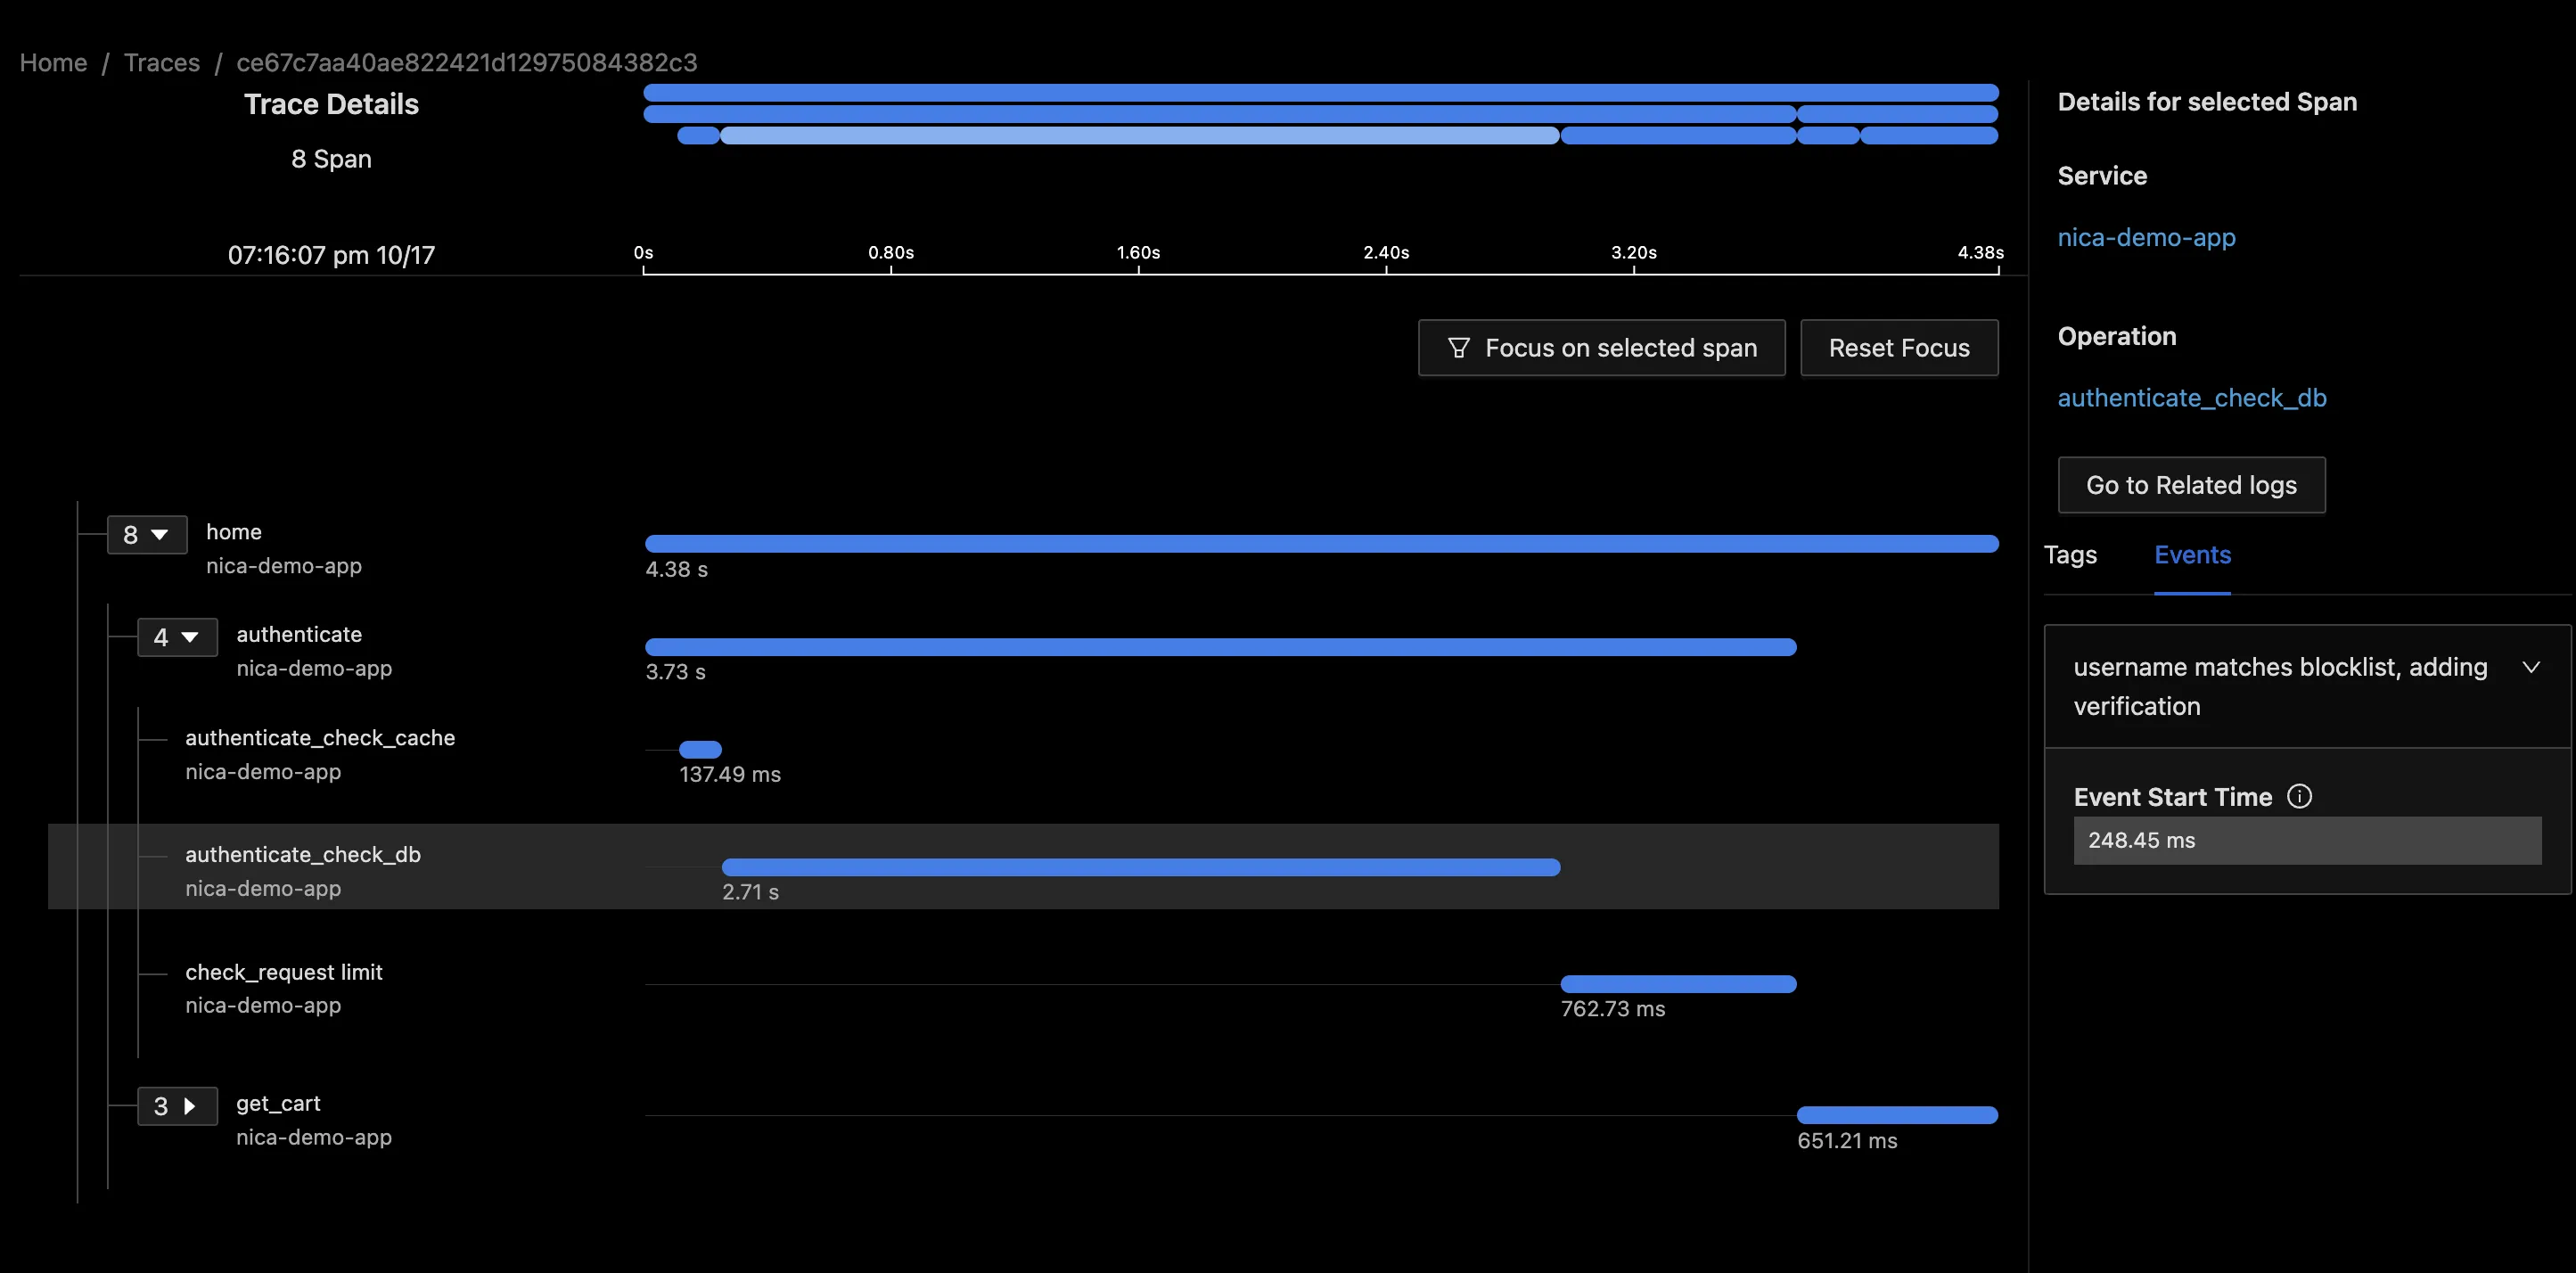
A better strategy with events is to find points of interest that exist at a single moment in time. In my case, I noticed that the database authentication call includes an optional verification step. Therefore I added the event current_span.add_event("username matches blocklist, adding verification").
Sure enough, when checking the traces for slowest transactions, they all include this event:
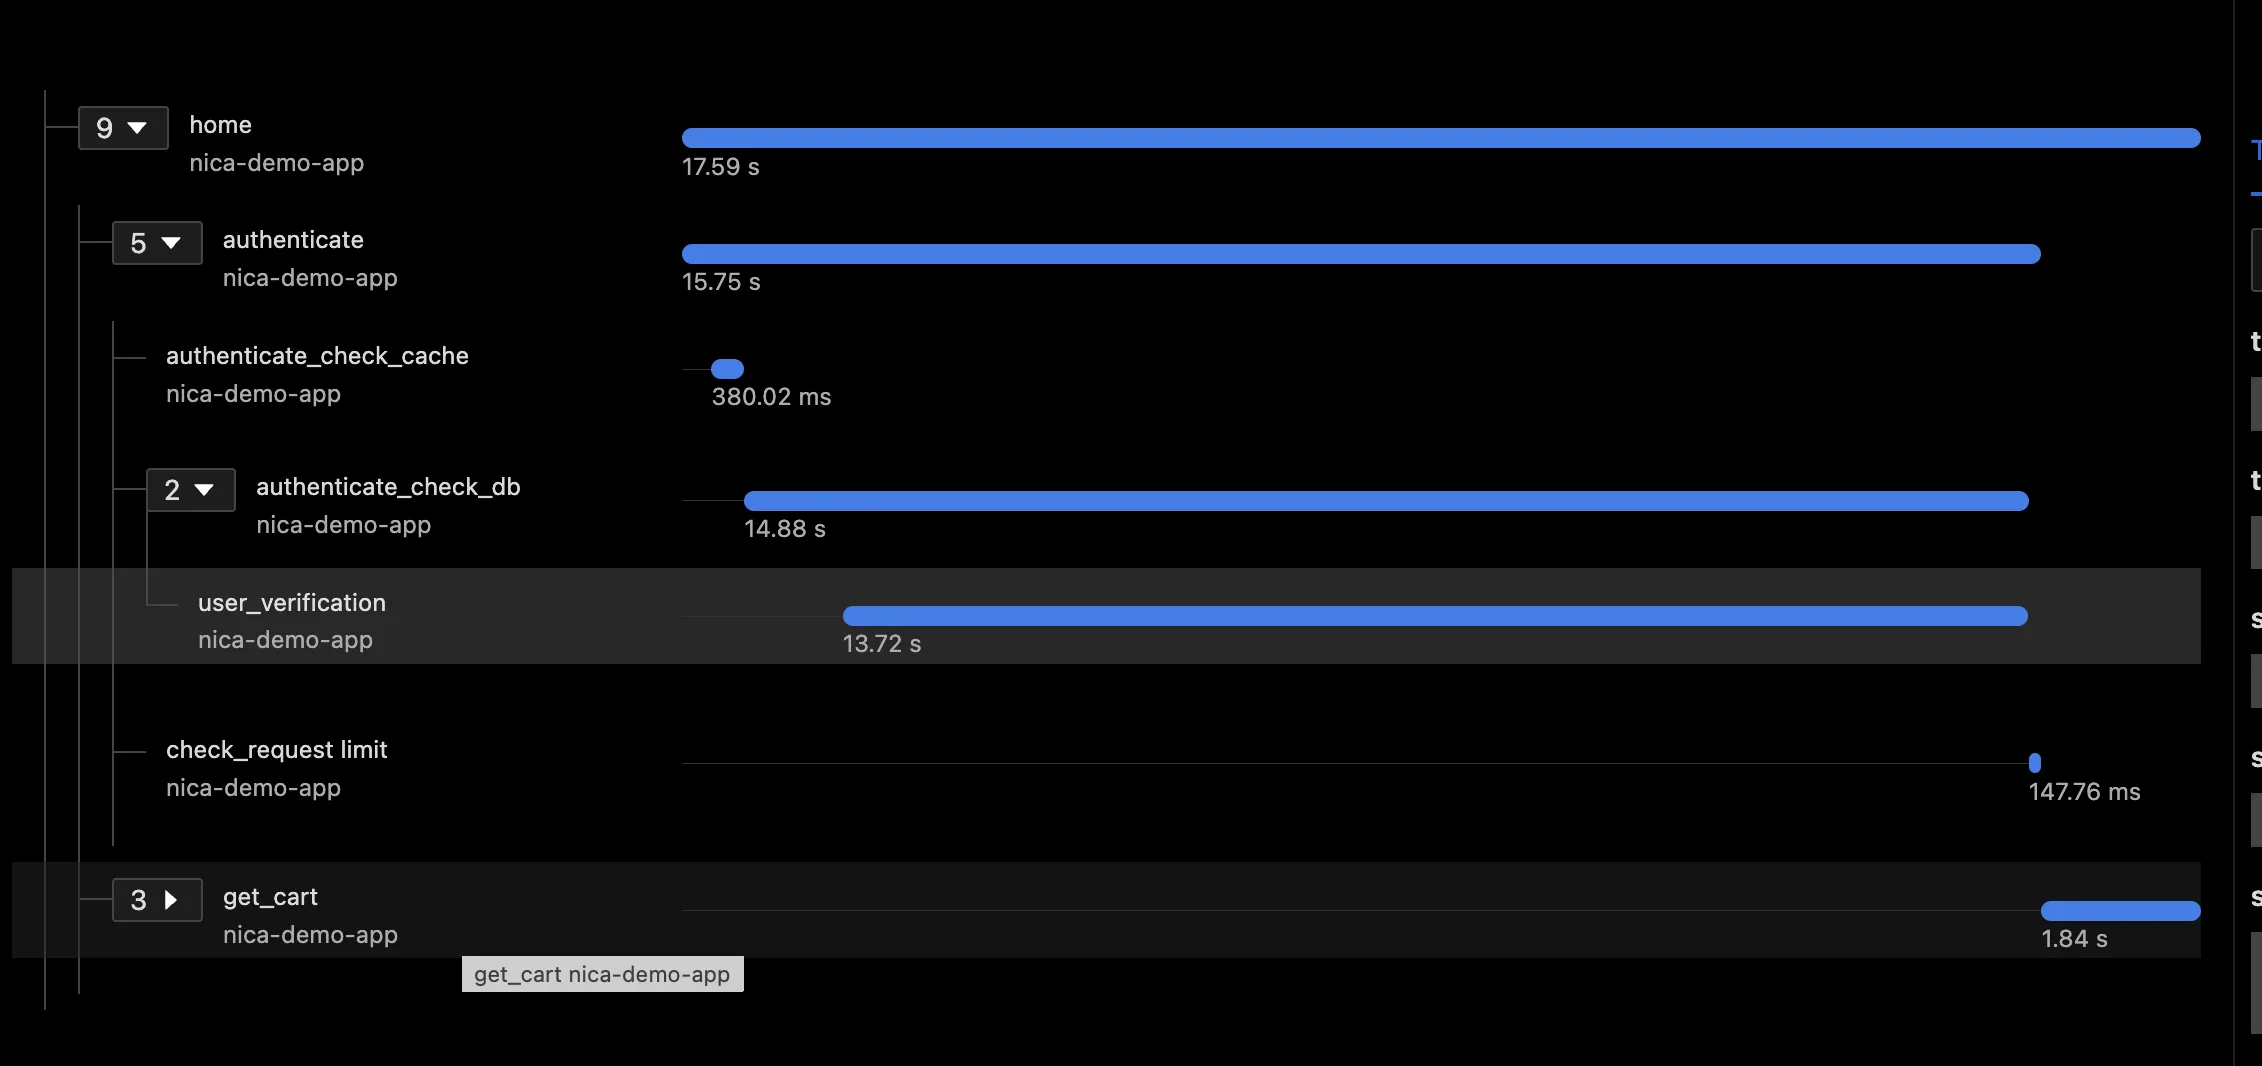
Add child spans to track sub-functions
Above I mentioned that spans are the solution when want to measure something with a start and end time. We want to add a span for user verification. In our case it’s a child span, since the work has to happen synchronously with the main DB request. Our final method looks like this:
with tracer.start_as_current_span("authenticate_check_db"):
                    current_span = trace.get_current_span()
                    current_span.set_attribute("user", user)
                    # do work
                    with tracer.start_as_current_span("user_verification"):
                        if user == "eddy":
                            current_span.add_event("username matches blocklist, adding verification")
                            # do work (slower)
                        else:
                            # do work (faster)
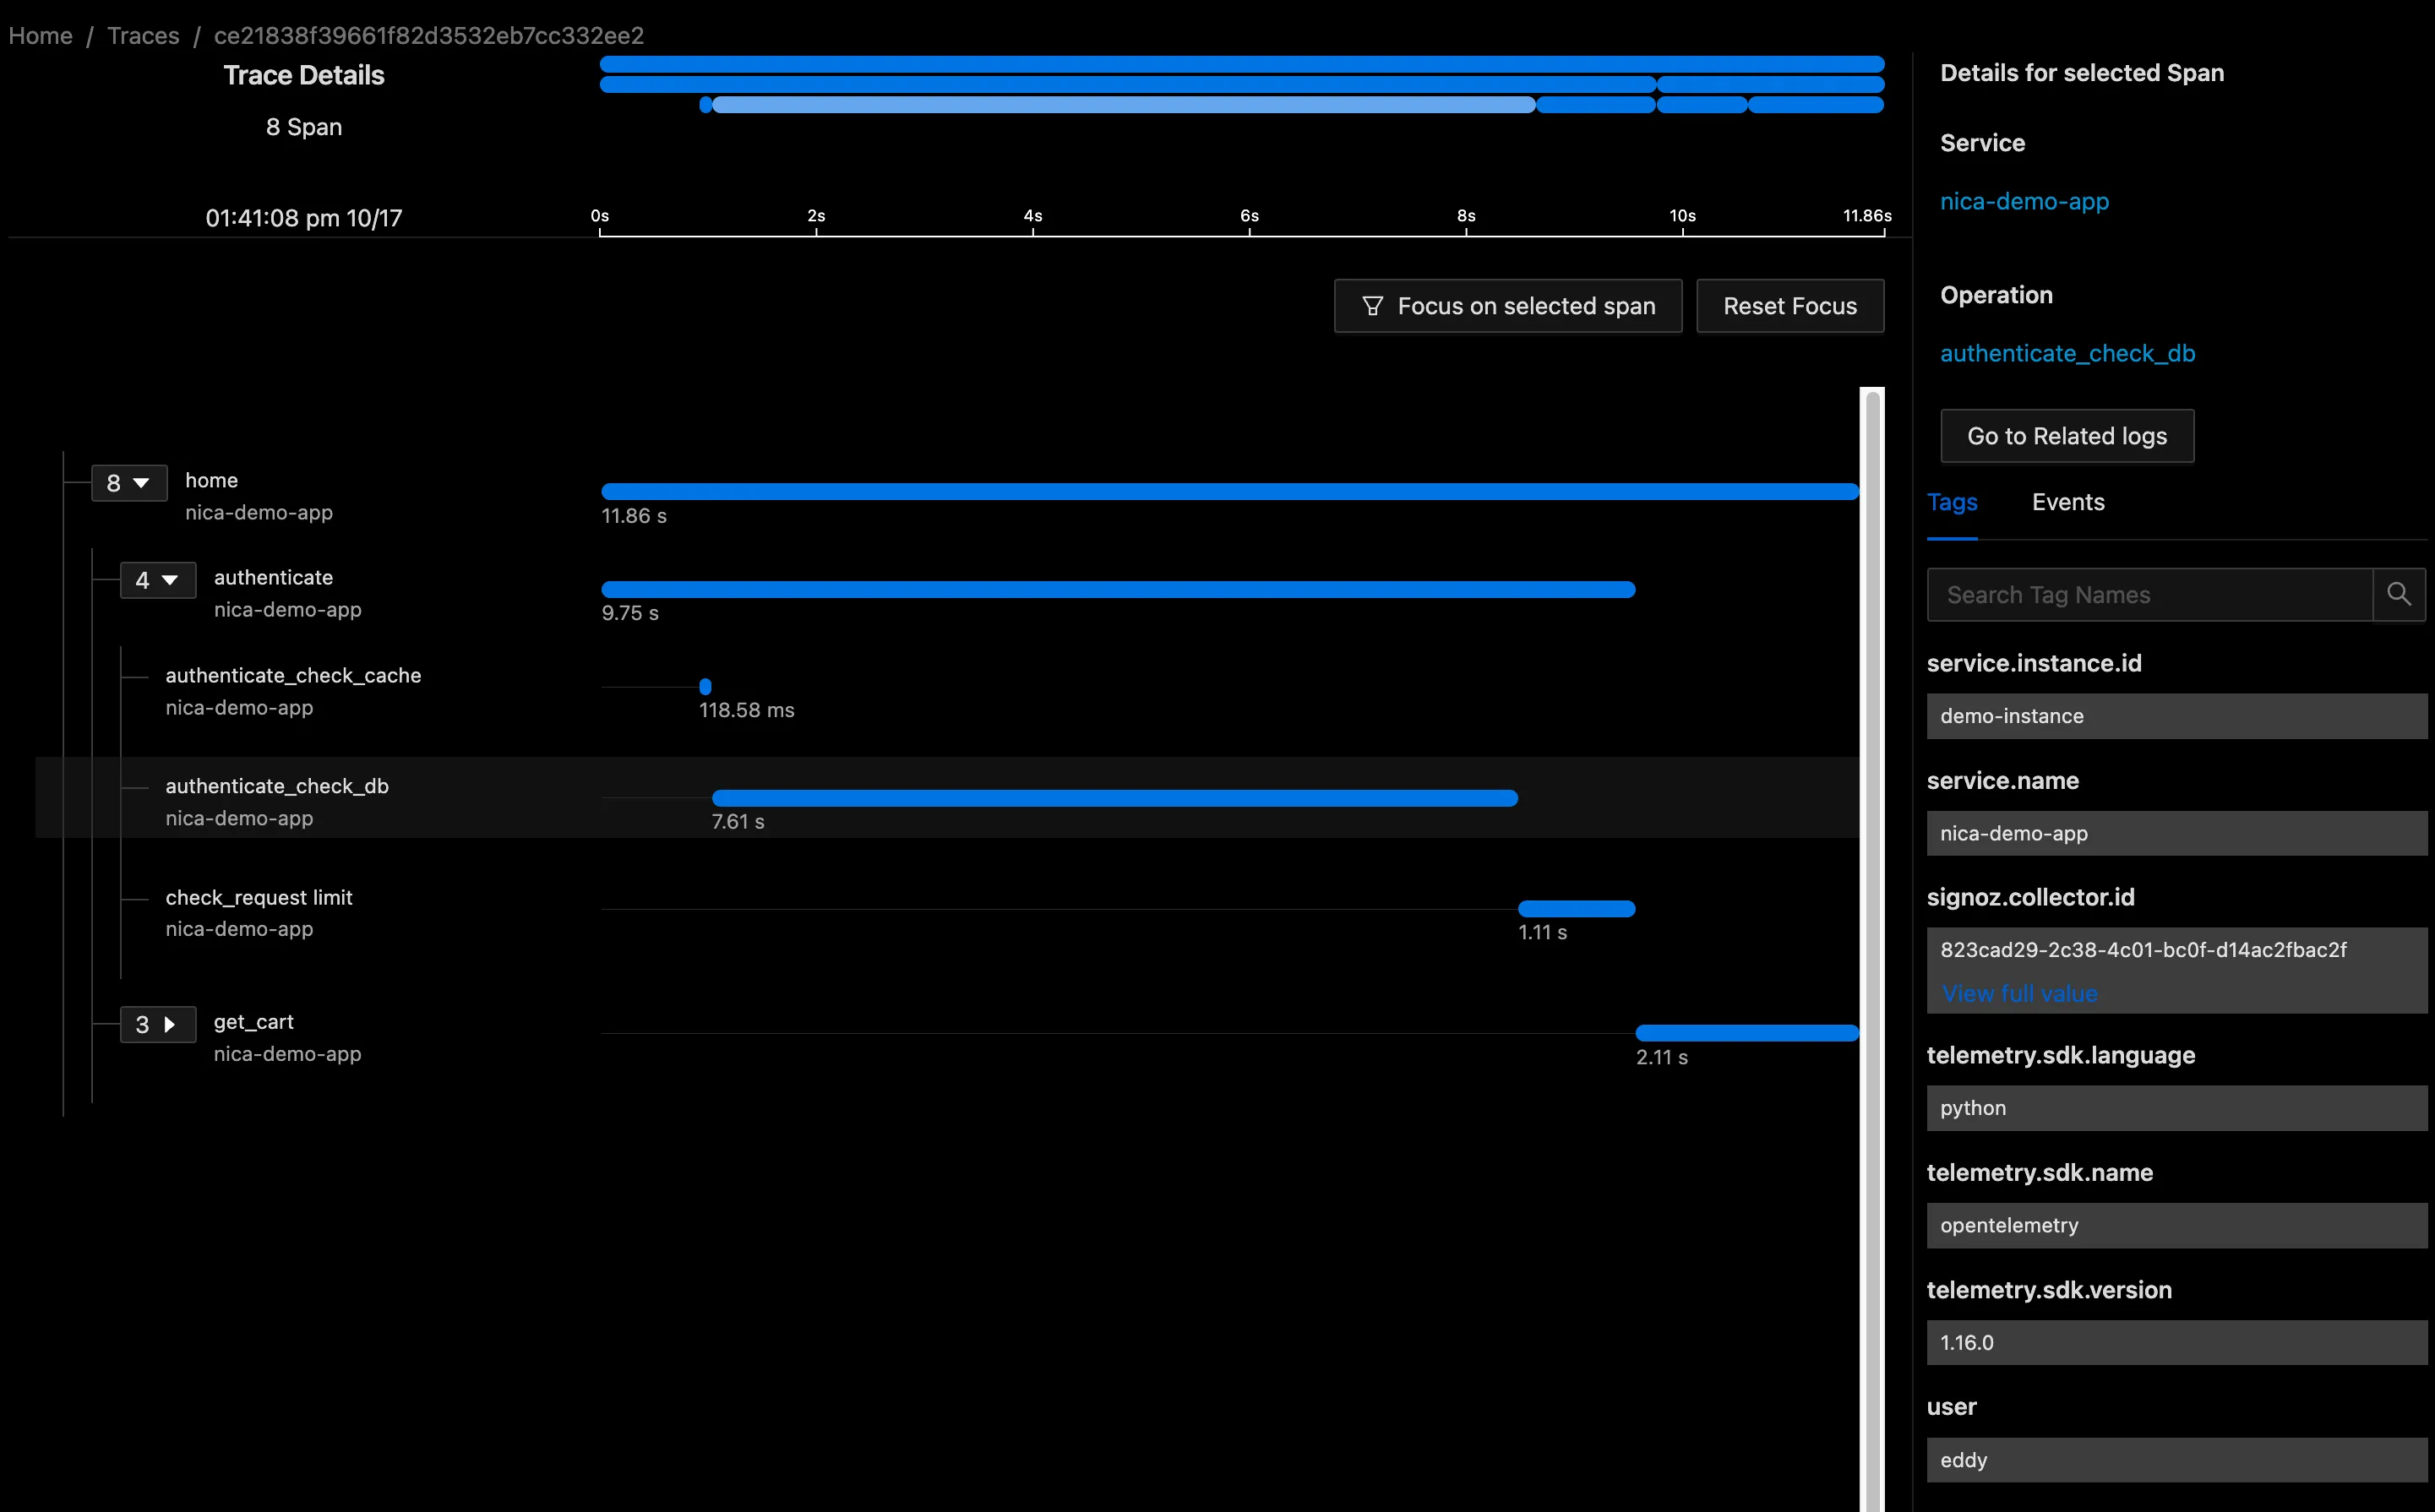
Now you finally see the code that, in our contrived example, slowed things downed if the user was named ‘eddy.’ With this child span in the problem becomes a lot clearer.
Conclusions: Observability is every developer’s responsibility
We wouldn’t think much of a Python backend engineer who never wrote tests. But observability, which is just as crucial for running reliable production software, has remained the domain of Operations engineers and SRE’s. In modern complex distributed systems, scalability and reliability are critical. Developers who assist SREs in adding observability features can contribute to building systems that scale effectively and remain reliable under various conditions.
