Best Axiom Observability Alternatives (2026) - Open Source & SaaS
TL;DR
- SigNoz provides unified observability with deployment flexibility. It is opentelemetry-native, covering logs, metrics, and traces, with out-of-the-box APM and infrastructure monitoring. You can self-host SigNoz for data control, or opt for the managed cloud service with predictable ingest pricing to avoid Axiom's compute-based pricing.
- Datadog provides 1,000+ integrations, RUM, synthetics, security, and Watchdog AI. But Datadog can be expensive at scale and does not offer self-hosting options.
- Sentry helps with error and crash monitoring, with features like session replay, release health, breadcrumbs, and deep code context. Some teams might find tracing complex.
Axiom is a popular choice for observability because of its serverless design and straightforward approach to logging with no sampling, no manual index management, just ingest your JSON data and go.
But as your usage grows, there are a few things to keep in mind. Axiom's pricing is usage-based (you only pay for what you actually consume), which means teams running frequent complex queries, large aggregations, or auto-refreshing dashboards can see compute costs climb quickly and sometimes unexpectedly.
In this guide, we'll explore additional limitations like those above and examine why teams look beyond Axiom. We will compare it with some top alternatives, evaluating them across three key areas: deployment flexibility (cloud-only versus self-hosted options), pricing predictability (how costs scale with usage), and feature breadth (core observability versus full-suite platforms).
Category 1: Open-Source and Self-Hosted Alternatives
The tools in this category offer cost control, deployment flexibility, and freedom from vendor lock-in. Teams can run observability on their own infrastructure, ensuring data privacy and customisation without relying on the cloud.
SigNoz
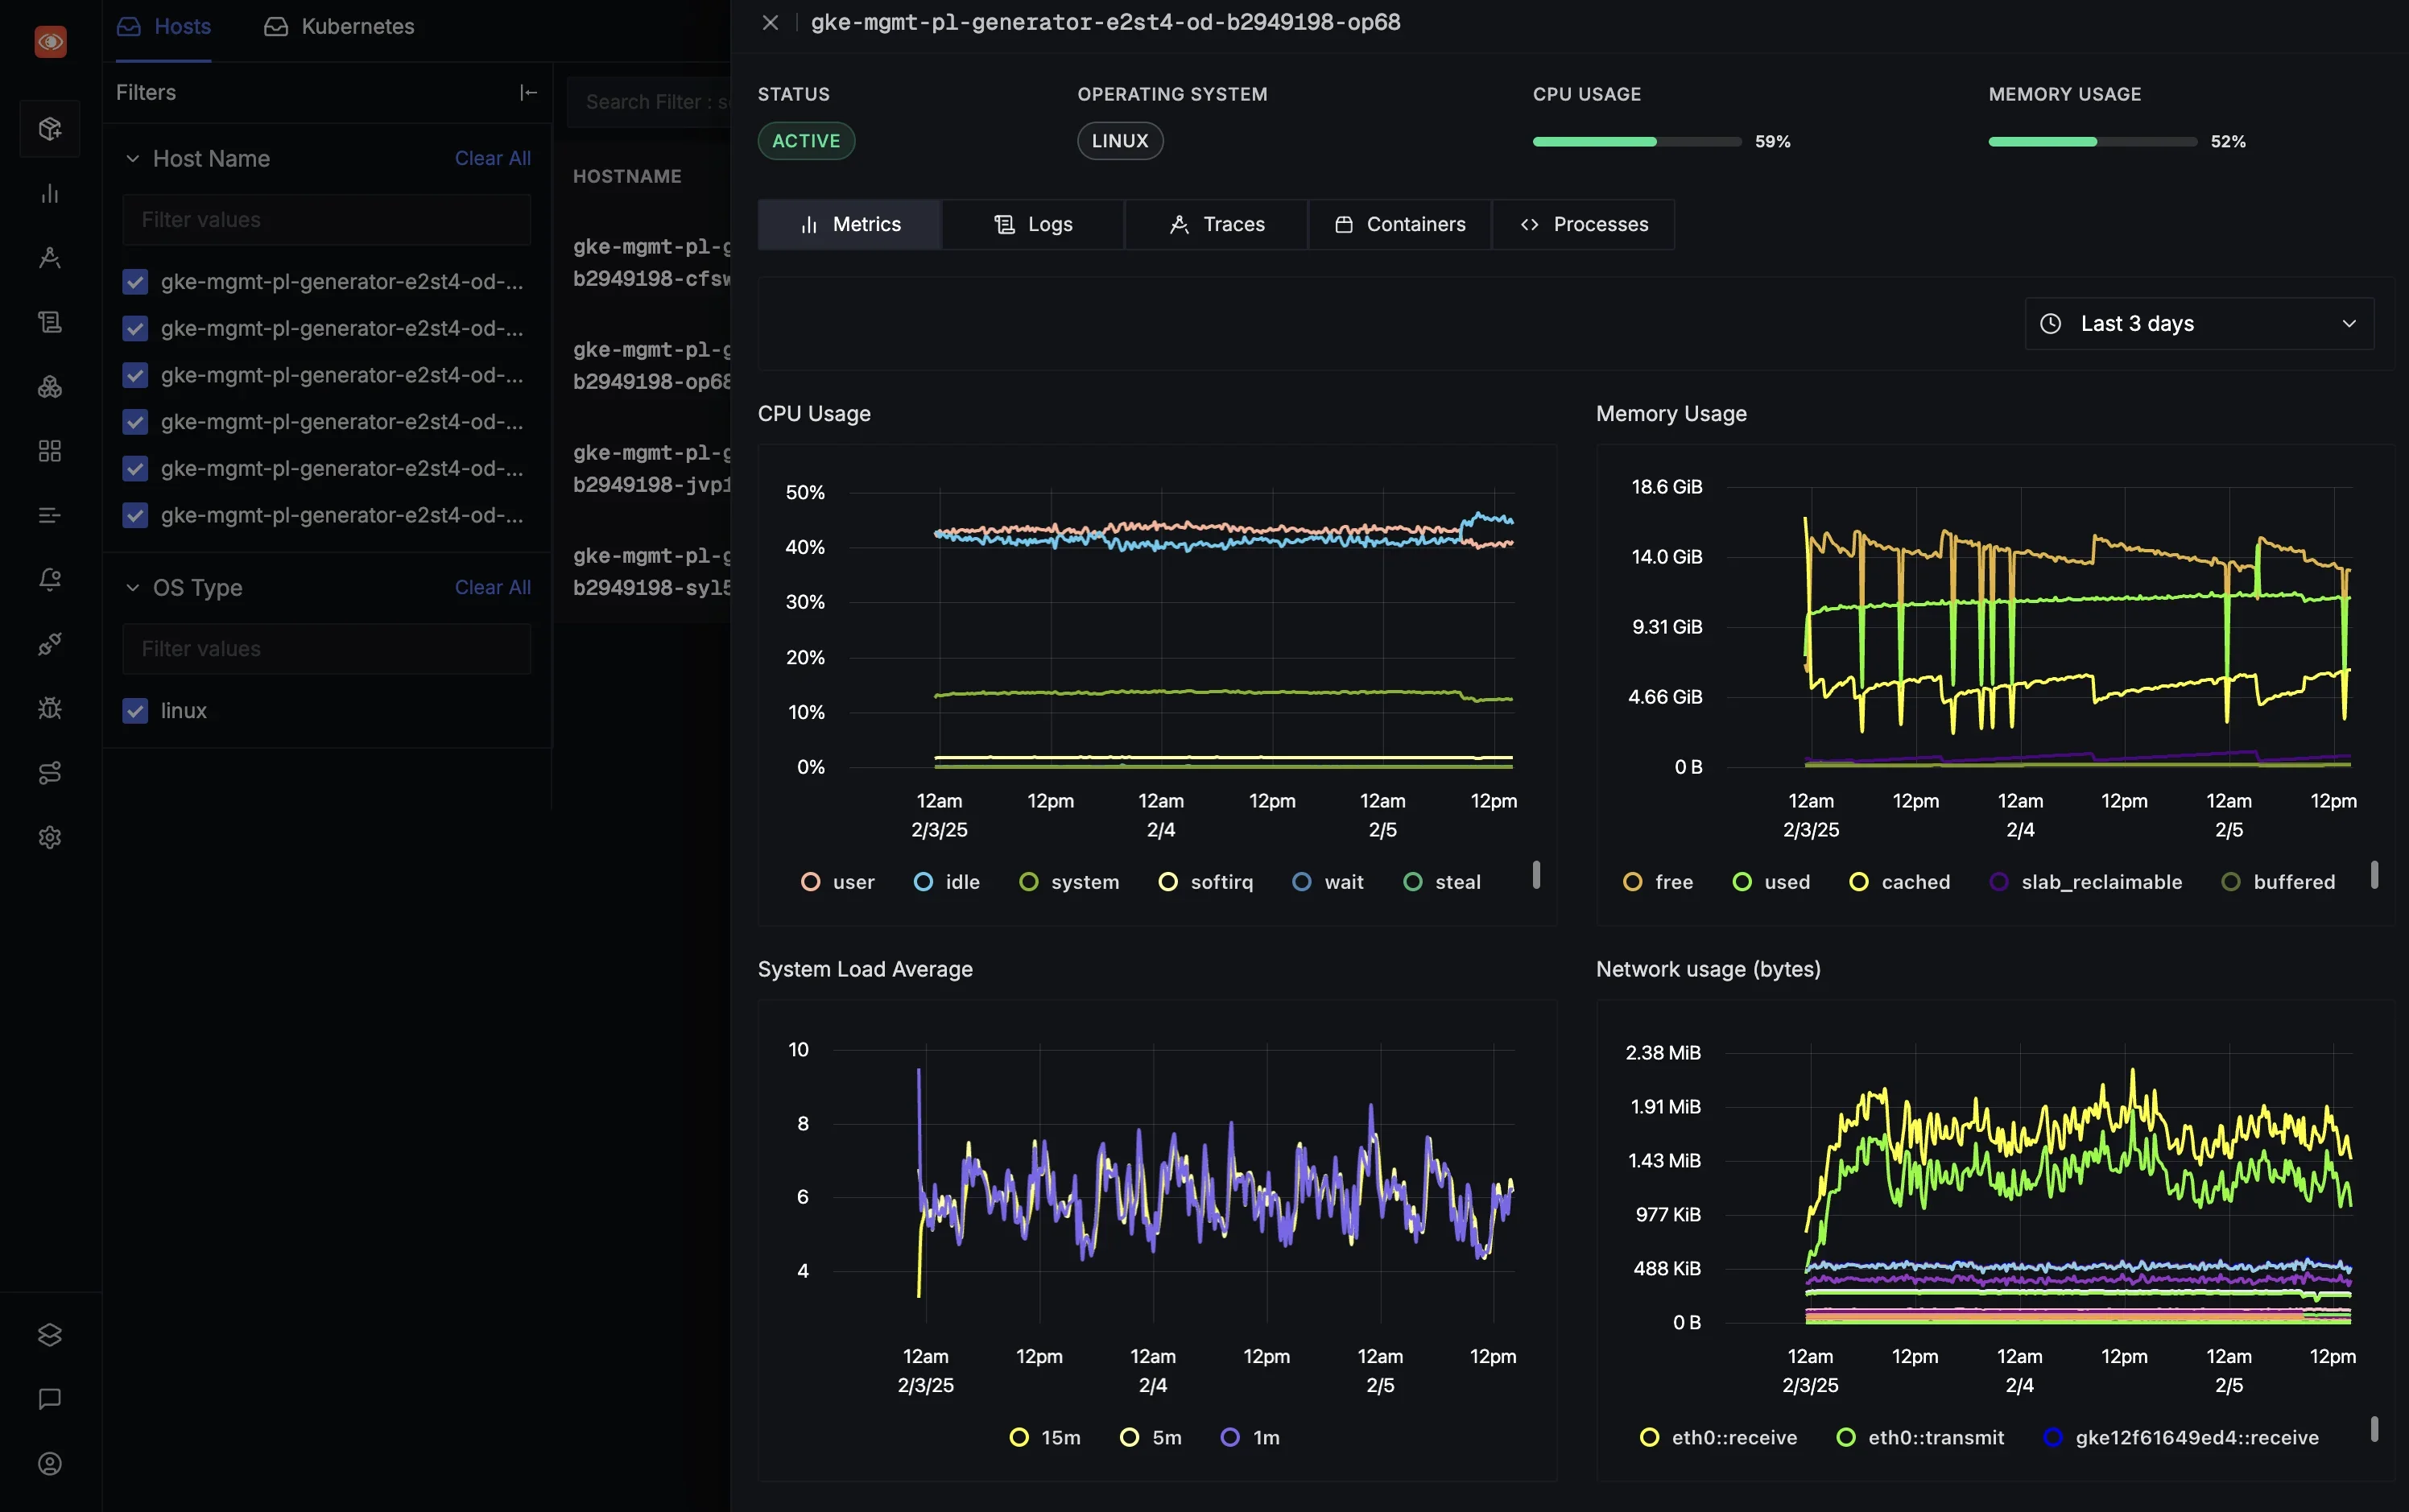
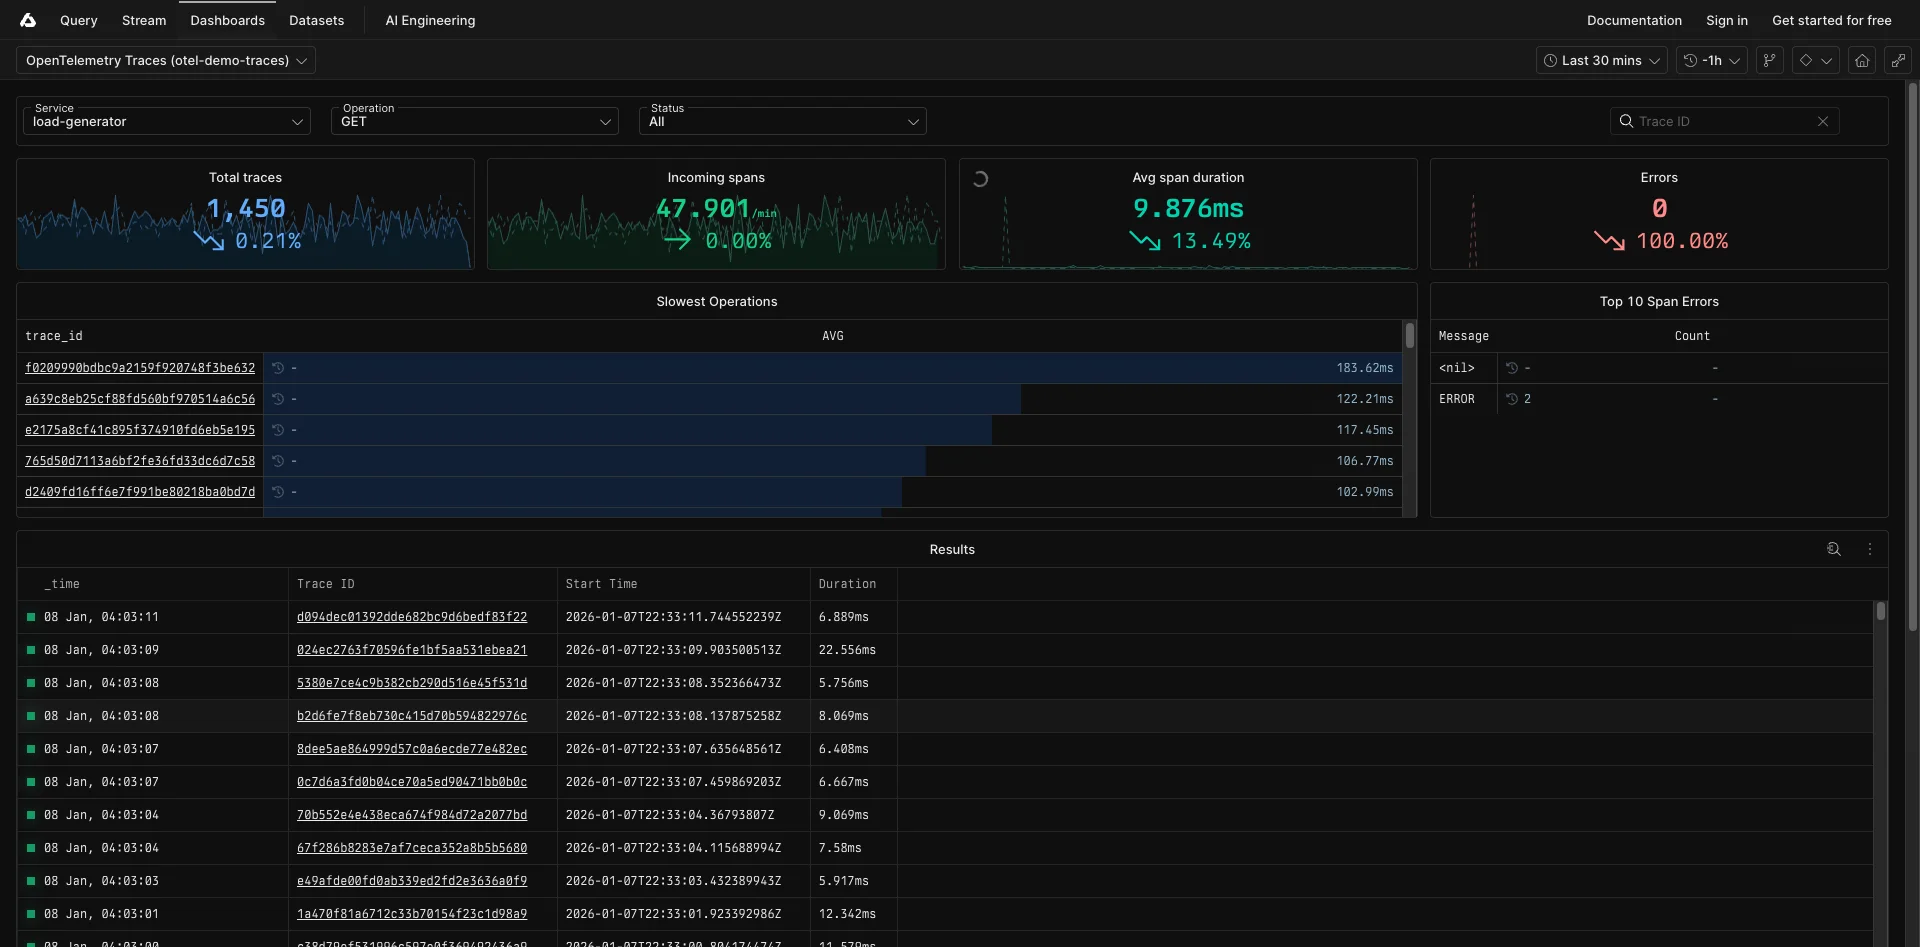
SigNoz is an all-in-one observability platform built on OpenTelemetry that unifies logs, metrics, traces, and infrastructure monitoring in a single tool. It emerged as a response to expensive proprietary tools, providing enterprise-grade features at no cost for self-hosting.
Key Features
- Unified Correlations: SigNoz enables seamless navigation from a log entry to related traces, metrics, or infrastructure details such as CPU usage, speeding up root-cause analysis by providing full context without switching tools.
- Columnar Storage: Leverages columnar database for fast aggregations and queries over billions of data points, making it ideal for high-volume environments where performance is critical.
- OTel-Native: Supports direct OTLP ingestion with native support for OpenTelemetry semantic conventions, allowing effortless data collection from diverse sources and simple migrations by just updating exporter endpoints.
Why consider SigNoz over Axiom?
SigNoz offers greater deployment flexibility than Axiom, with managed cloud for convenience or self-hosting options for data control, whereas Axiom is a managed SaaS (no self-hosted deployment), and it also offers a BYOB option for some customers where data can live in an S3-compatible bucket while Axiom runs ingestion/query compute.
For pricing, SigNoz offers a free open-source version or ingest-based cloud plans ($0.10 per million metric samples, $0.30 per GB for logs/traces), avoiding Axiom's variable query costs associated with heavy usage.
In feature breadth, SigNoz goes beyond Axiom's logs/traces core by adding built-in APM with RED metrics, anomaly-based alerts, and service maps for fuller observability. SigNoz also offers a collection of pre-built integrations and configurations for LLM observability, including guides for LangChain, LlamaIndex, OpenAI, and Anthropic.
Get Started with SigNoz
You can choose between various deployment options in SigNoz. The easiest way to get started with SigNoz is SigNoz Cloud. We offer a 30-day free trial account with access to all features.
Those with data privacy concerns who can’t send their data outside their infrastructure can sign up for either the enterprise self-hosted or BYOC offering.
Those with the expertise to manage SigNoz themselves, or who want to start with a free, self-hosted option, can use our community edition.
Grafana Stack (Loki + Tempo + Prometheus)
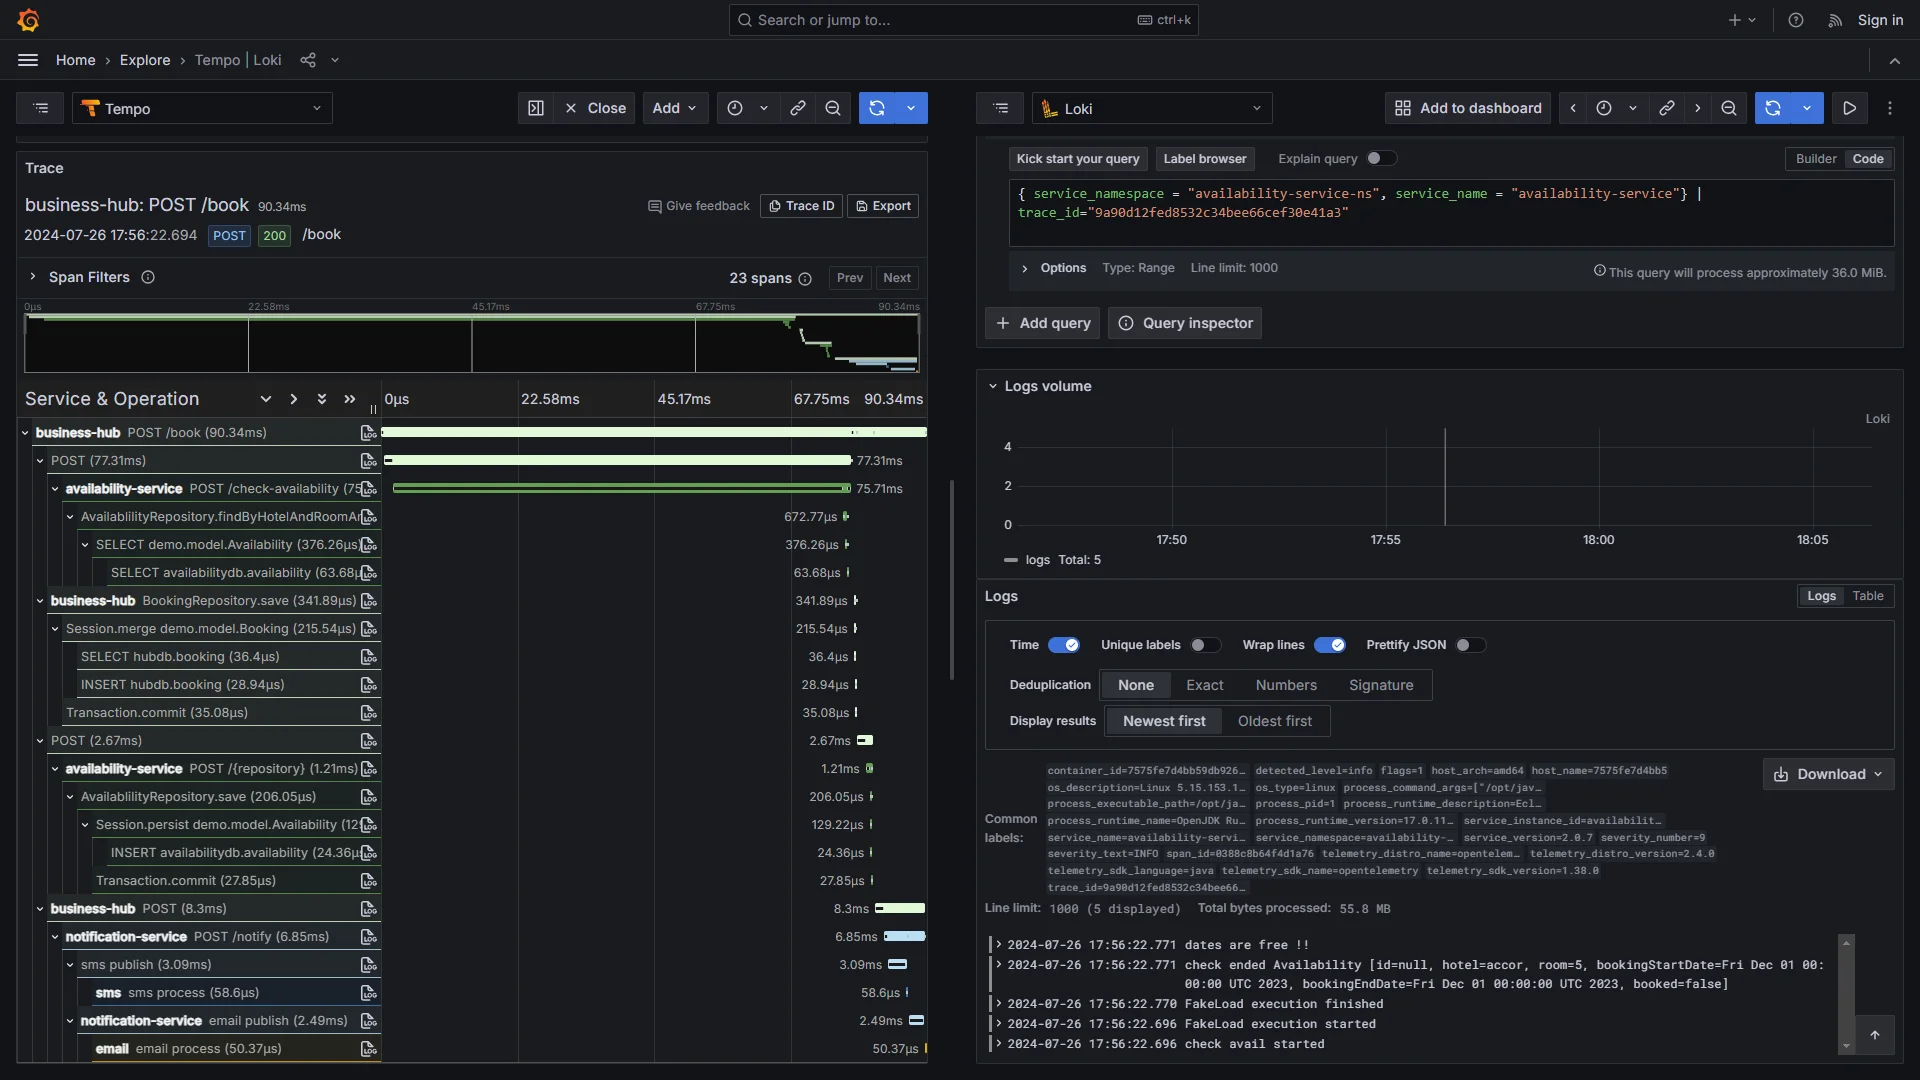
This modular open-source stack uses Loki for logs, Tempo for traces, and Prometheus for metrics, visualised in Grafana. It's a community-driven ecosystem that's highly extensible, popular for Kubernetes and cloud-native setups.
Key Features
- Efficient Indexing: Loki focuses on indexing metadata labels rather than full text, which minimises storage costs and enables handling massive log volumes affordably using object storage like S3.
- Custom Dashboards: Grafana's powerful visualisation tools let you create tailored panels that integrate logs, traces, and metrics, complete with alerting and plugins for advanced analytics.
Why consider Grafana Stack over Axiom?
Like SigNoz, Grafana Stack also offers deployment flexibility, with full self-hosting or managed cloud optionsenabling greater control over data residency and infrastructure. For pricing predictability, its open-source core is free with no query fees, while cloud plans charge based on data volume, offering more stability than Axiom's variable compute costs from intensive querying.
In feature breadth, it matches Axiom's core telemetry. Still, it extends to robust metrics monitoring (e.g., Prometheus for advanced time-series analysis) and modular APM integrations (plug-in components for app monitoring). However, it requires some assembly for a unified experience, providing greater customisation for metrics-heavy workflows.
Category 2: Full-Stack and Advanced SaaS Platforms
The platforms listed below offer comprehensive, enterprise-ready features with AI-powered insights designed for large-scale operations.
Datadog
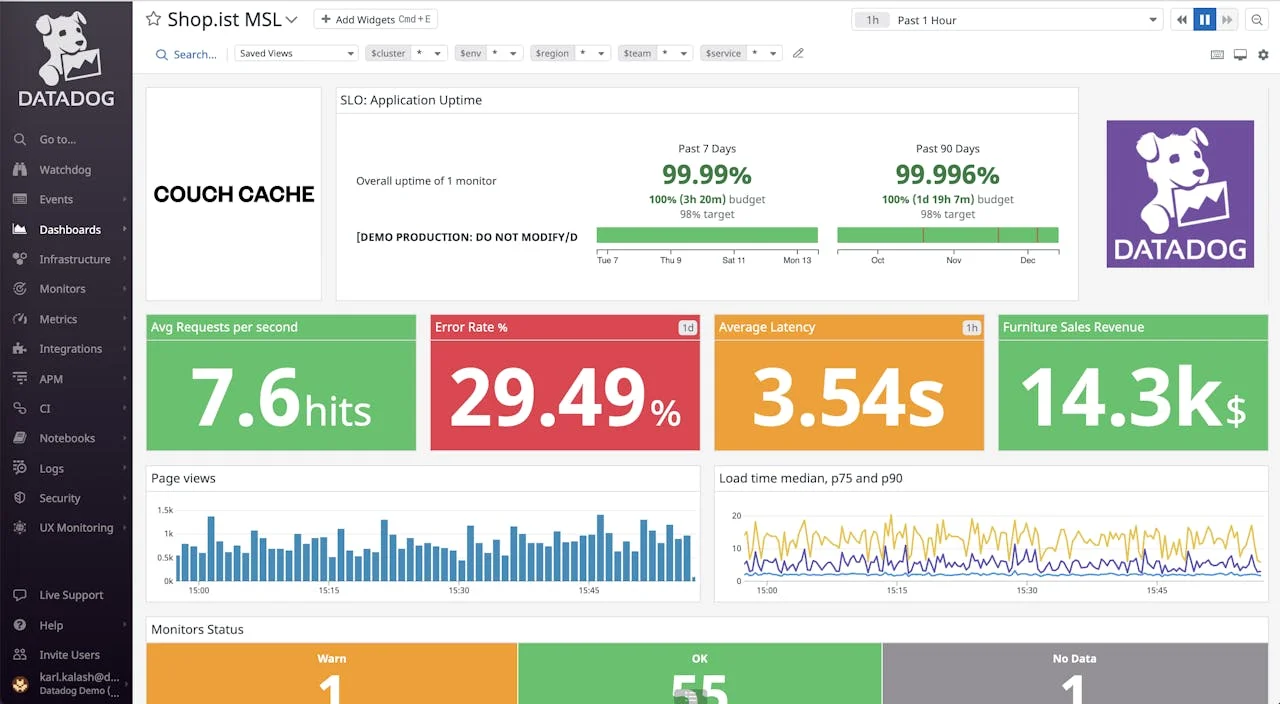
Datadog offers end-to-end observability with AI insights across infrastructure, APM, logs, and security. It's known for its extensive ecosystem, real-time monitoring capabilities, and seamless correlation of all telemetry signals in a single pane of glass.
Key Features
- 1000+ Integrations: Covers everything from clouds to databases, with auto-tagging that enriches data for faster correlations and pre-configured dashboards.
- AI Anomaly Detection: Uses machine learning to identify outliers across signals, alerting teams to issues before they impact users.
Why consider Datadog over Axiom?
Datadog offers greater feature breadth than Axiom, with a complete enterprise observability suite including 1,000+ integrations, RUM with session replay, synthetic monitoring, security tools, and Watchdog AI for automatic anomaly detection (all unified across metrics), logs, traces, and frontend signals, making it ideal for complex Kubernetes and multi-cloud environments.
For pricing, Datadog uses per-host, per-GB, and per-million-event models, which can run even higher than Axiom's usage-based model for some teams. For Datadog, you're not just paying for one thing; you're charged across various products, each with its own pricing metric, and this can lead to unpredictable bills that are difficult to forecast and control.
New Relic
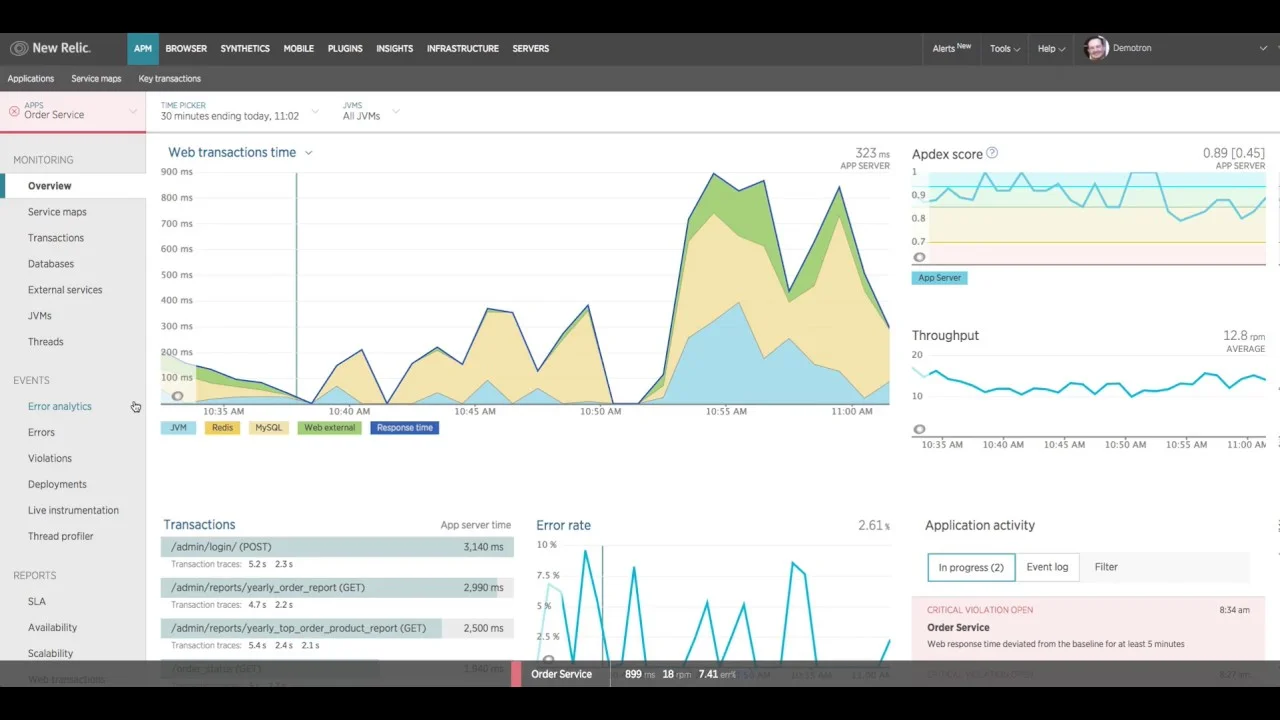
New Relic provides unified telemetry with deep APM, RUM, infrastructure monitoring, and AI-powered alerting for full-stack visibility. It emphasises developer productivity by connecting technical metrics directly to business outcomes, helping teams understand the real impact of performance issues.
Key Features
- Code-Level Insights: Continuous profiling, error tracking, and distributed tracing down to the exact line of code, enabling developers to pinpoint bottlenecks and resolve issues faster.
- Business Alignment: Integrates observability data with business KPIs (revenue, conversion rates, user journeys), allowing teams to correlate technical performance with business results.
- AI-Driven Incident Intelligence: Automatically groups related alerts, identifies root causes, and provides actionable recommendations, reducing mean time to resolution (MTTR).
- Full-Stack Coverage: Combines APM, infrastructure, browser monitoring (RUM), synthetics, logs, and serverless monitoring in one platform with a flexible, ingest-based pricing model.
Why consider New Relic over Axiom?
New Relic offers deployment through fully managed SaaS with no self-hosting options.
As of Jan 2026, pricing includes 100 GB of free ingest/month, then $0.40/GB beyond that (or $0.60/GB with Data Plus). User pricing depends on edition/user type (e.g., Core users $49/user/month, full platform users vary by edition). In terms of feature breadth, New Relic goes beyond Axiom's logs/traces core by adding built-in RUM, synthetic monitoring, code-level profiling, and AIOps for automatic anomaly detection, providing fuller observability.
Honeycomb
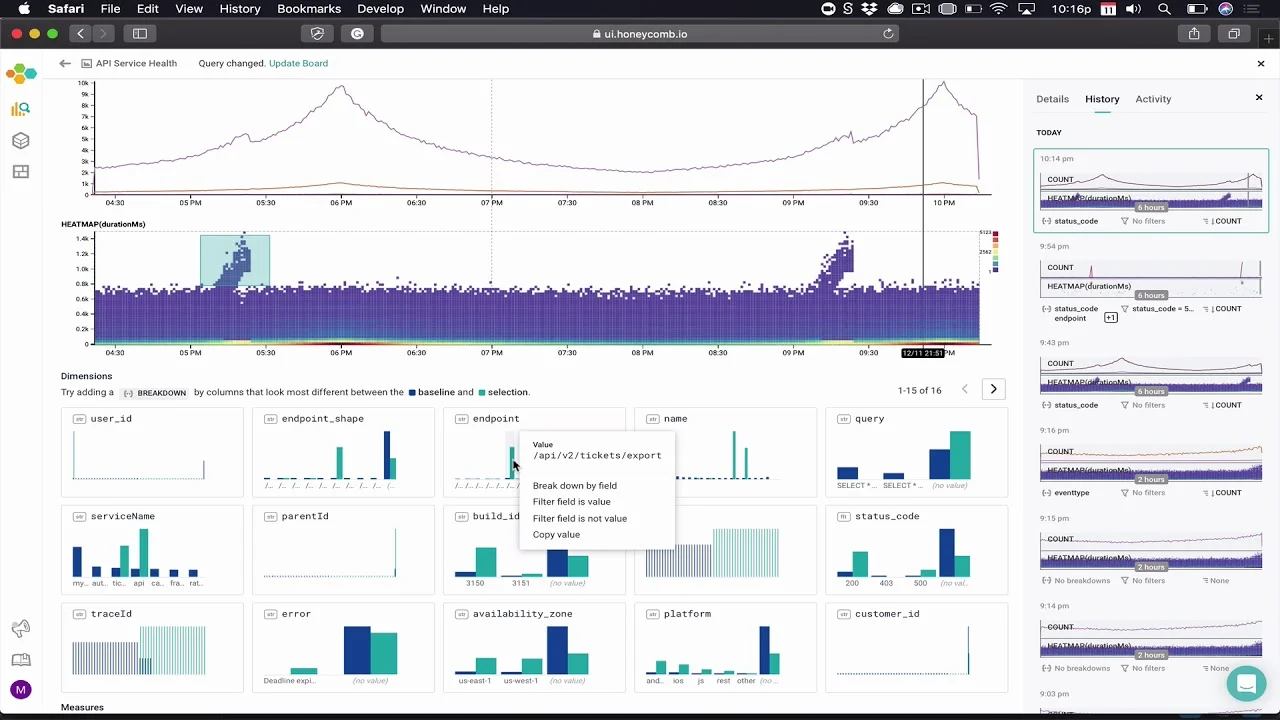
Honeycomb focuses on high-cardinality events for distributed tracing and debugging. It's designed for engineering teams working with complex, event-driven systems such as microservices.
Key Features
- BubbleUp: Automatically detects key attribute differences between good and bad requests, accelerating outlier identification and troubleshooting.
- Sub-Second Queries: Delivers rapid responses even on massive datasets and supports full fidelity, though sampling is available for cost management.
- Honeycomb Intelligence (AI Suite): Includes Canvas (AI-assisted copilot), anomaly detection, and MCP for integrating with external AI agents.
Why consider Honeycomb over Axiom?
Honeycomb offers specialised high-cardinality debugging and advanced exploration features for distributed systems, whereas Axiom focuses on structured event analysis. For pricing, it uses event-based billing (Free tier with limits, Pro/Enterprise volume-based rates with burst protection), avoiding Axiom's variable query costs, though scaling with event volume. In feature breadth, Honeycomb goes beyond Axiom's logs/traces core by adding BubbleUp for visual anomaly detection, unlimited querying, SLOs, service maps, and full OpenTelemetry support for comprehensive observability.
Category 3: Error-Focused Tools
Popular for small teams or solo devs, emphasising ease and error monitoring without full complexity. These prioritise quick setup and targeted debugging over broad observability.
Better Stack
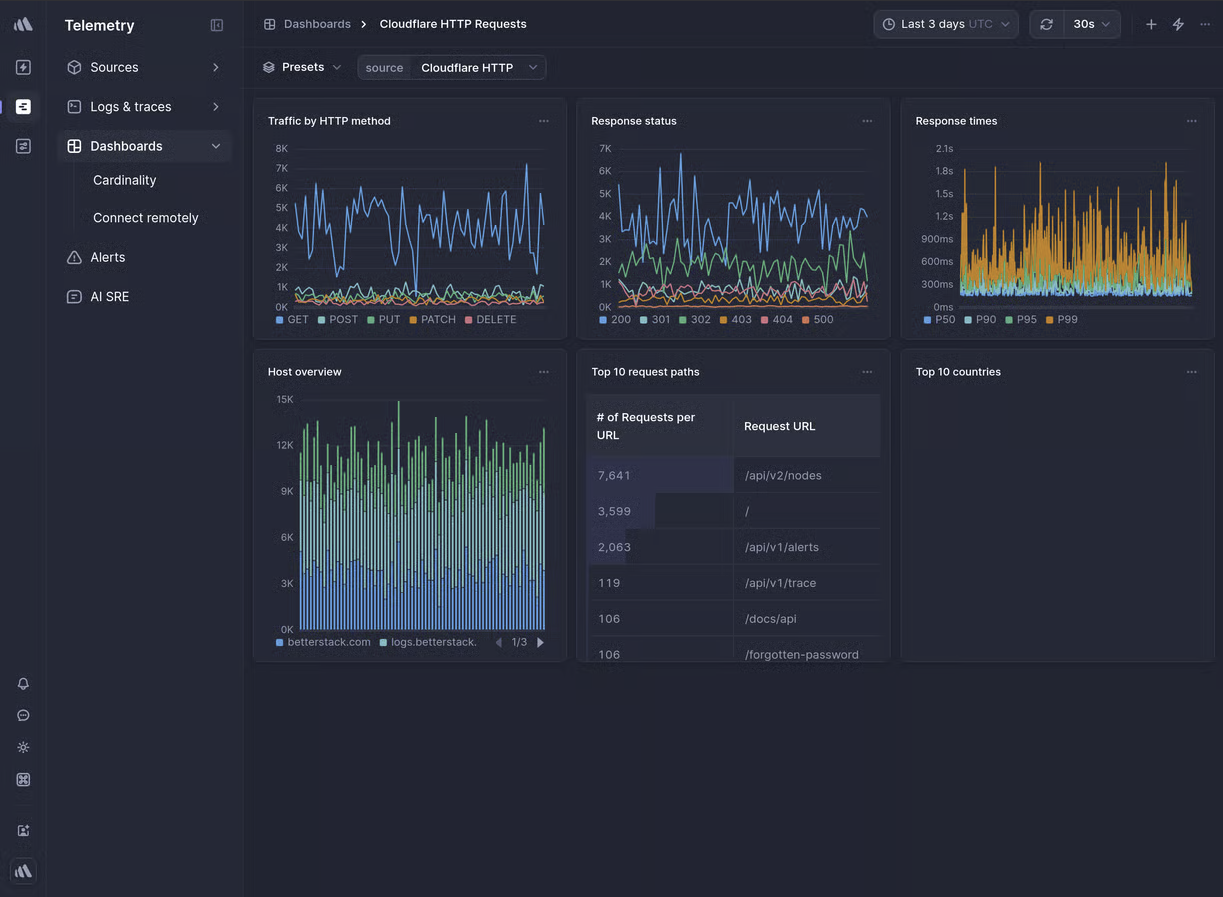
Better Stack is a modern, developer-friendly observability platform that combines logs, metrics, tracing, uptime monitoring, and incident management in a clean, straightforward interface for teams seeking simplicity and rapid value.
Key Features
- Standard SQL Queries: Use familiar SQL for powerful log exploration and dashboard creation, eliminating the need for proprietary languages.
- Built-in Incident Tools: Seamless alerting, on-call scheduling, status pages, and incident linking for faster resolution.
- Pre-Built Integrations & Dashboards: Instant templates for common stacks (e.g., Kubernetes, Rails) and over 100+ integrations for quick setup.
Why consider Better Stack over Axiom?
Better Stack offers greater simplicity than Axiom, with fully managed SaaS and exceptional developer experience for fast onboarding, versus Axiom's more complex tooling. Pricing includes a generous free tier and affordable plans starting at ~$29/month as of Jan 2026, with transparent ingest-based billing that avoids Axiom's variable query costs associated with heavy usage. In feature breadth, Better Stack goes beyond Axiom's logs/traces core by adding beautiful pre-built dashboards, standard SQL querying, integrated uptime/incident management, and collaborative tools for streamlined observability.
Sentry
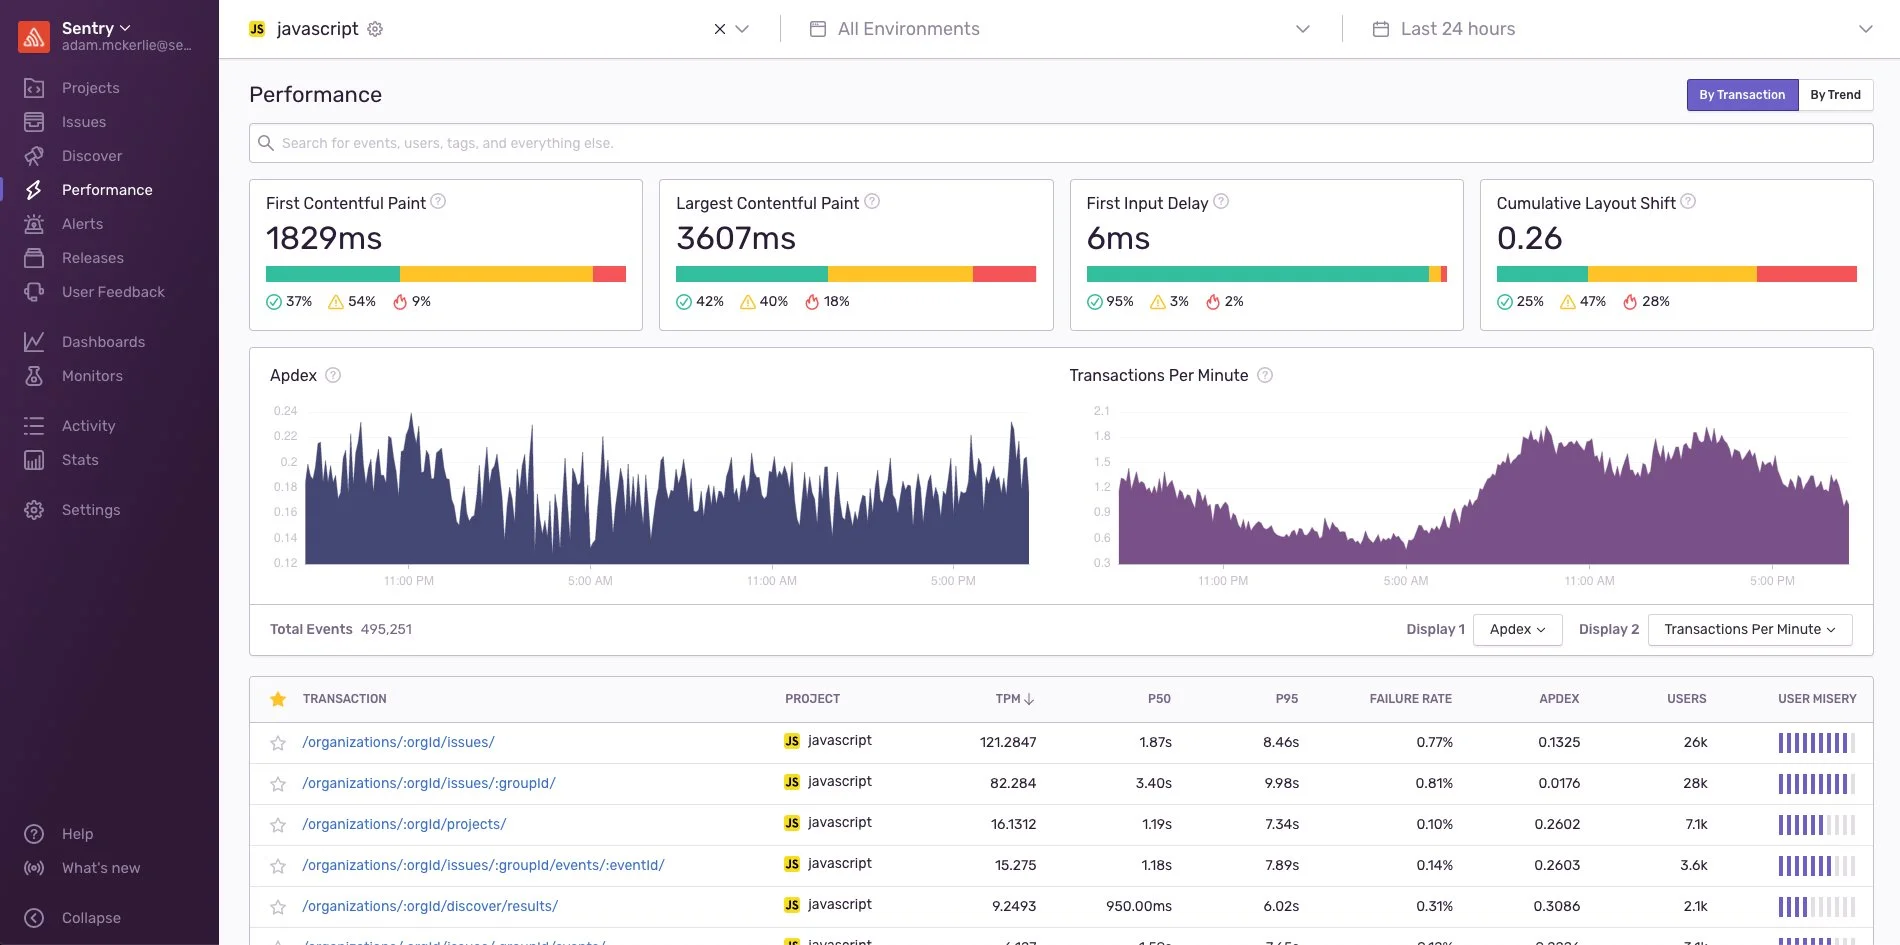
Sentry specialises in error monitoring with breadcrumbs, sessions, and performance tracing. Originally for crash reporting, it has evolved into a robust tool for application health.
Key Features
- Release Health: Tracks error rates, performance regressions, and user impact across software versions for safer deployments.
- Breadcrumbs & Context: Captures event sequences, stack traces, and user actions leading to errors for reproducible debugging.
- Session Replay: Visually replay user sessions to see exactly what led to crashes or issues (with privacy controls).
Why consider Sentry over Axiom?
Sentry offers greater specialisation than Axiom, available as Sentry Cloud (SaaS) and as an official self-hosted distribution (with caveats such as no dedicated support and resource requirements, e.g., min 4 CPU/16GB RAM), focused on error and performance debugging for code health, versus Axiom's broader log analytics.
For pricing, it uses event-based billing (generous free tier plus pay-as-you-go with reserves), avoiding Axiom's variable compute costs associated with heavy usage. In feature breadth, Sentry goes beyond Axiom by adding session replay, release tracking, frontend/backend performance monitoring, and deep error context for superior debugging workflows.
Summary: Top Axiom Alternatives
| Tool | Core Focus | Key Advantages Over Axiom |
|---|---|---|
| SigNoz | All-in-one OTel Native Unifies logs, metrics, traces, and infra in a single tool. | Offers self-hosting for data control and includes built-inAPM features(RED metrics, service maps) that Axiom lacks. |
| Grafana Stack | Modular Ecosystem Community-driven stack (Loki, Tempo, Prometheus). | Superior data residency control via self-hosting and strongermetrics capabilities(PromQL) compared to Axiom’s log focus. |
| Datadog | End-to-End Observability Massive ecosystem with AI-powered insights. | More features (Security, Synthetic, RUM) and ecosystem integrations compared to Axiom. |
| New Relic | Full-Stack & Business Connects telemetry to business outcomes. | Offers code-level profiling, synthetic monitoring, and business KPI linking, providing deeper context than Axiom. |
| Honeycomb | High-Cardinality Debugging Designed for complex, distributed systems. | Features Service Maps and SLO, go beyond Axiom’s structured event analysis. |
| Better Stack | Developer SimplicityC ombines monitoring with incident management. | Significantly easier setup/DX, includes incident management tools (on-call/status pages), and supports standard SQL. |
| Sentry | Code Health & Errors Specialised in crash reporting and performance. | Deep code-level debugging, frontend performance monitoring, and Session Replay capabilities that Axiom does not offer. |
Hope we answered all your questions about the axiom alternatives. If you have more questions, feel free to use the SigNoz AI chatbot or join our Slack community.
You can also subscribe to our newsletter for insights from observability nerds at SigNoz, and get open-source, OpenTelemetry, and devtool-building stories straight to your inbox.
