Best Frontend Cloud Logging Tools: Top 6 Compared [2026]
You're sitting at your desk when Slack explodes with messages. Production is down. Users are reporting a critical error that only happens for 1% of users, only on Safari, only when they're using dark mode on mobile devices. Your backend logs show nothing. The error is somewhere in your 500KB minified JavaScript bundle, and you have exactly zero visibility into what's happening.
Sound familiar?
If you've ever tried debugging production JavaScript errors with just console.log and user screenshots, you know the pain. Modern web applications run complex code across thousands of different browser environments, device types, and network conditions. When something breaks, finding the root cause without proper frontend logging is like performing surgery in the dark.
The good news? Frontend logging tools have evolved far beyond simple error catchers. In this guide, we've tested and analyzed 6 leading frontend logging tools with real NextJS applications. Whether you're a startup watching every dollar or an enterprise needing bulletproof observability, you'll find exactly what you need to make an informed decision.
How We Evaluated These Tools
Before diving into the tools, let's be transparent about our testing methodology. We used a NextJS sample application with intentional errors (undefined variables, failed API calls, slow rendering) and implemented each tool to measure real-world performance. Our evaluation focused on Setup Complexity, Error Capture Quality, Performance Impact, Privacy Controls, Pricing Reality, and Framework Support.
One important note: we focused on cloud solutions rather than self-hosted options in this article, if you are looking exclusively for the open source tools list, please read our article on 10 Best Open Source Log Management Tools
The Top 6 Frontend Logging Tools Analyzed
Tool #1: Sentry - The Developer-First Error Tracker
If GitHub stars determined logging tools, Sentry would win by a landslide. With over 40,000 stars and a massive community, Sentry has become the de facto standard for error tracking among developers.
What Makes Sentry Stand Out:
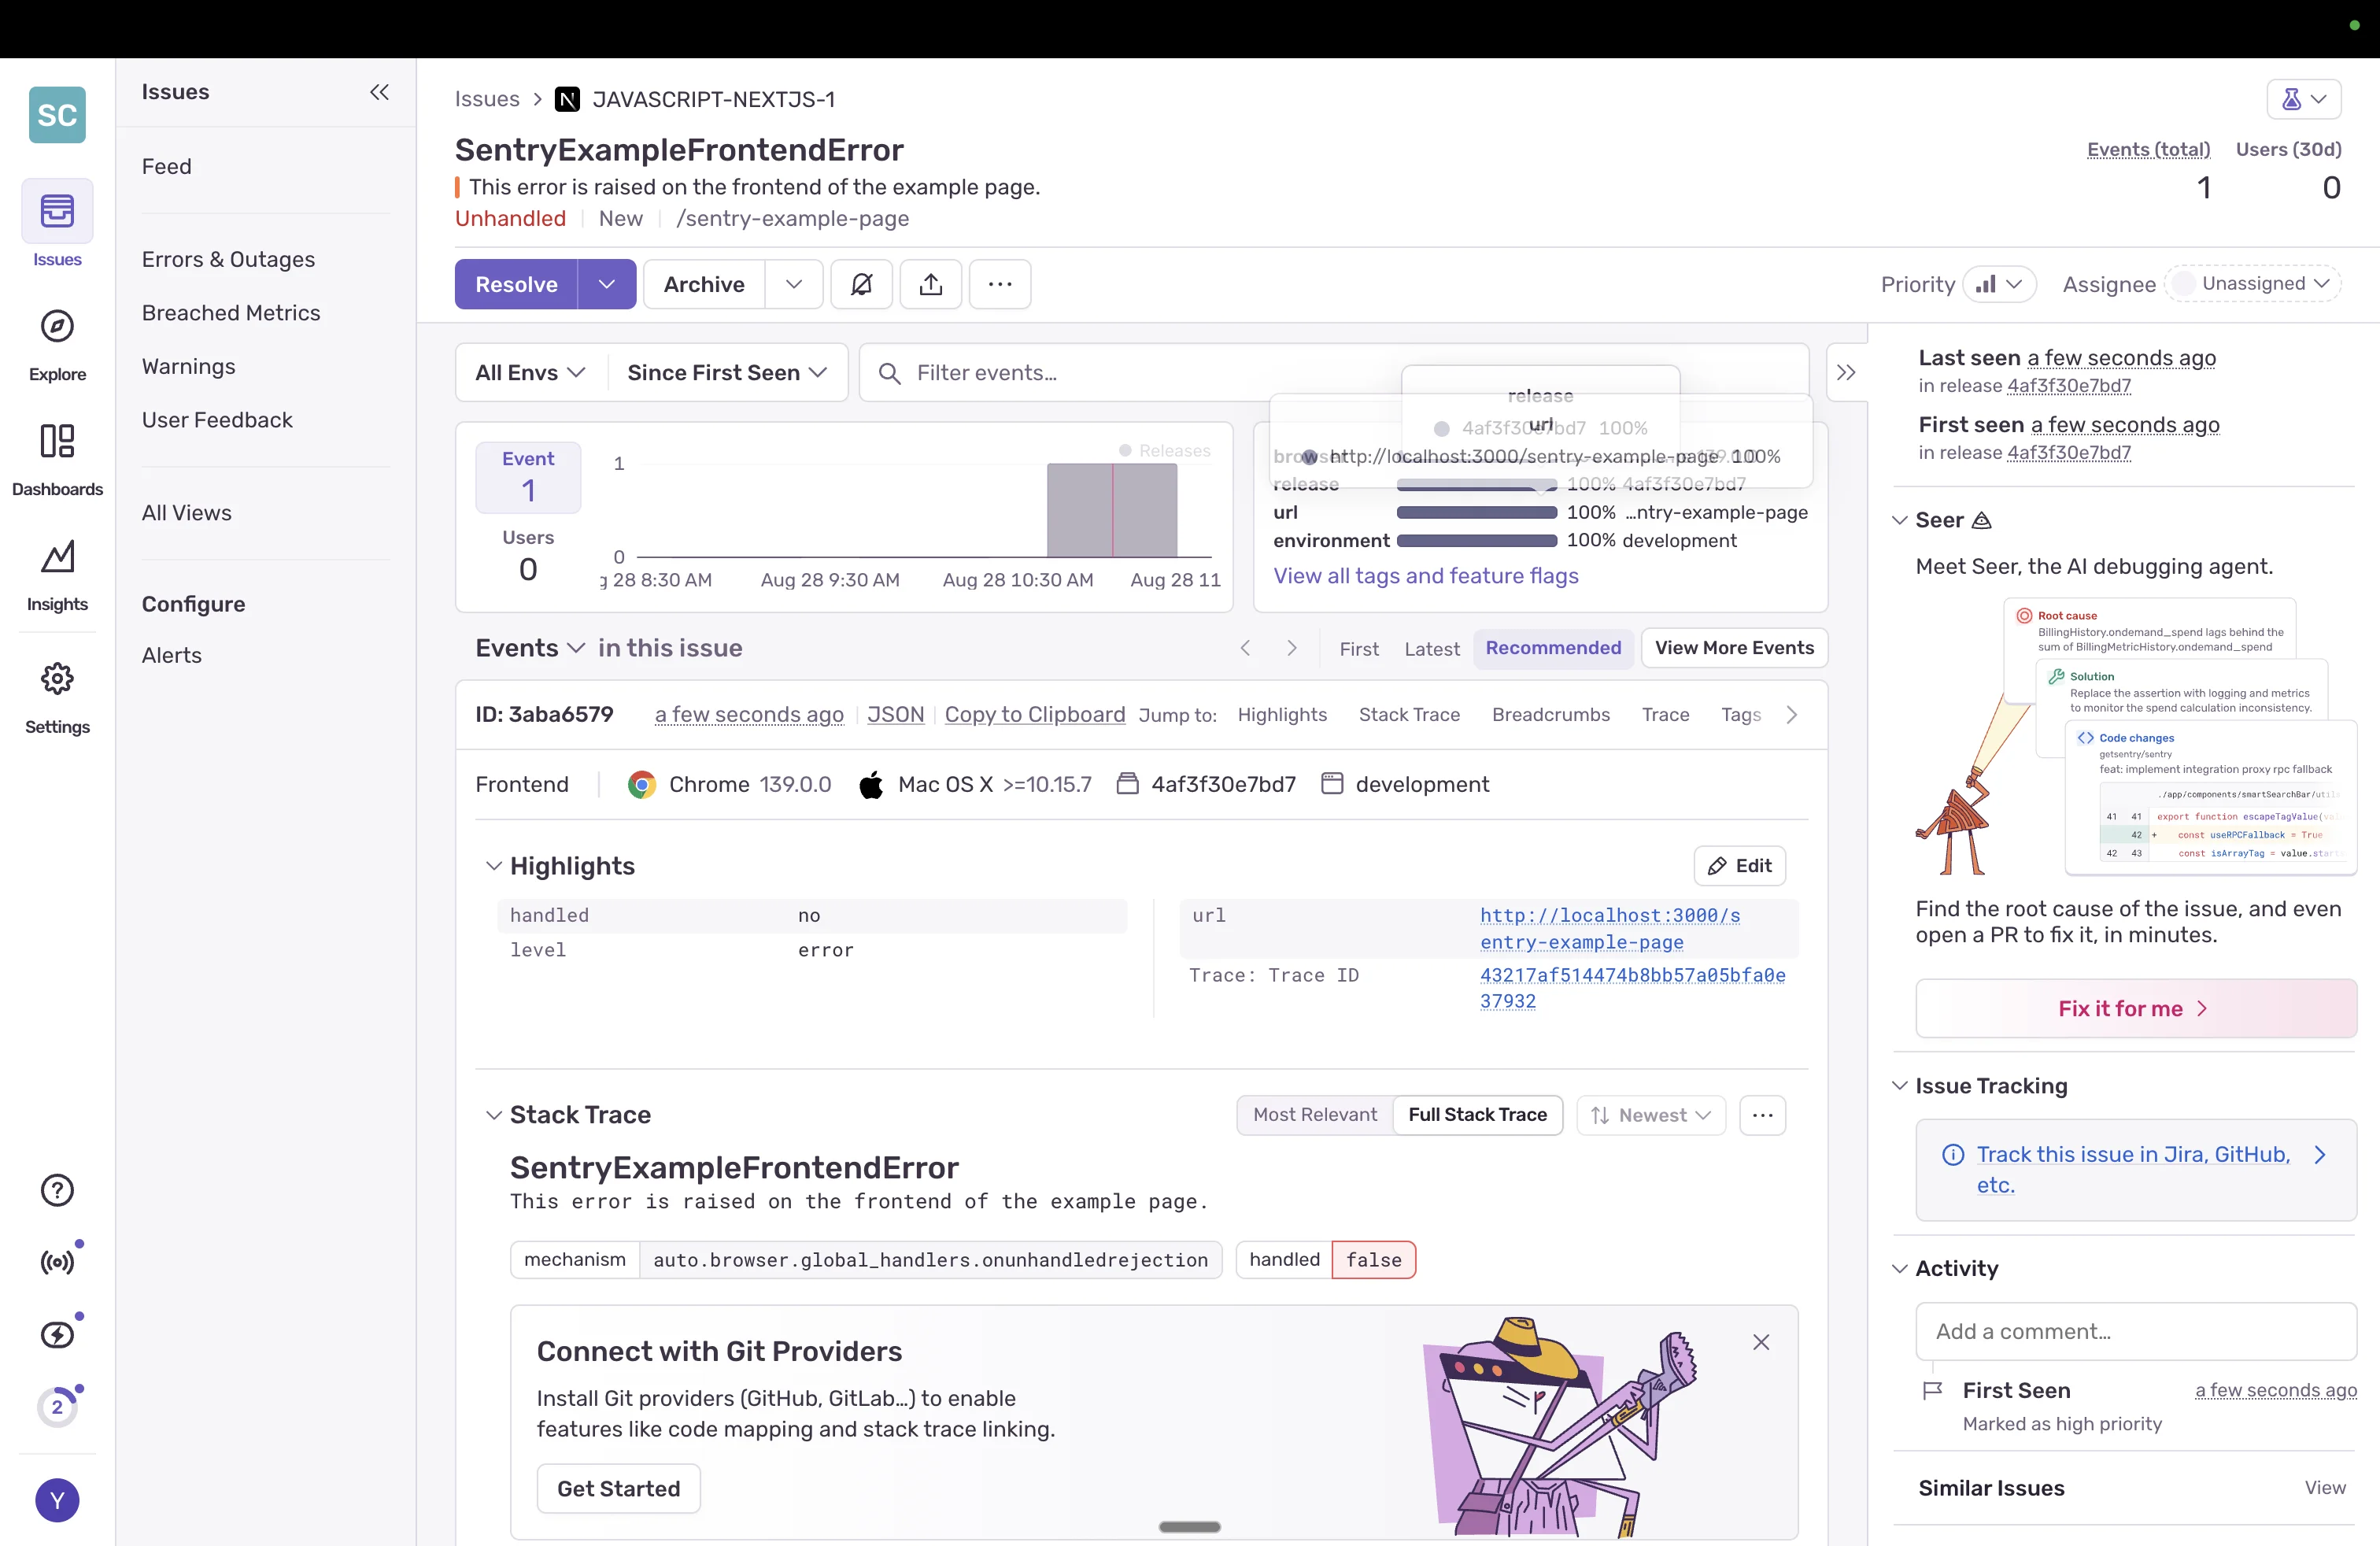
Sentry's intelligent error grouping is its killer feature. Instead of drowning in duplicate errors, Sentry automatically groups similar errors together, showing you the unique issues affecting your users. The breadcrumb trail feature captures the exact sequence of events leading to an error, including console logs, network requests, and user interactions.
The session replay feature, while newer than competitors, integrates seamlessly with error reports. When an error occurs, you can watch exactly what the user did, with privacy controls to mask sensitive data.
Real Implementation Experience:
Setting up Sentry took just 8 minutes from signup to first error captured. The wizard automatically detected our NextJS project and provided copy-paste configuration. Within minutes, we had errors flowing in with full stack traces and logs.
This is how the key implemenation part of sentry looks like:
// NextJS implementation with Sentry
import * as Sentry from "@sentry/nextjs";

Sentry.init({
  dsn: "YOUR_DSN_HERE",
  tracesSampleRate: 1.0,
  replaysSessionSampleRate: 0.1,
  replaysOnErrorSampleRate: 1.0,
  integrations: [
    new Sentry.Replay({
      maskAllText: true,
      blockAllMedia: true,
    }),
  ],
});
Pros:
- Generous free tier (50,000 errors/month, 50 replays)
- Excellent developer experience with 100+ SDK integrations
- Strong open-source community and self-hosted option
- Native performance monitoring with Web Vitals
- New native logging features (Sentry.logger API)
Cons:
- Complex pricing at scale (multiple meters for errors, replays, performance)
- Can be overwhelming for simple logging needs
- Session replay still maturing compared to specialized tools
- Performance monitoring adds significant bundle size
Pricing Reality Check:
- 1K users: Free tier covers most needs
- 10K users: ~$29-79/month depending on error volume
- 100K users: $200-500+/month with performance monitoring
Tool #2: LogRocket - The Session Replay Pioneer
LogRocket takes a different approach: instead of just logging errors, it records everything. Think of it as having a screen recorder for every user session, but with developer tools attached.
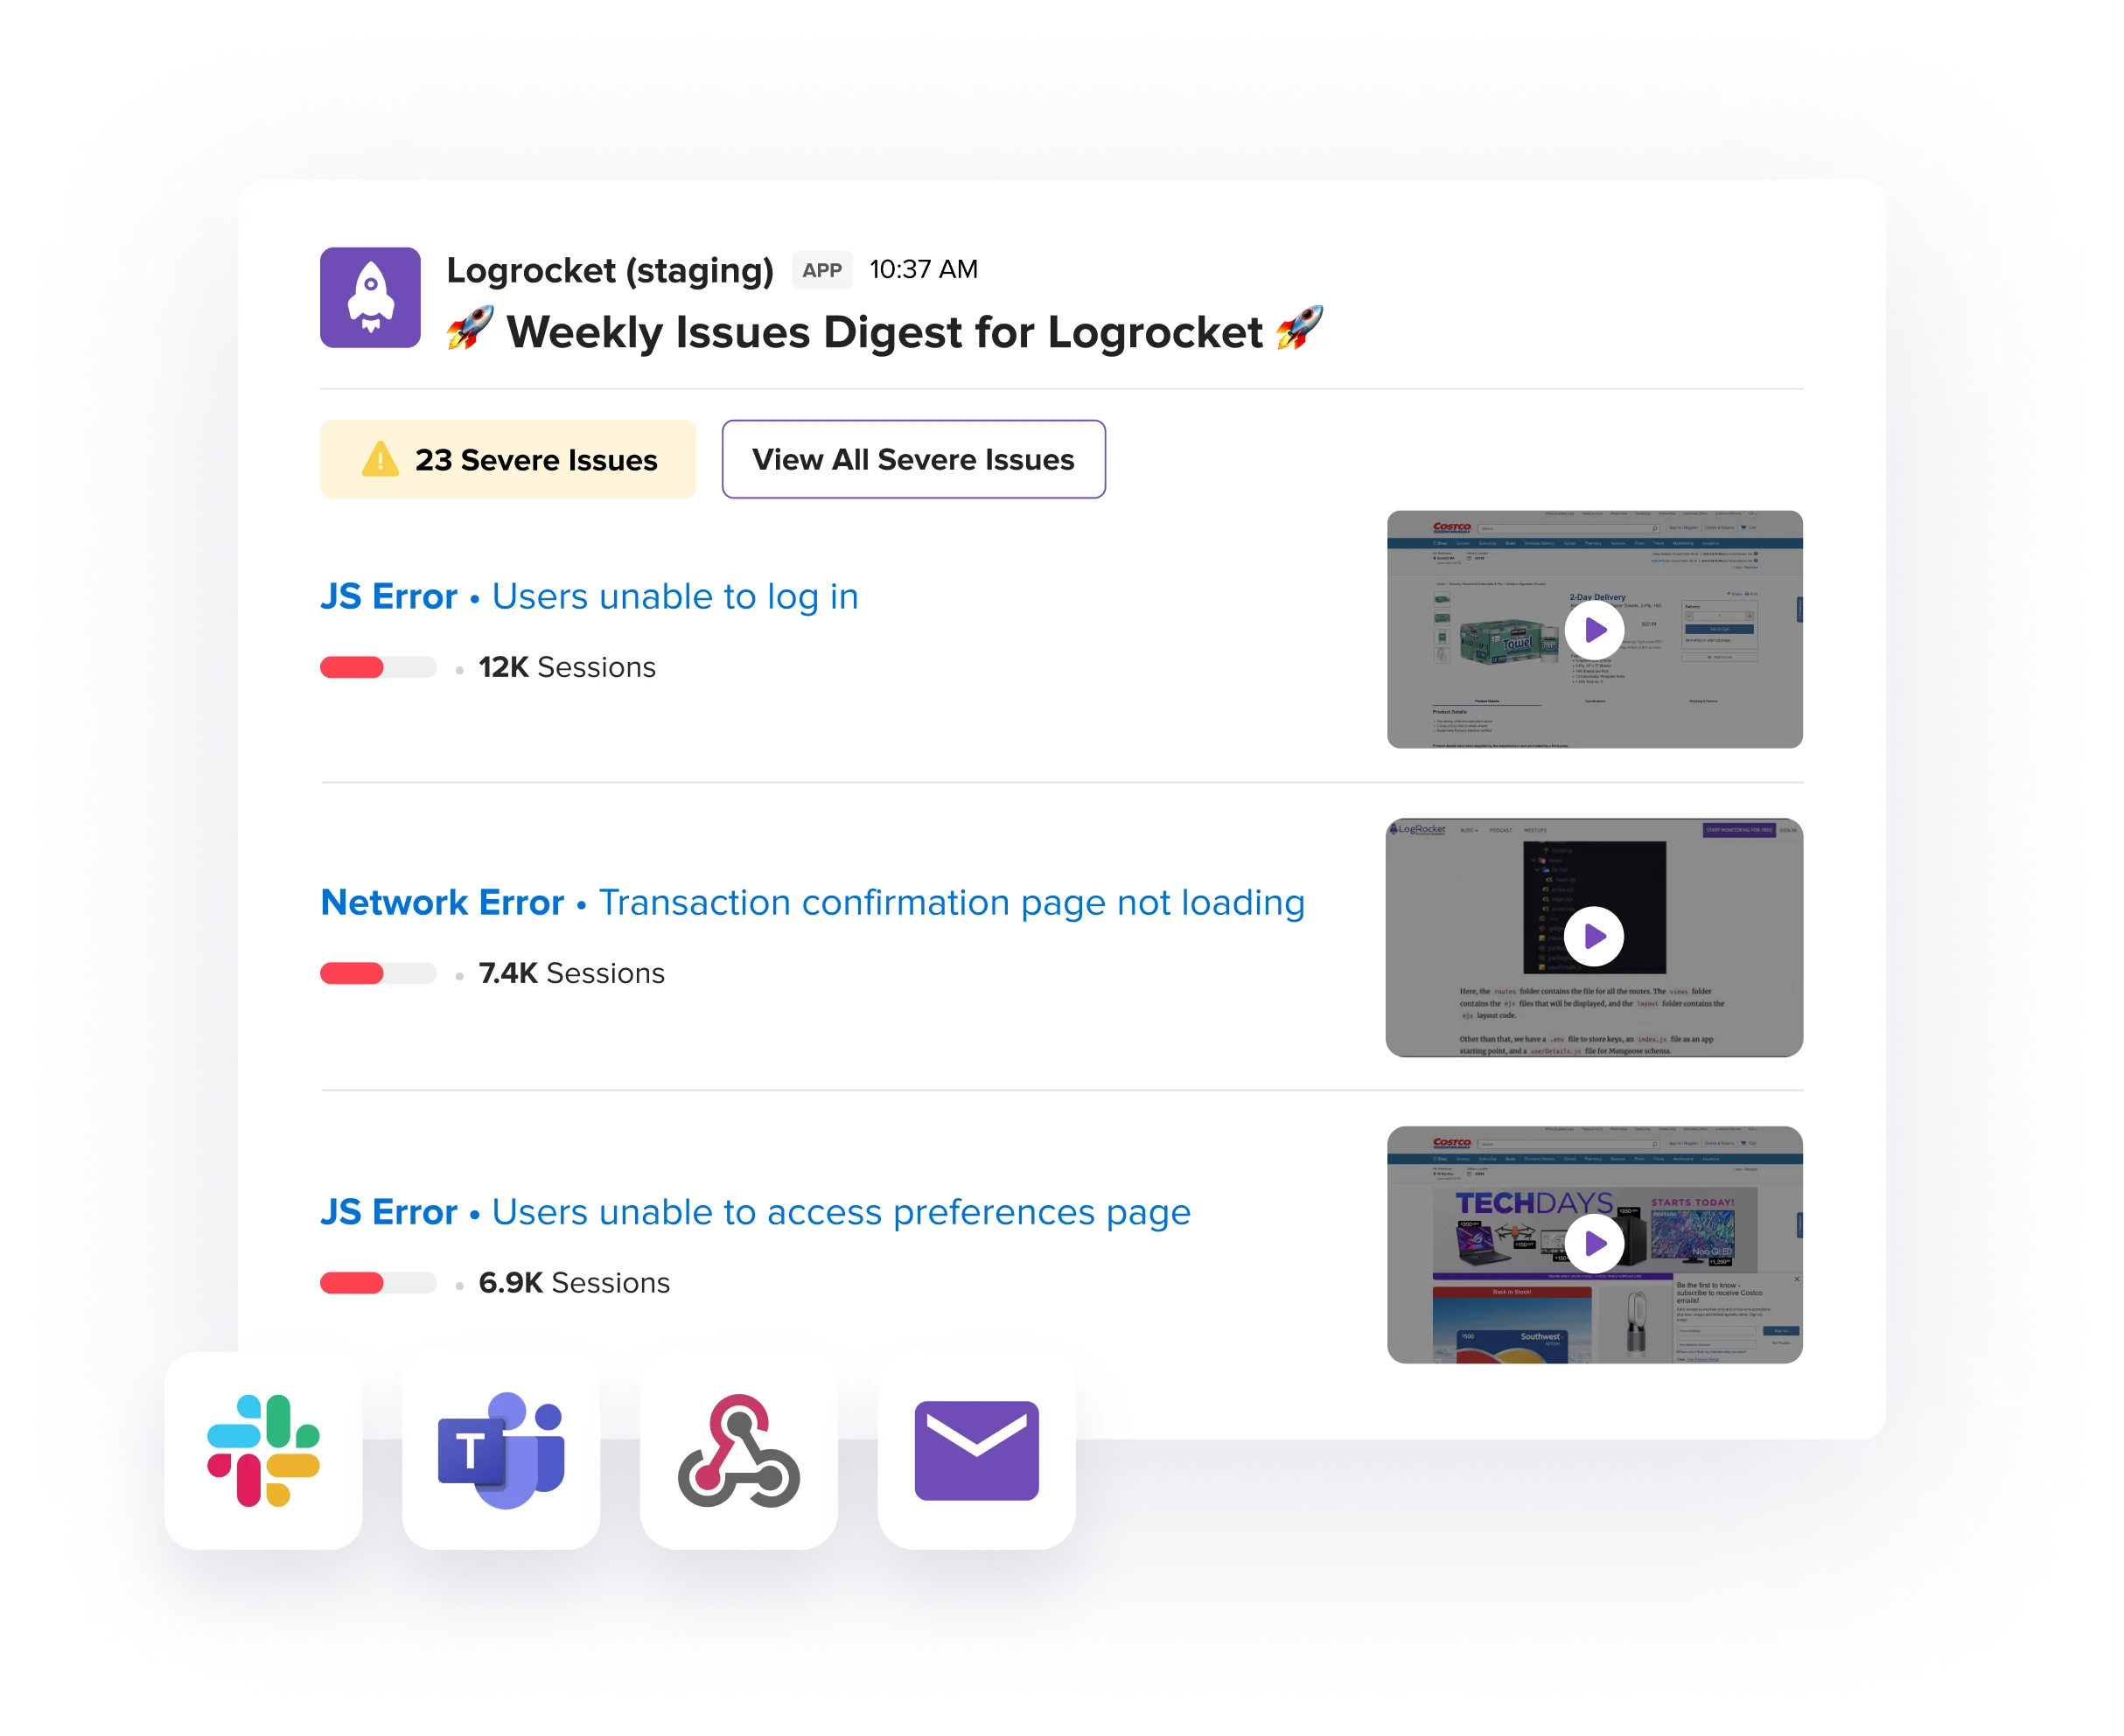
What Makes LogRocket Stand Out:
LogRocket's session replay is unmatched in detail. It captures the full DOM, Redux/Vuex state changes, console logs, network requests with headers and responses, and even performance metrics. When debugging complex issues, this level of detail is invaluable.
Real Implementation Experience:
LogRocket's default installation captures everything, which felt invasive initially. We spent considerable time configuring privacy settings to redact sensitive data. The Redux integration was seamless, allowing us to see state changes alongside user actions.
This is how the key implementation part of LogRocket looks like:
// LogRocket implementation
import LogRocket from 'logrocket';

LogRocket.init('YOUR_APP_ID', {
  console: {
    shouldAggregateConsoleErrors: true
  },
  network: {
    requestSanitizer: request => {
      // Redact sensitive headers
      if (request.headers['Authorization']) {
        request.headers['Authorization'] = '[REDACTED]';
      }
      return request;
    }
  }
});

// Redux integration
import setupLogRocketReact from 'logrocket-react';
setupLogRocketReact(LogRocket);
Pros:
- Unparalleled debugging context with full session replay
- Excellent Redux/Vuex state inspection
- Product analytics features included
- Network request waterfall with timing
- Easy integration with other tools
Cons:
- Expensive at scale ($69/month minimum for paid plans)
- Privacy concerns with default "capture everything" approach
- Larger performance impact on bundle size
- Can capture sensitive data if not properly configured
- Limited to 1,000 sessions on free plan
Pricing Reality Check:
- 1K users: Free tier (1,000 sessions)
- 10K users: $69-299/month
- 100K users: $500-2000+/month depending on session volume
Tool #3: Datadog RUM - The Full-Stack Observer
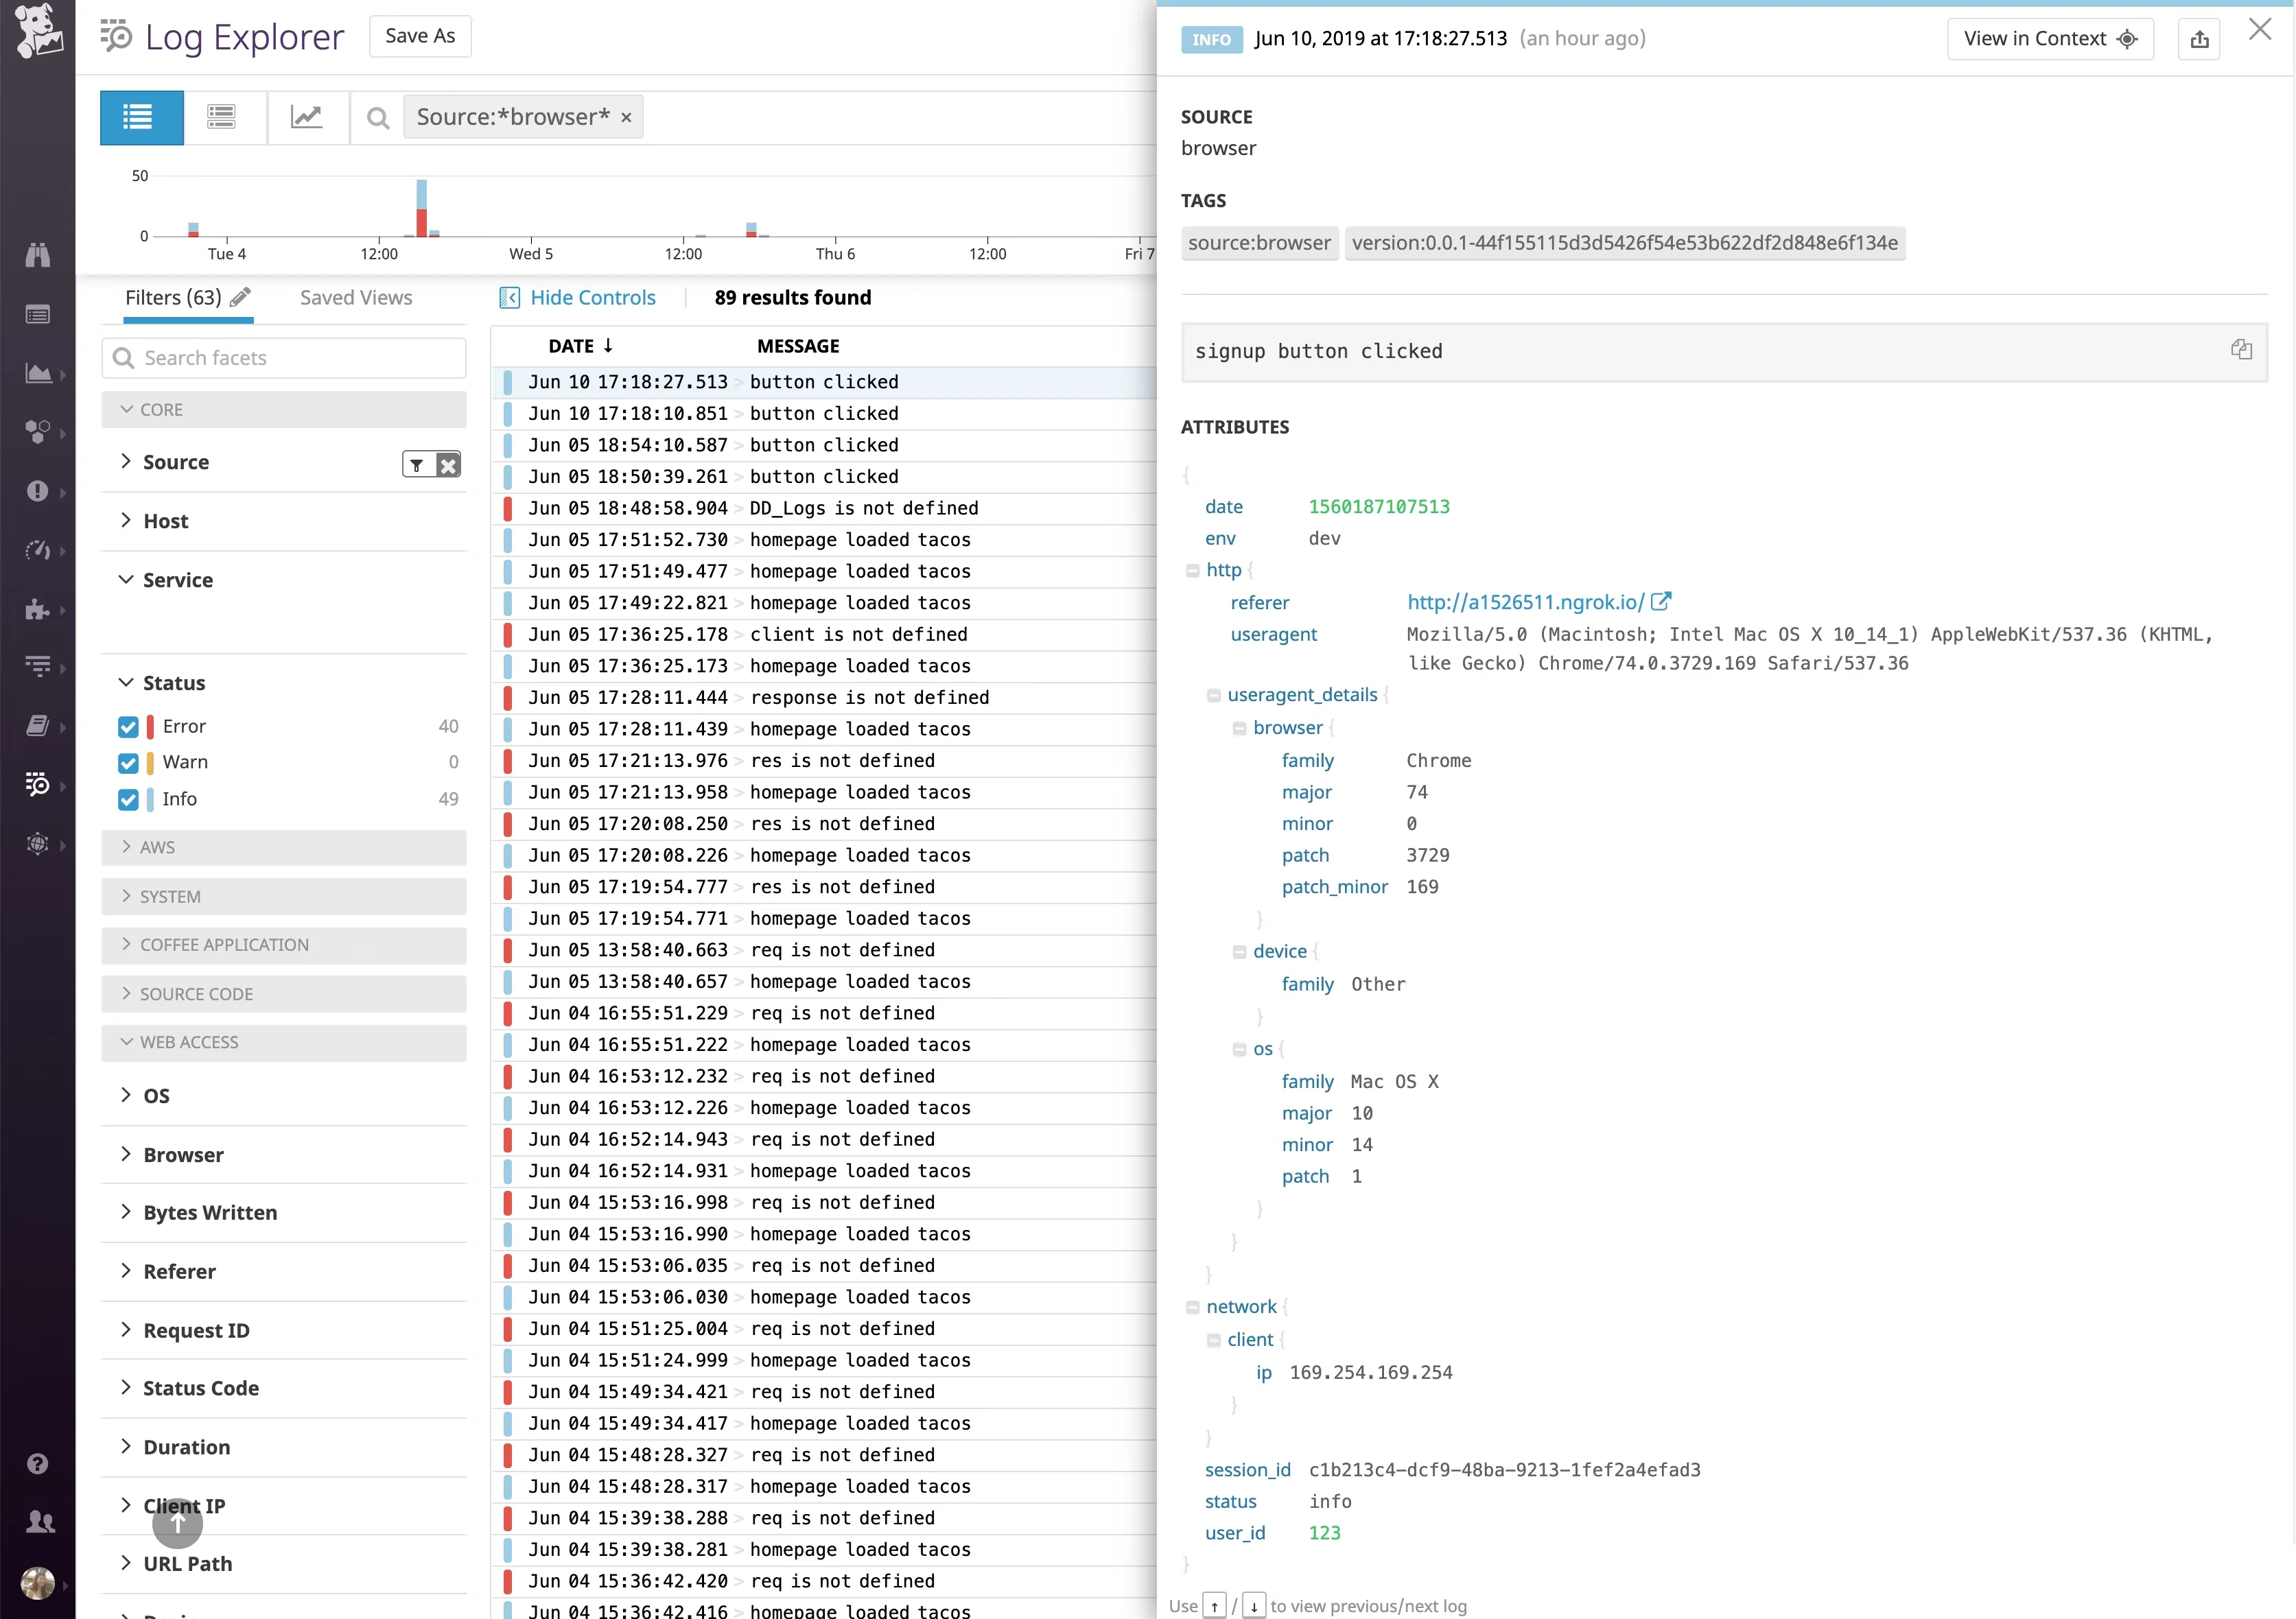
When your frontend logs need to talk to your backend traces, Datadog Real User Monitoring (RUM) shines. It's part of Datadog's comprehensive observability platform, bridging the gap between frontend and backend monitoring.

What Makes Datadog Stand Out:
The killer feature is end-to-end tracing. Click on a frontend error, and you can follow the request all the way through your backend services, databases, and third-party APIs. This correlation is powerful for debugging complex distributed systems.
Real Implementation Experience:
Datadog's setup was straightforward for teams already using Datadog. The integration with backend APM was seamless. However, the pricing calculator was complex, and costs can escalate quickly with high-traffic applications.
This is how the key implementation part of Datadog RUM looks like:
// Datadog RUM implementation
import { datadogRum } from '@datadog/browser-rum';

datadogRum.init({
  applicationId: 'YOUR_APP_ID',
  clientToken: 'YOUR_CLIENT_TOKEN',
  site: 'datadoghq.com',
  service: 'your-app-name',
  env: 'production',
  version: '1.0.0',
  sessionSampleRate: 100,
  sessionReplaySampleRate: 20,
  trackUserInteractions: true,
  trackResources: true,
  trackLongTasks: true,
  defaultPrivacyLevel: 'mask-user-input'
});

// Capture custom logs
datadogRum.addLoggerGlobalContext('user_id', userId);
datadogLogs.logger.info('User action', { action: 'checkout', amount: 99.99 });
Pros:
- Complete observability platform beyond just frontend
- Excellent backend correlation with distributed tracing
- Flexible usage-based pricing
- Enterprise-grade features and compliance
- Heat maps and user journey visualization
Cons:
- Can get expensive quickly at scale
- Steep learning curve for the full platform
- Overkill for frontend-only monitoring needs
- Complex pricing calculator with multiple SKUs
- Two-part pricing model can become expensive (detailed below)
The Datadog Pricing Problem:
Datadog's log management uses a "two-part tariff" that looks inexpensive initially but becomes costly as you scale. You pay separately for ingestion and indexing:
- Ingest: $0.10 per GB to collect and archive logs
- Index: $1.70 per million log events to make them searchable
The problem? You pay twice for the same data. For a modest 200 GB/month (≈100M events):
- Ingest cost: $20 (200 GB × $0.10)
- Indexing cost: $170 (100M events × $1.70)
- Total: $190/month
This forces teams to choose between cost and visibility. Many only index 20% of logs to save money, meaning 80% of critical debugging data isn't searchable during incidents when you need it most. Read more about Datadog's pricing challenges here.
Pricing Reality Check:
- 1K users: ~$15-30/month with basic RUM
- 10K users: $150-500/month (including log indexing)
- 100K users: $1,500-5,000+/month (varies significantly by log volume)
Tool #4: New Relic Browser - The Enterprise Choice
New Relic Browser is part of New Relic's all-in-one monitoring platform. It's the Swiss Army knife of monitoring, now with frontend capabilities that rival specialized tools.
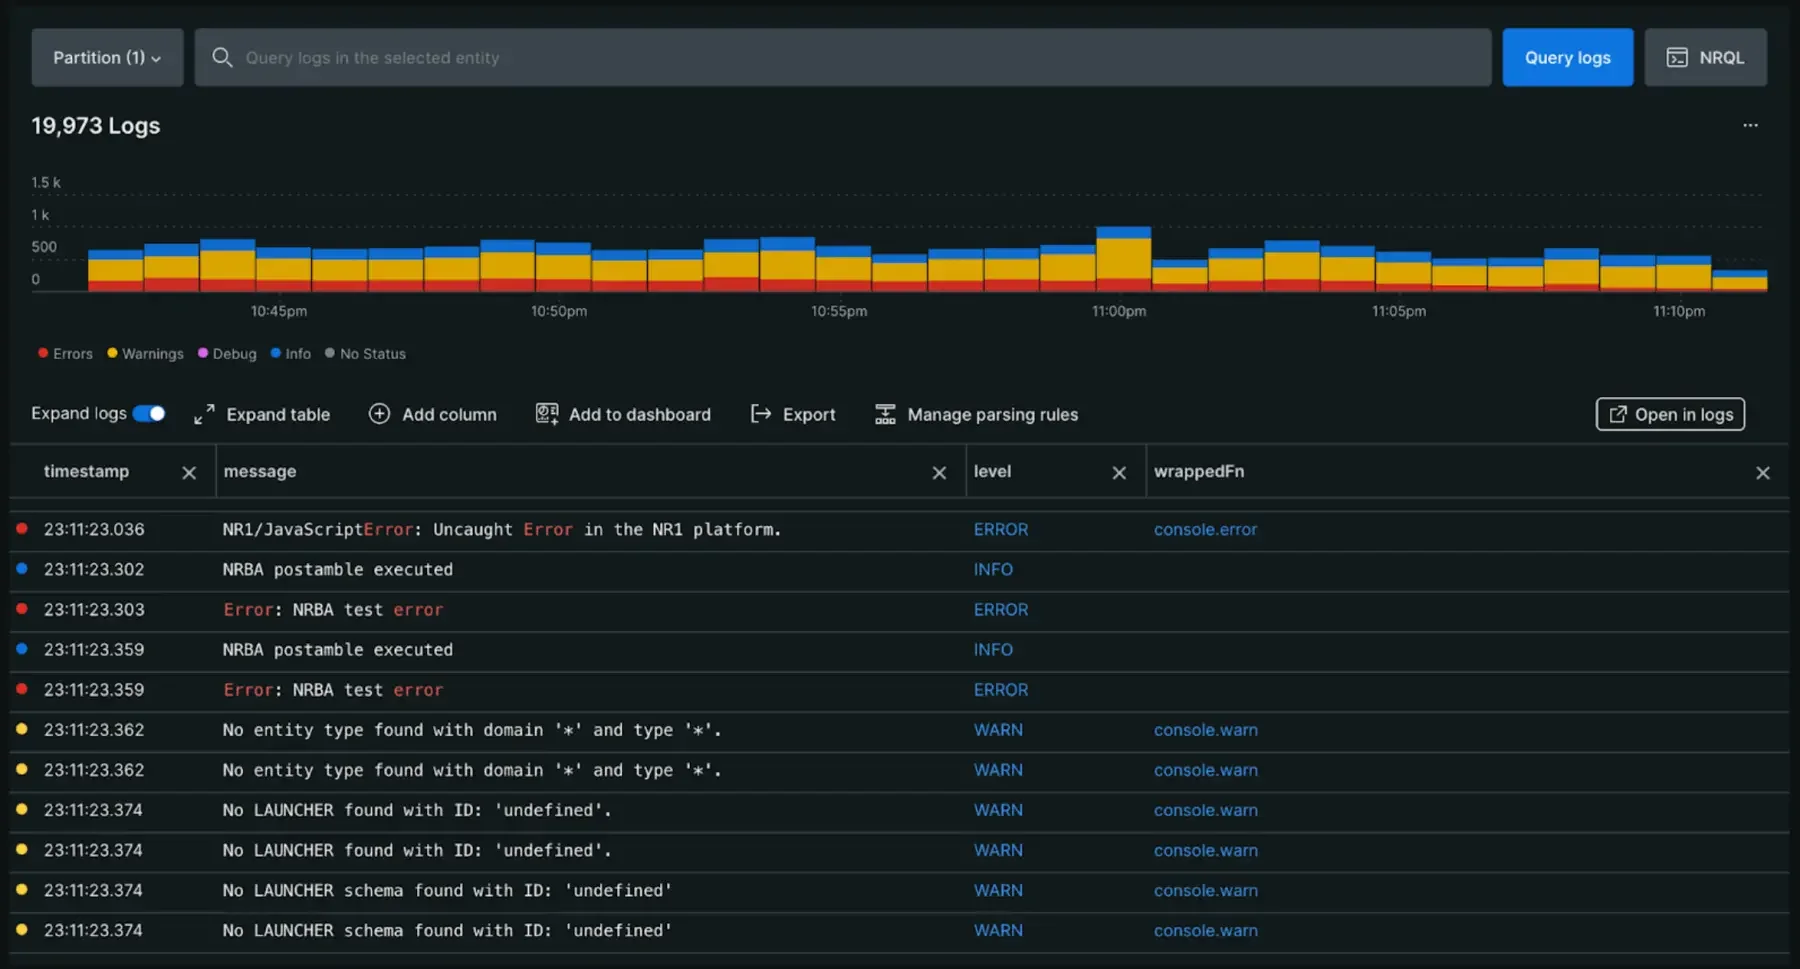
What Makes New Relic Stand Out:
New Relic's unified platform approach means you get frontend monitoring, backend APM, infrastructure monitoring, and log management all in one place. The generous free tier (100GB/month data ingest) is surprisingly capable for small to medium applications.
Real Implementation Experience:
New Relic's browser agent was easy to implement, but the UI feels dated compared to newer tools. The wealth of features can be overwhelming initially, but the documentation is comprehensive. Session replay works well but is an add-on feature.
This is how the key implementation part of New Relic Browser looks like:
// New Relic Browser implementation
// Can be added via NPM or script tag
import { BrowserAgent } from '@newrelic/browser-agent/loaders/browser-agent'

const options = {
  init: {
    distributed_tracing: { enabled: true },
    privacy: { cookies_enabled: true },
    ajax: { deny_list: ['bam.nr-data.net'] },
    session_replay: { enabled: true, mask_all_inputs: true }
  },
  info: {
    beacon: 'bam.nr-data.net',
    errorBeacon: 'bam.nr-data.net',
    licenseKey: 'YOUR_LICENSE_KEY',
    applicationID: 'YOUR_APP_ID',
  },
  loader: 'spa'
}

new BrowserAgent(options)

// Manual log capture
newrelic.log('User completed checkout', {level: 'info'})
Pros:
- Generous free tier (100GB/month)
- Unified platform for all monitoring needs
- Excellent documentation and support
- Strong enterprise features and compliance
- Distributed tracing across frontend and backend
Cons:
- UI feels dated compared to modern alternatives
- Can be complex for small teams
- Session replay is an additional cost
- Learning curve for the full platform
Pricing Reality Check:
- 1K users: Free tier usually sufficient
- 10K users: Free to $99/month depending on data volume
- 100K users: $200-500+/month with additional user seats
Tool #5: Grafana Frontend Observability - The Open Standards Champion
Grafana's Frontend Observability brings the power of Grafana's visualization to frontend monitoring, with a focus on open standards and flexibility.
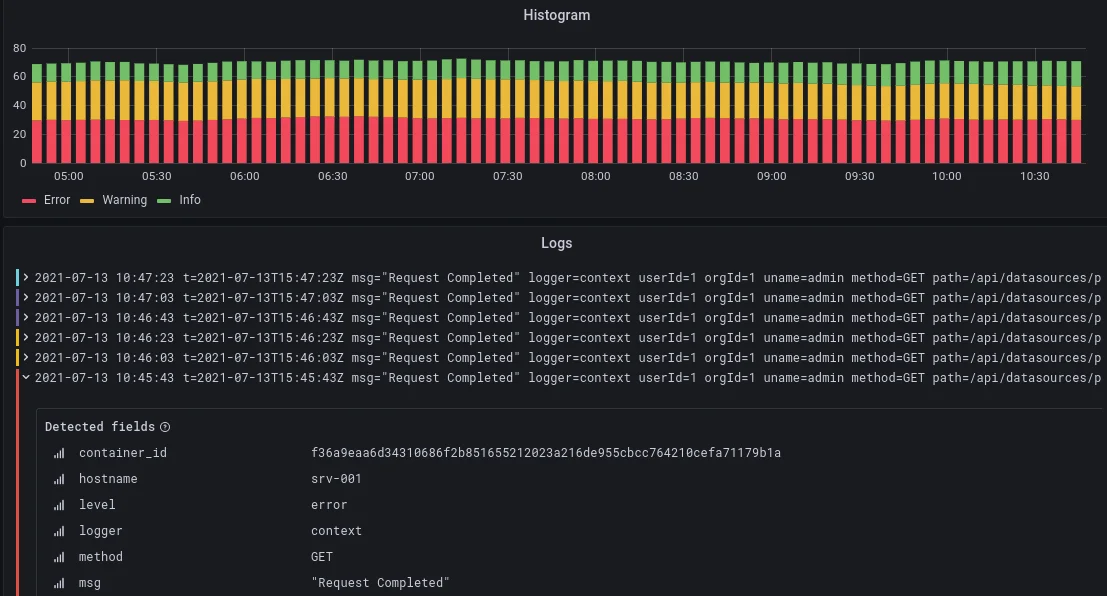
What Makes Grafana Stand Out:
Grafana's strength lies in its incredible visualization capabilities and open architecture. You can create custom dashboards that combine frontend metrics with any other data source. The Faro Web SDK is built on OpenTelemetry standards, ensuring no vendor lock-in.
Real Implementation Experience:
Grafana's setup requires more technical knowledge than other tools. You need to understand Grafana's ecosystem, but once configured, the flexibility is unmatched. The ability to correlate frontend data with infrastructure metrics in custom dashboards is powerful.
This is how the key implementation part of Grafana Faro looks like:
// Grafana Faro implementation
import { initializeFaro } from '@grafana/faro-web-sdk';

const faro = initializeFaro({
  url: 'https://collector-endpoint/collect/{app-key}',
  app: {
    name: 'my-app',
    version: '1.0.0',
    environment: 'production'
  },
  instrumentations: [
    // Automatically included: console, errors, web-vitals, session
  ],
  consoleInstrumentation: {
    consoleErrorAsLog: true,
    // Disable noisy log levels
    captureConsoleDisabledLevels: ['debug', 'trace']
  }
});

// Custom logging
faro.api.pushLog(['User action'], {
  level: 'info',
  context: { userId: '123', action: 'checkout' }
});
Pros:
- Incredible visualization and dashboard capabilities
- Open standards based (OpenTelemetry)
- Flexible data storage and querying
- Can combine with any data source
- Good documentation for instrumentation
Cons:
- Steeper learning curve than purpose-built tools
- No built-in session replay
- Requires more setup and configuration
- Less out-of-the-box functionality
Pricing Reality Check:
- 1K users: ~$50/month for Grafana Cloud
- 10K users: $200-400/month
- 100K users: Custom pricing, typically $1000+/month
Best For: Teams already using Grafana or wanting maximum flexibility in visualization and data correlation.
Tool #6: SigNoz - The Unified Observability Alternative
SigNoz brings a fresh perspective as an OpenTelemetry-native observability platform. It's not just about logging, it's about complete observability with traces, metrics, and logs in one place.
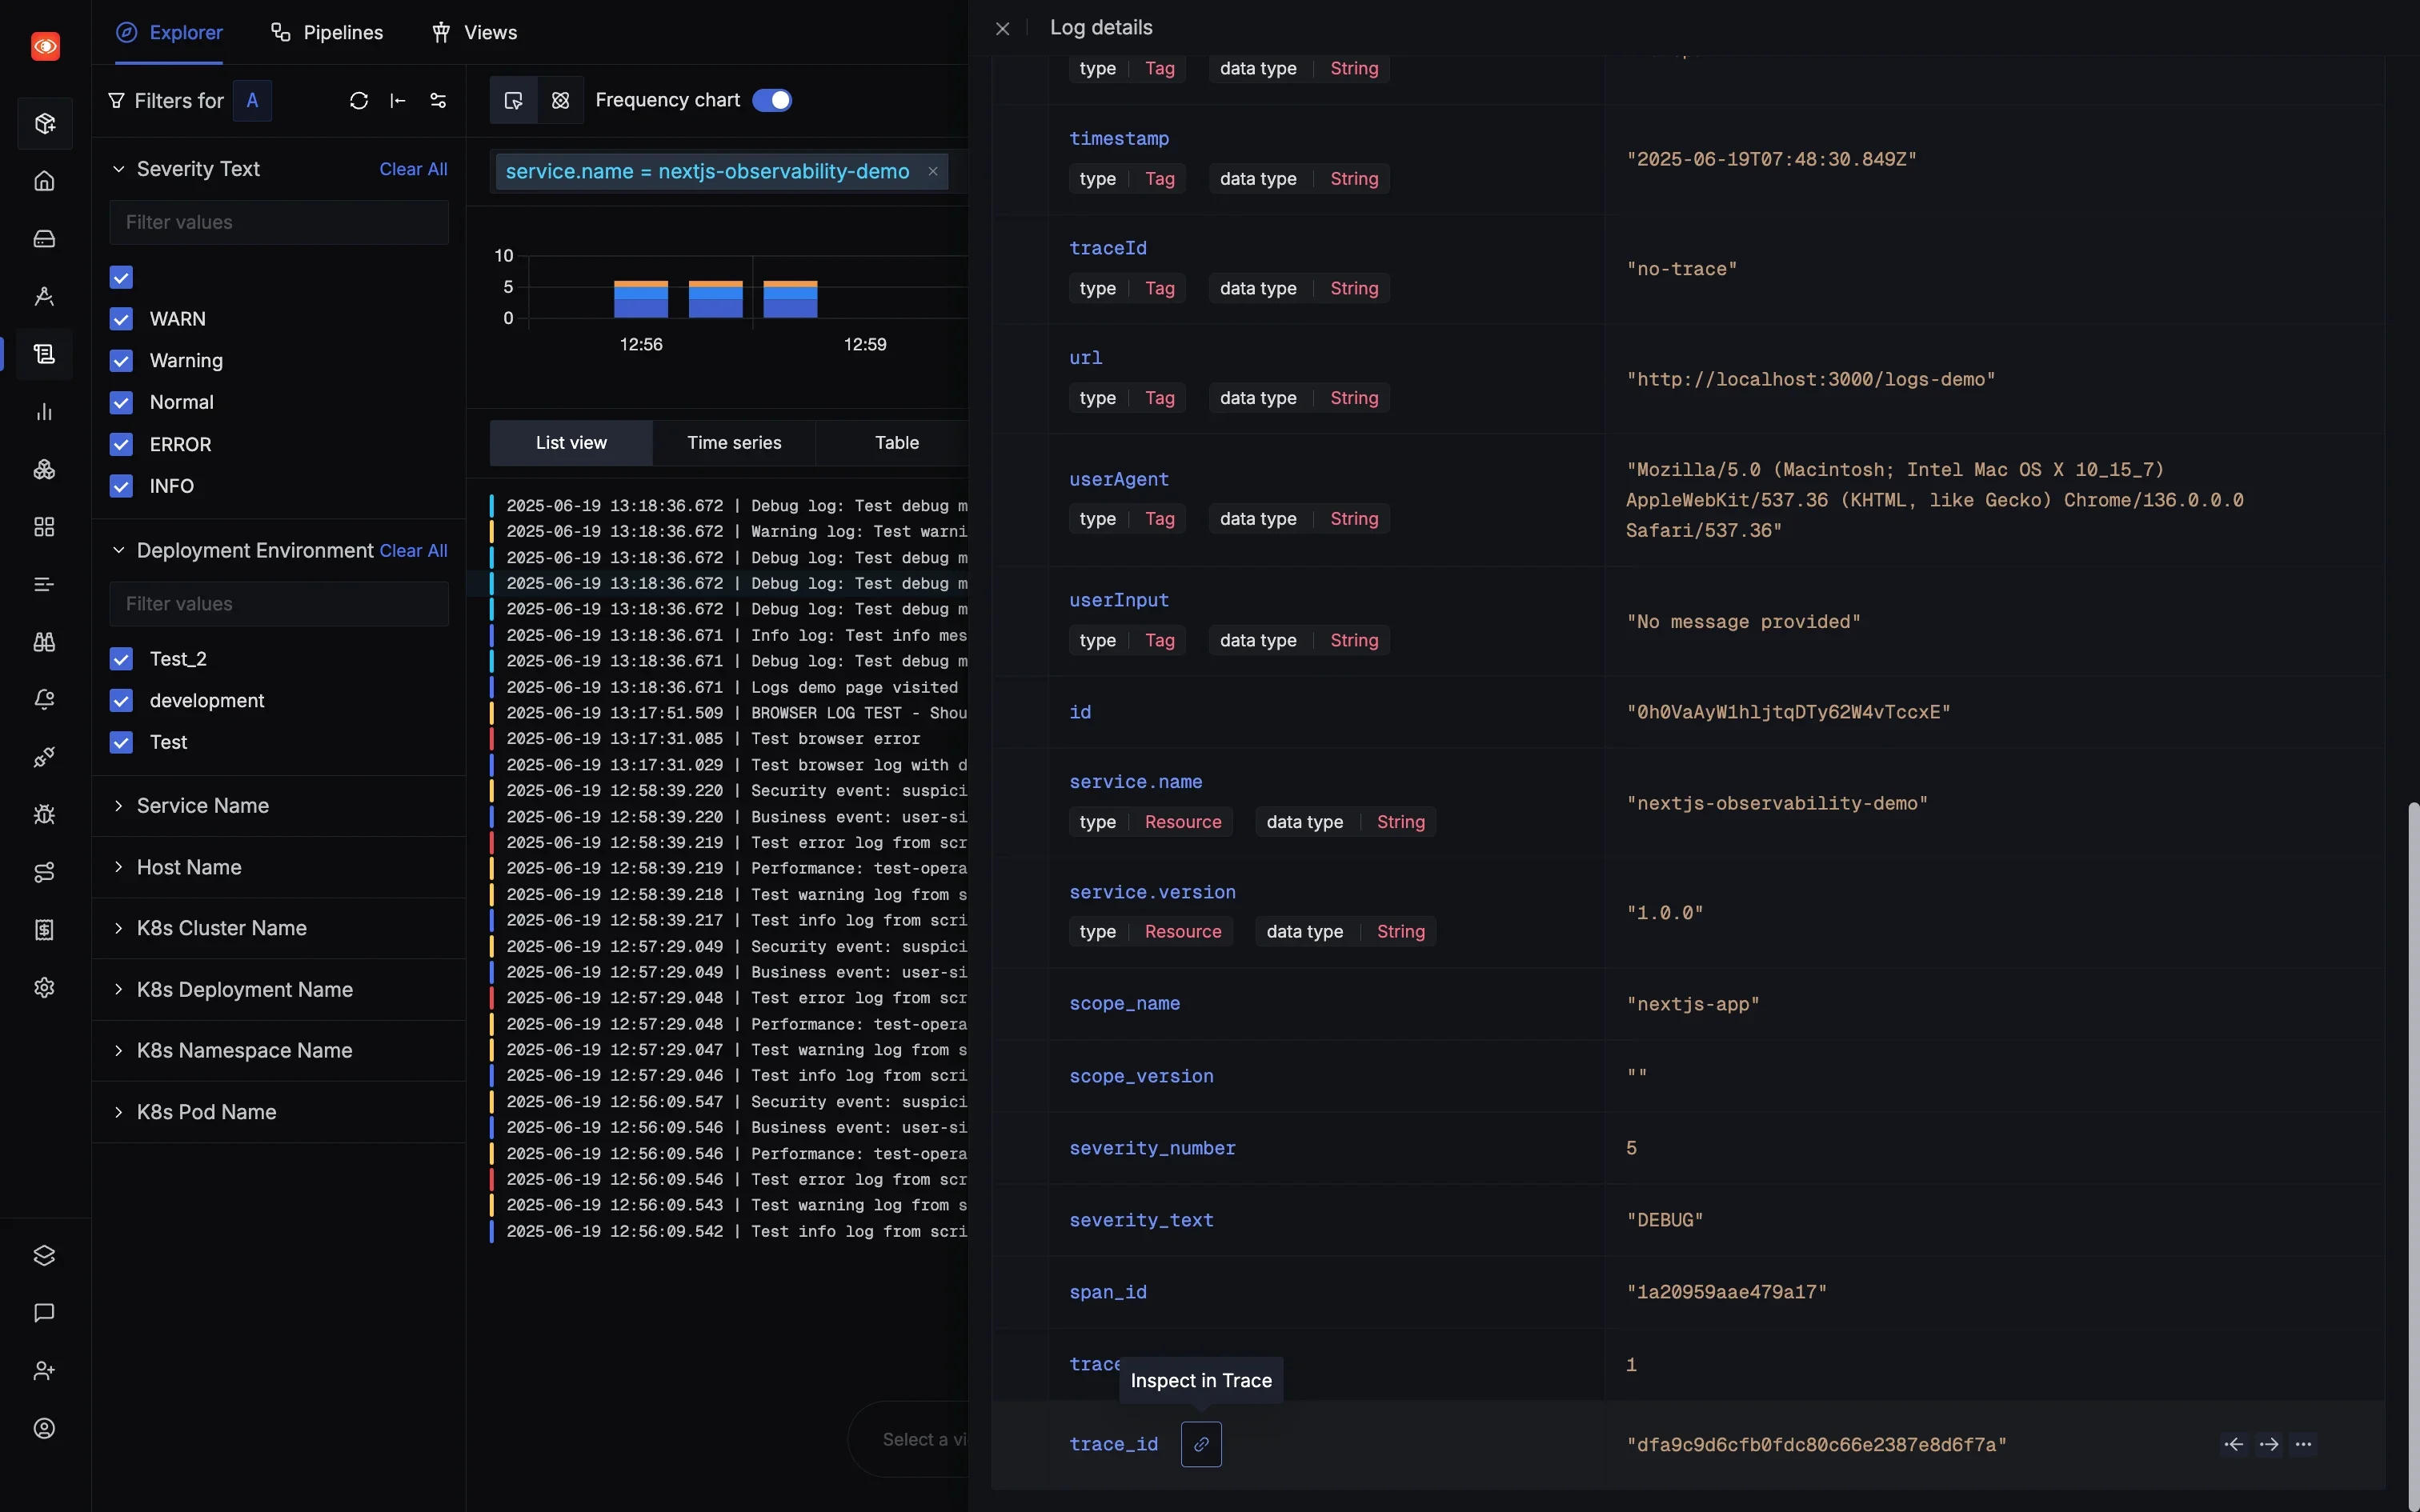
What Makes SigNoz Stand Out:
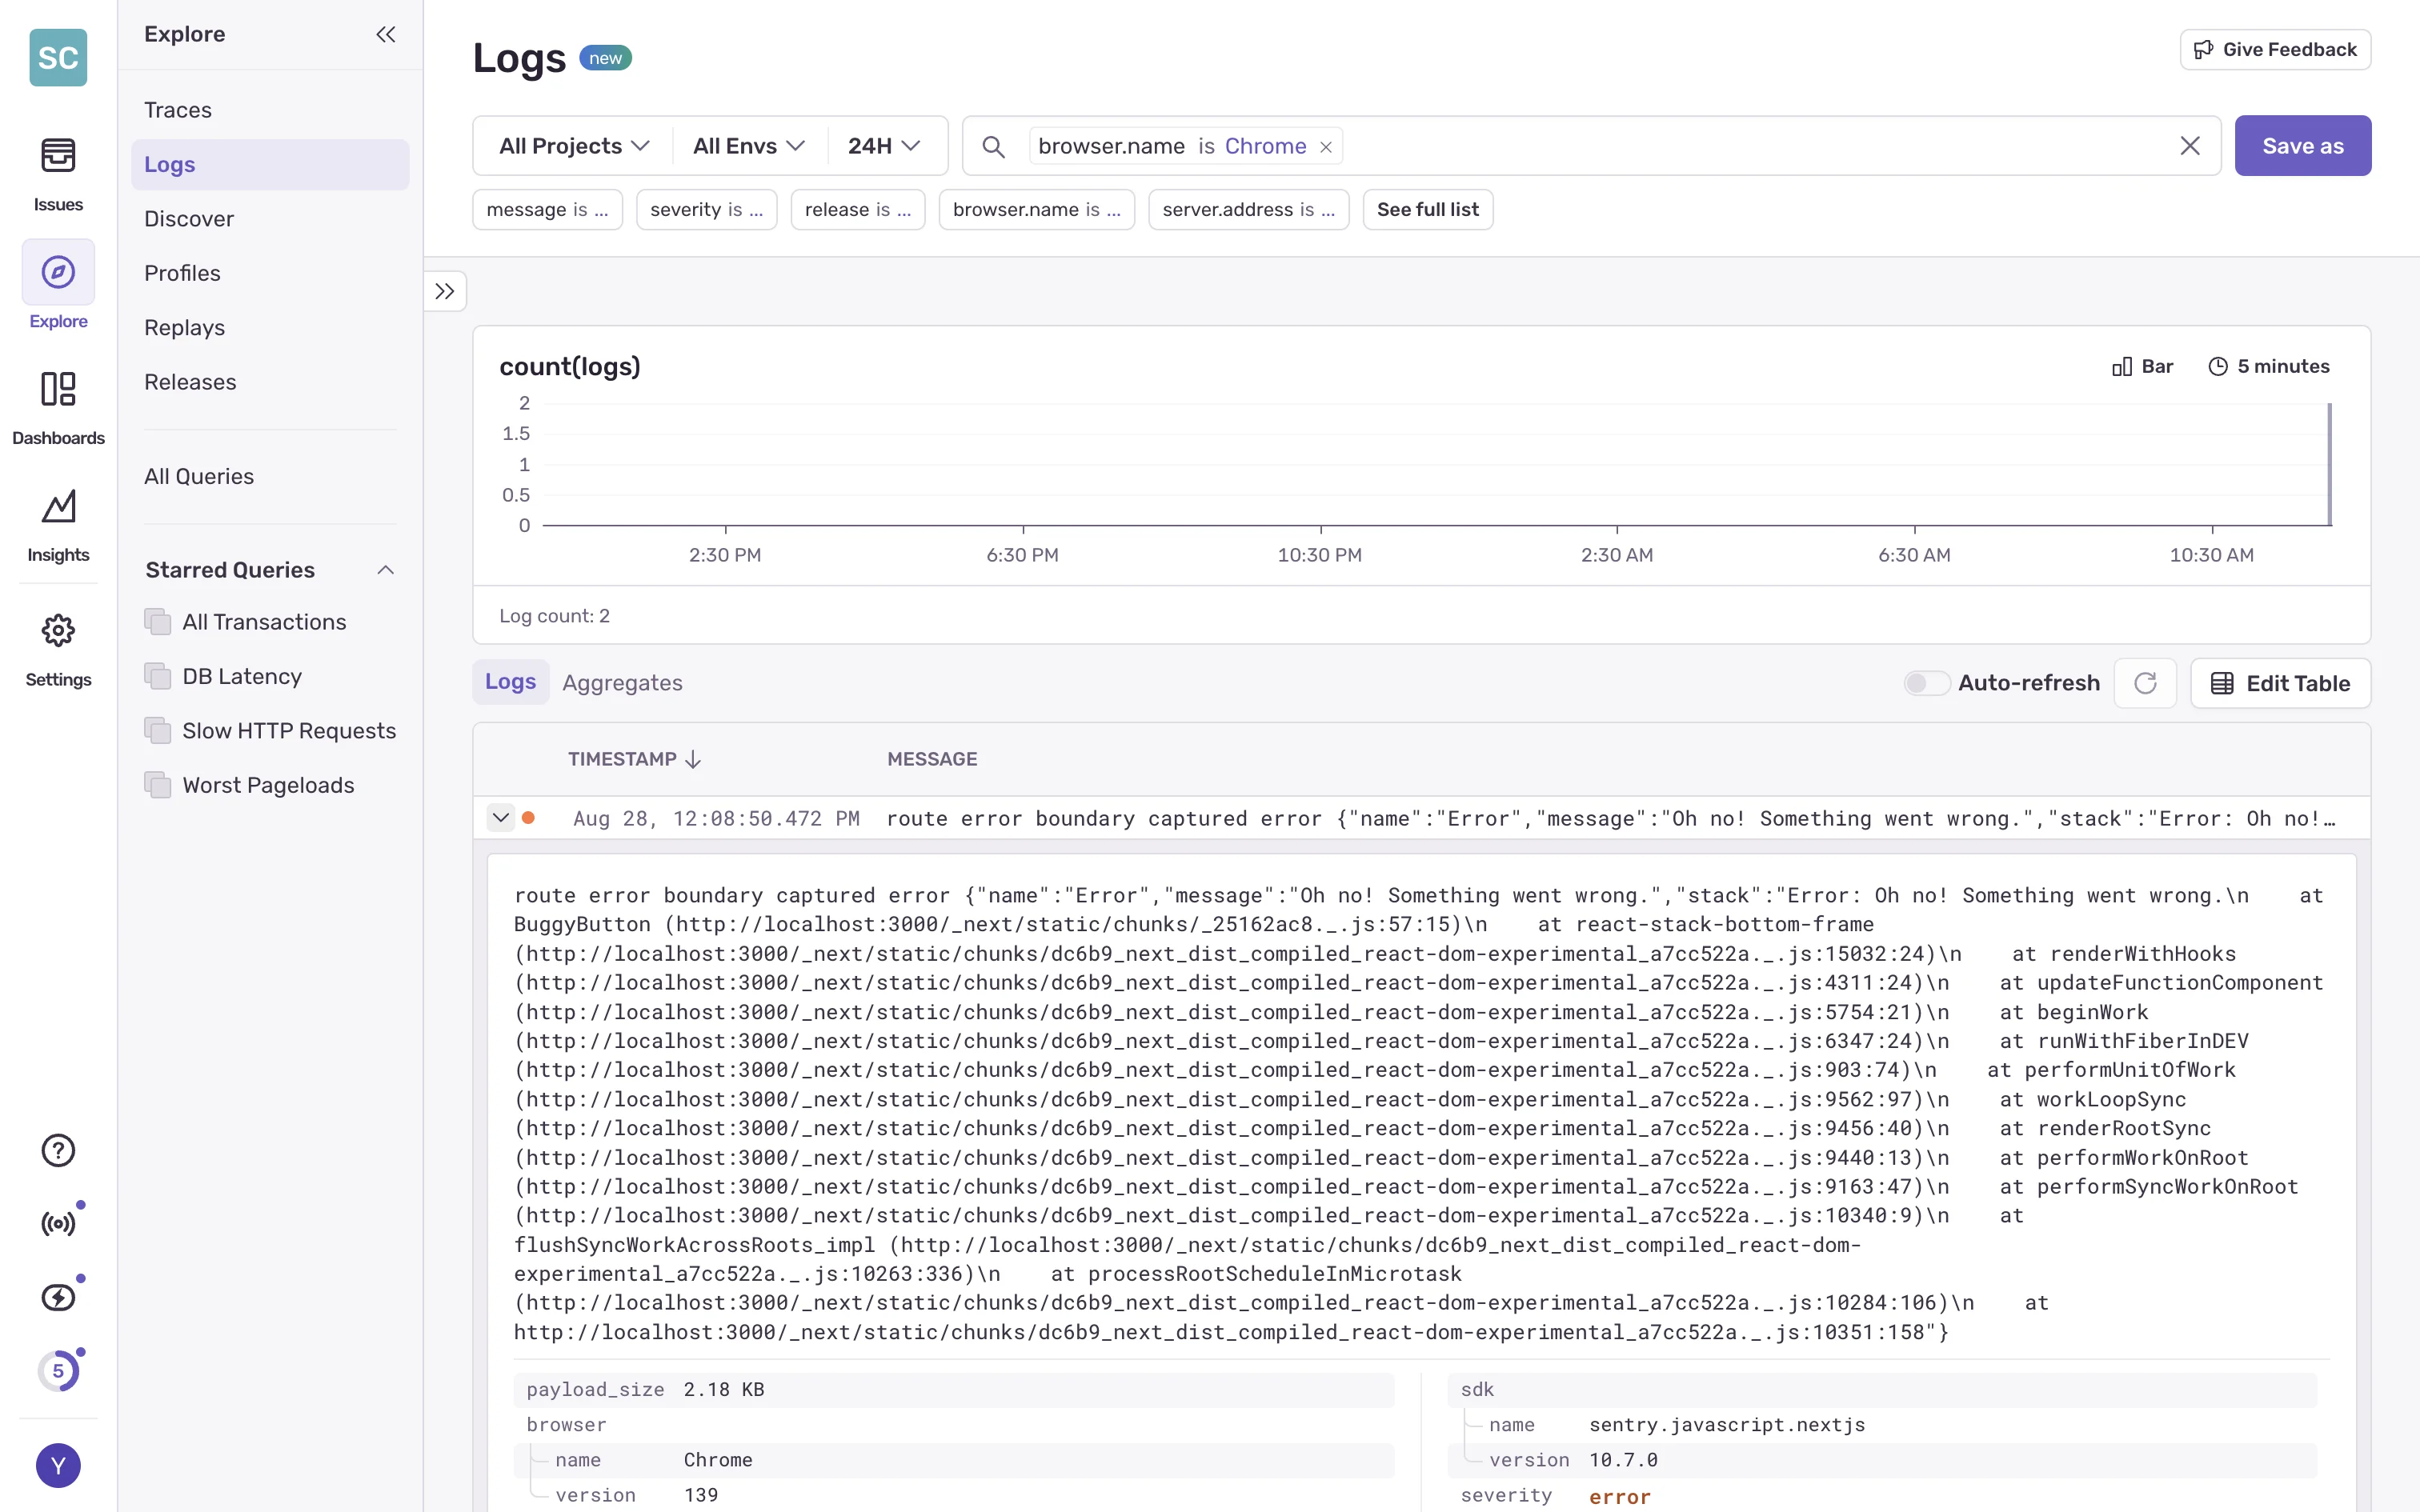
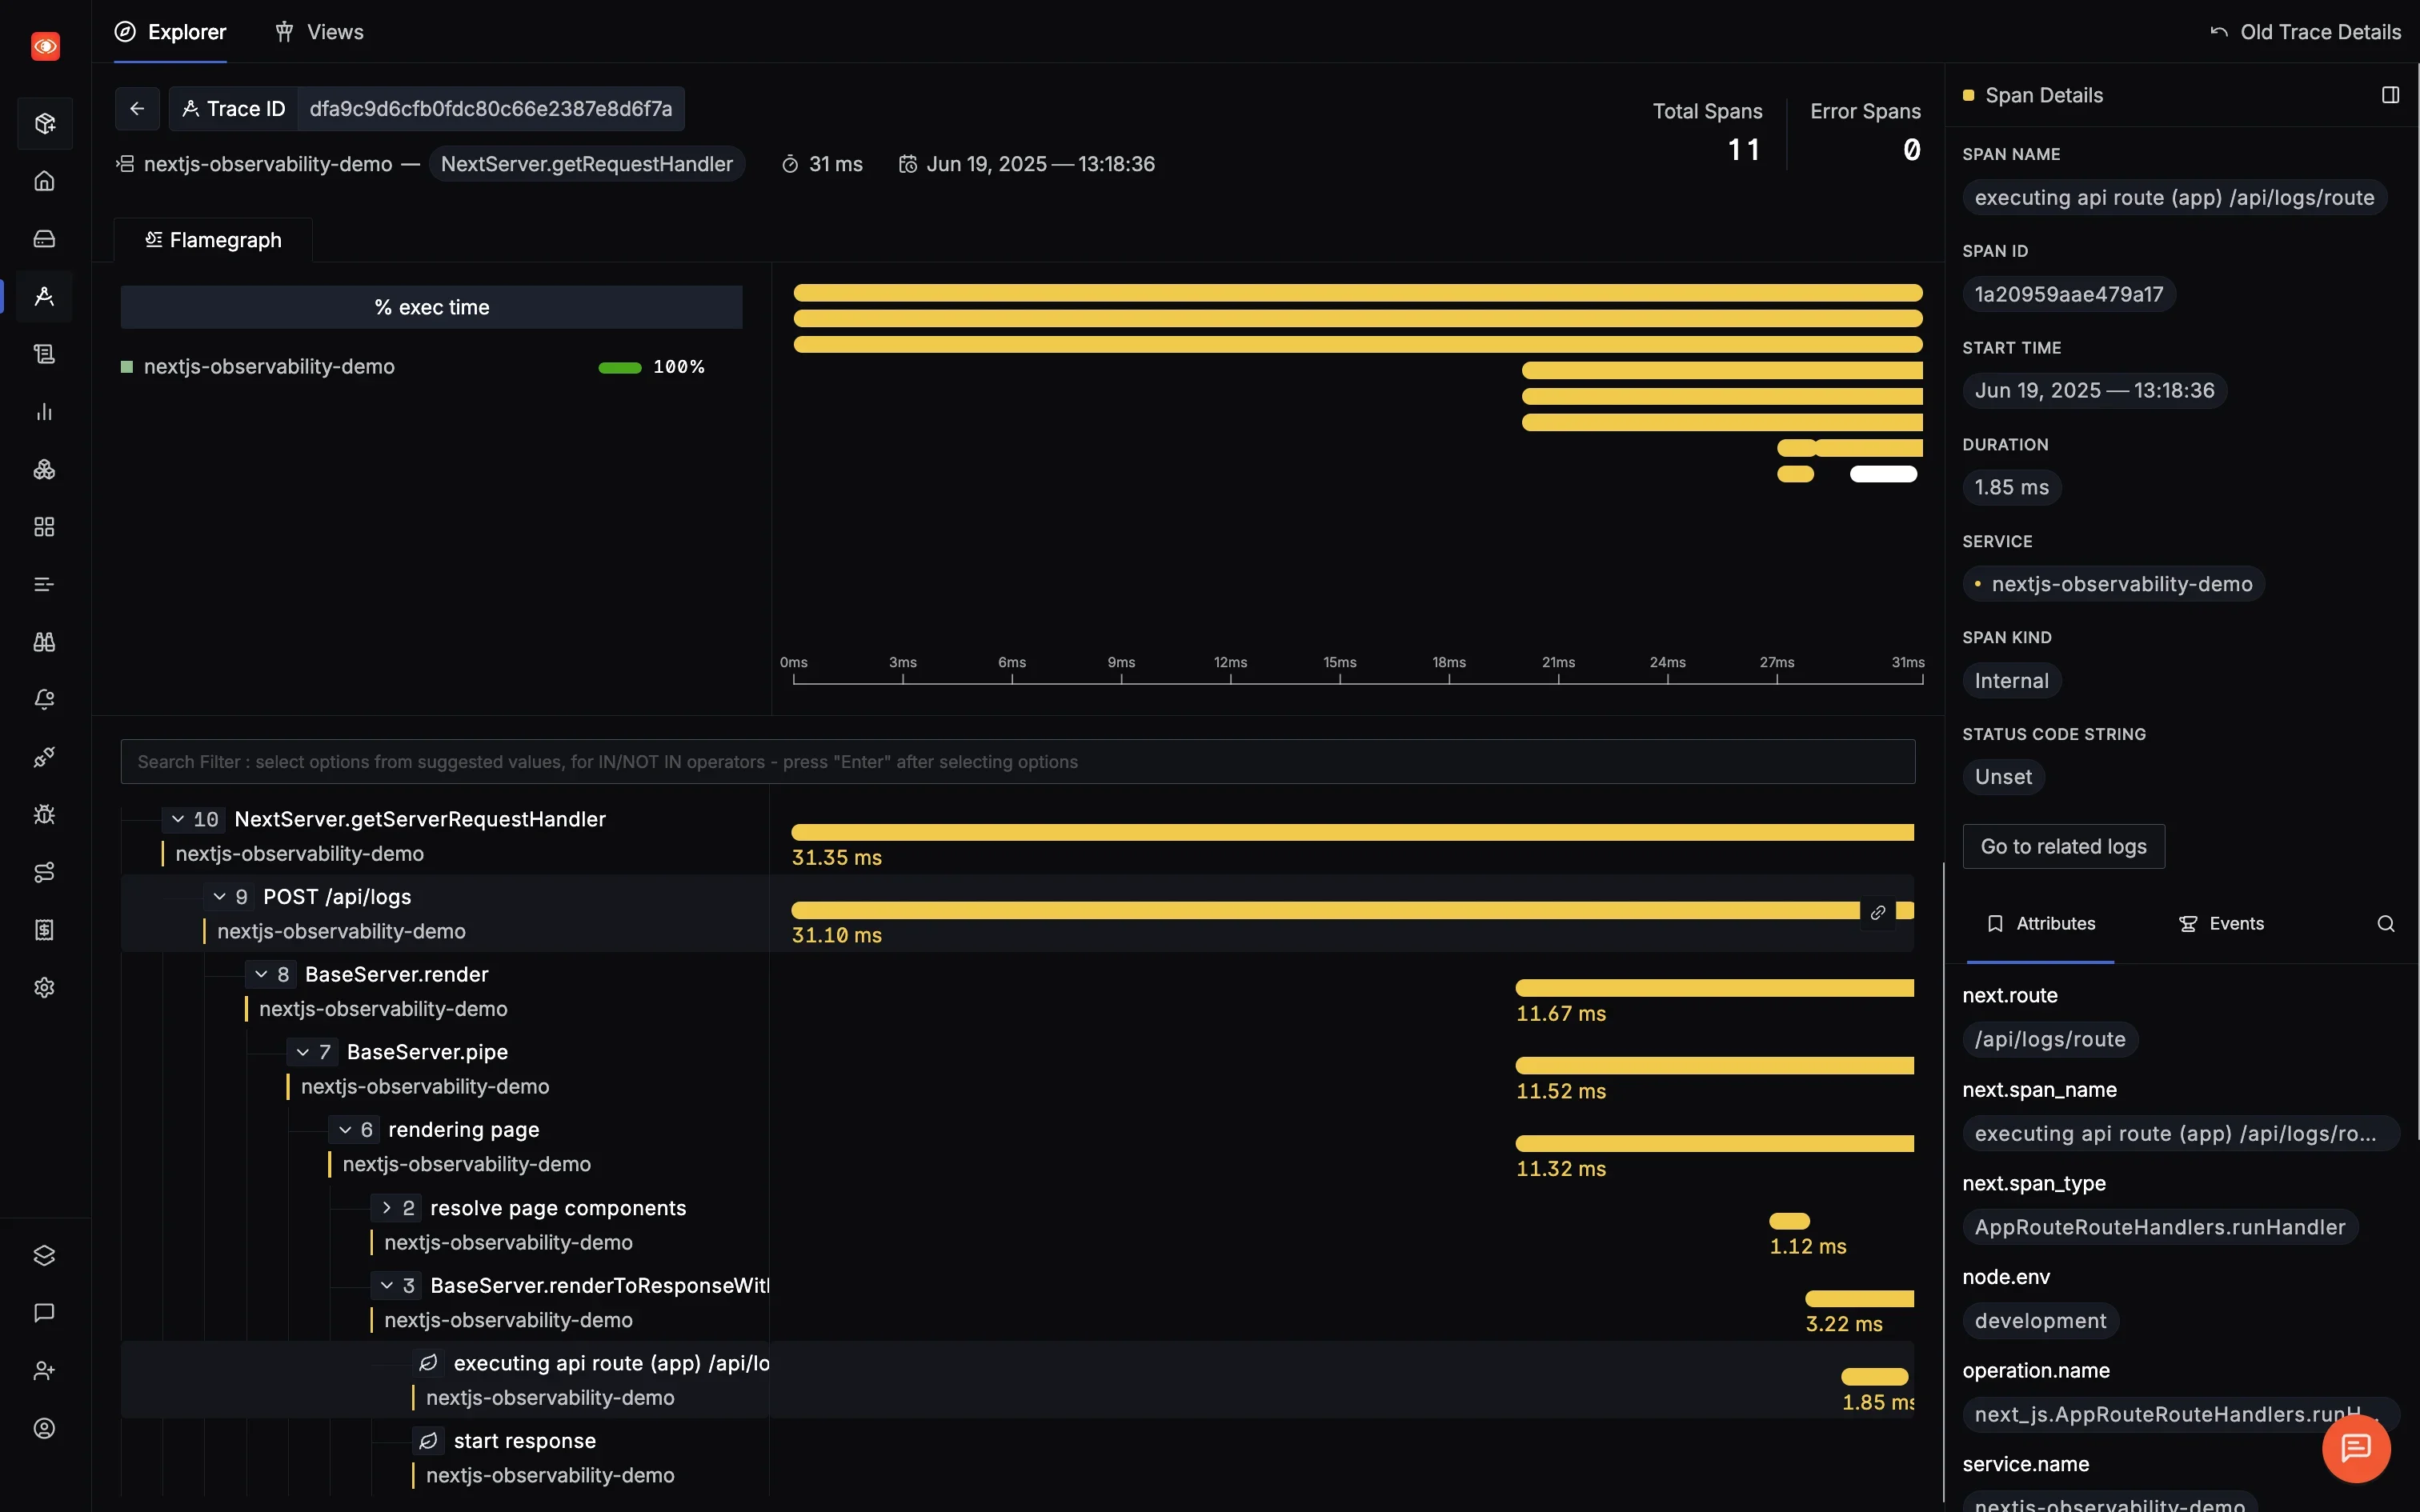
SigNoz is built on OpenTelemetry from the ground up, meaning no vendor lock-in and standardized instrumentation. You can self-host for complete data control or use their cloud offering for convenience. The correlation between logs and traces is particularly powerful.
Real Implementation Experience:
SigNoz required more initial setup than SaaS alternatives, but the OpenTelemetry foundation means excellent flexibility. The ability to correlate frontend logs with backend traces using trace IDs was incredibly valuable for debugging.
This is how the key implementation part of SigNoz looks like:
// SigNoz implementation with OpenTelemetry
import { LoggerProvider, SimpleLogRecordProcessor } from '@opentelemetry/sdk-logs';
import { OTLPLogExporter } from '@opentelemetry/exporter-logs-otlp-http';
import { logs } from '@opentelemetry/api-logs';
import { Resource } from '@opentelemetry/resources';

const loggerProvider = new LoggerProvider({
  resource: new Resource({
    'service.name': 'frontend-app',
    'service.version': '1.0.0',
  }),
});

loggerProvider.addLogRecordProcessor(
  new SimpleLogRecordProcessor(
    new OTLPLogExporter({
      url: 'https://ingest.signoz.cloud:443/v1/logs',
      headers: {
        'signoz-ingestion-key': '<your-ingestion-key>',
      },
    })
  )
);

logs.setGlobalLoggerProvider(loggerProvider);

// Create logger and use it
const logger = logs.getLogger('frontend-logger');

// Log with severity and attributes
logger.emit({
  body: 'User action completed',
  severityNumber: SeverityNumber.INFO,
  severityText: 'INFO',
  attributes: {
    userId: '123',
    action: 'checkout',
    amount: 99.99
  }
});
Pros:
- Full observability stack (logs, metrics, traces)
- OpenTelemetry native with no vendor lock-in
- Cost-effective at scale
- Complete data ownership with self-hosted option
- Active open-source community
Cons:
- Requires more setup than SaaS alternatives
- No built-in session replay
- Newer platform with fewer integrations
- Self-hosting requires DevOps expertise
Pricing Reality Check:
SigNoz pricing is based on actual data ingested:
- Traces: $0.30/GB ingested
- Logs: $0.30/GB ingested
- Metrics: $0.10 per million samples
Estimated costs:
- Self-hosted: Free (plus infrastructure costs)
- 1K users: ~$10-30/month for cloud (based on actual usage)
- 10K users: $50-150/month
- 100K users: $200-600/month (significantly cheaper than alternatives)
Learn More:
- Frontend Logging with SigNoz - Complete guide to sending logs from your frontend application to SigNoz
- Frontend Tracing with SigNoz - Step-by-step instructions for sending traces and understanding user interactions
- Web Vitals Monitoring - Monitor Core Web Vitals (LCP, FID, CLS) using OpenTelemetry and SigNoz
Getting Started with SigNoz
You can choose between various deployment options in SigNoz. The easiest way to get started with SigNoz is SigNoz cloud. We offer a 30-day free trial account with access to all features.
Those who have data privacy concerns and can't send their data outside their infrastructure can sign up for either enterprise self-hosted or BYOC offering.
Those who have the expertise to manage SigNoz themselves or just want to start with a free self-hosted option can use our community edition.
Conclusion
Choosing the right frontend logging tool isn't about finding the "best" tool, it's about finding the right fit for your specific needs. Here's what we learned from our hands-on testing:
Start Simple: Don't over-engineer. If you're just starting, Sentry's free tier or SigNoz Cloud (starting at $49/month, which includes 163GB of logs/traces or 490M metric samples) provides everything you need. You can always upgrade as you grow.
Consider Total Cost: The sticker price is just the beginning. Factor in bundle size impact on performance, time spent configuring privacy settings, and the learning curve for your team.
Privacy Matters More Than Ever: With privacy regulations tightening globally, choosing a tool with strong privacy controls isn't optional. Default to tools that mask sensitive data automatically.
Open Standards Win Long-Term: Tools built on OpenTelemetry like SigNoz and Grafana provide flexibility and prevent vendor lock-in. This matters more as your application grows.
Performance Impact Is Real: Every kilobyte counts. Our testing showed up to 120ms additional load time with some tools. For e-commerce sites where every second counts, choose lightweight options.
The frontend logging landscape will continue evolving, but one thing remains constant: visibility into your application's behavior is non-negotiable. Whether you choose Sentry's developer-friendly approach, LogRocket's detailed replays, or SigNoz's open-source flexibility, the important thing is to start logging today. Your future self debugging that production issue at 2 AM will thank you.
Hope we answered all your questions regarding frontend logging tools. If you have more questions, feel free to use the SigNoz AI chatbot, or join our slack community.
You can also subscribe to our newsletter for insights from observability nerds at SigNoz, get open source, OpenTelemetry, and devtool building stories straight to your inbox.
