Top Better Stack Alternatives (2026) - Open Source and SaaS Options
TL;DR
- SigNoz offers all-in-one observability with OpenTelemetry-native support for logs, metrics, and traces, enabling deep signal correlation and fast queries on large datasets. It stands out with flexible deployment options, including self-hosting and managed cloud. SigNoz offers transparent usage-based pricing. Self-hosting can reduce SaaS spend but still incur infrastructure and operations costs.
- Datadog delivers comprehensive full-stack monitoring with over 1,000 integrations, AI-based anomaly detection, and features such as session replay and security. It provides broader enterprise capabilities than Better Stack, though its multi-tier pricing can lead to higher, less predictable costs at scale.
- Sentry specialises in error tracking with detailed stack traces, session replays, and release monitoring, providing deeper debugging across frontend and backend than Better Stack's general error logging. For teams focused primarily on code stability rather than full-stack observability, Sentry offers self-hosting options and predictable volume-based pricing.
Better Stack became popular by bringing uptime monitoring, log management, incident response, and on-call scheduling together in one place, with a clean interface. For smaller teams, this combination worked really well, as it saved them from having to piece together different tools.
But as infrastructure scales, some teams encounter limitations. Better Stack only offers a managed SaaS deployment, there's no self-hosted or open-source option for teams needing data residency control.
While the platform covers core observability, teams requiring deeper customisation (such as advanced trace correlation, custom retention policies, or complex alerting workflows) may find the feature set constrained compared to tools tailored to specific use cases.
Pricing can also become harder to predict at scale. Better Stack uses a multi-layered model: per-responder licensing for incident management and on-call, separate usage-based charges for telemetry (logs, traces, metrics, errors), and bundle tiers that trigger an upgrade to a more expensive tier when you exceed your plan's limits.
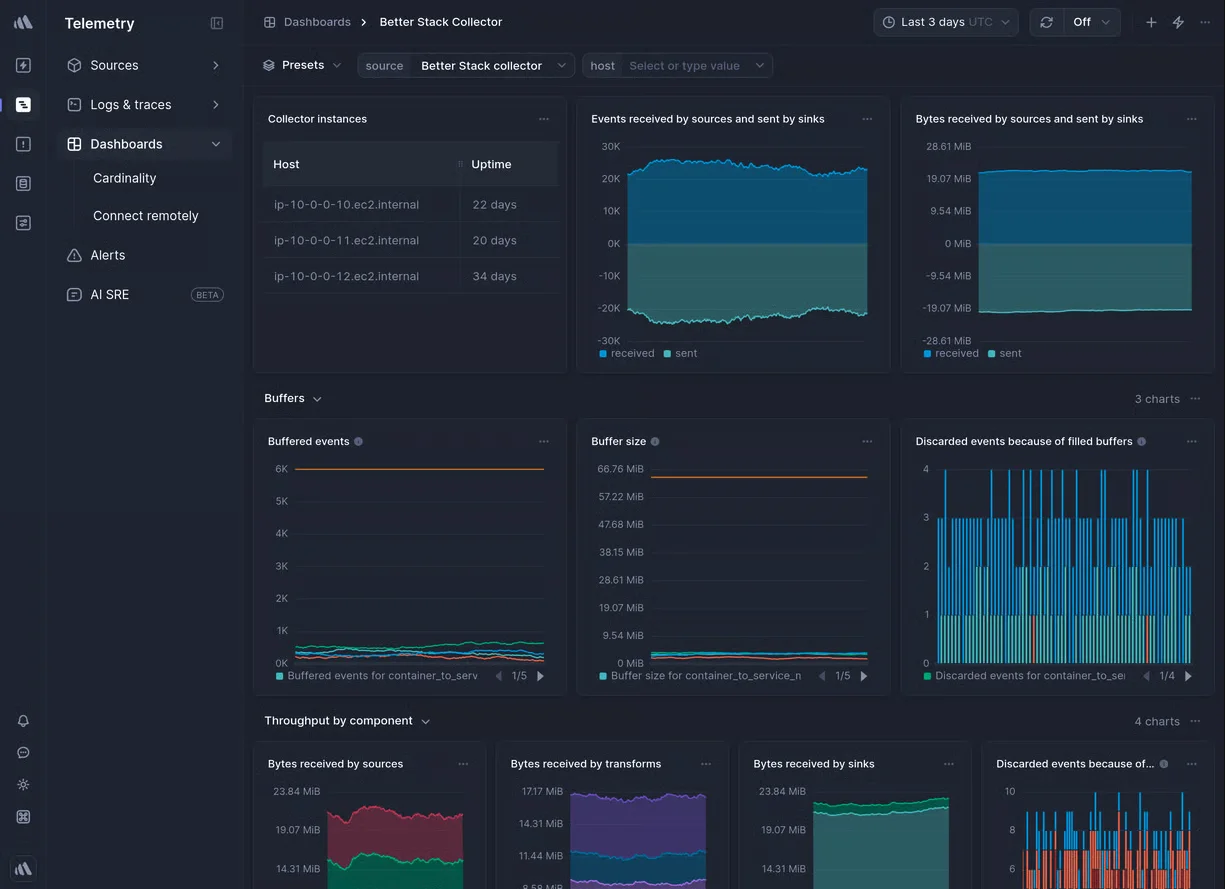
This guide walks through the top Better Stack alternatives, comparing them across three key areas: feature depth (all-in-one platforms versus specialised tools), deployment flexibility (SaaS-only versus self-hosted options), and cost predictability (transparent pricing models that scale with your infrastructure).
Category 1: Flexible Hosting Choices
These options let you run logs/metrics/traces outside a single vendor's SaaS, either self-hosted or managed in your cloud account. This gives you control over data residency, costs, and infrastructure while avoiding vendor lock-in.
SigNoz
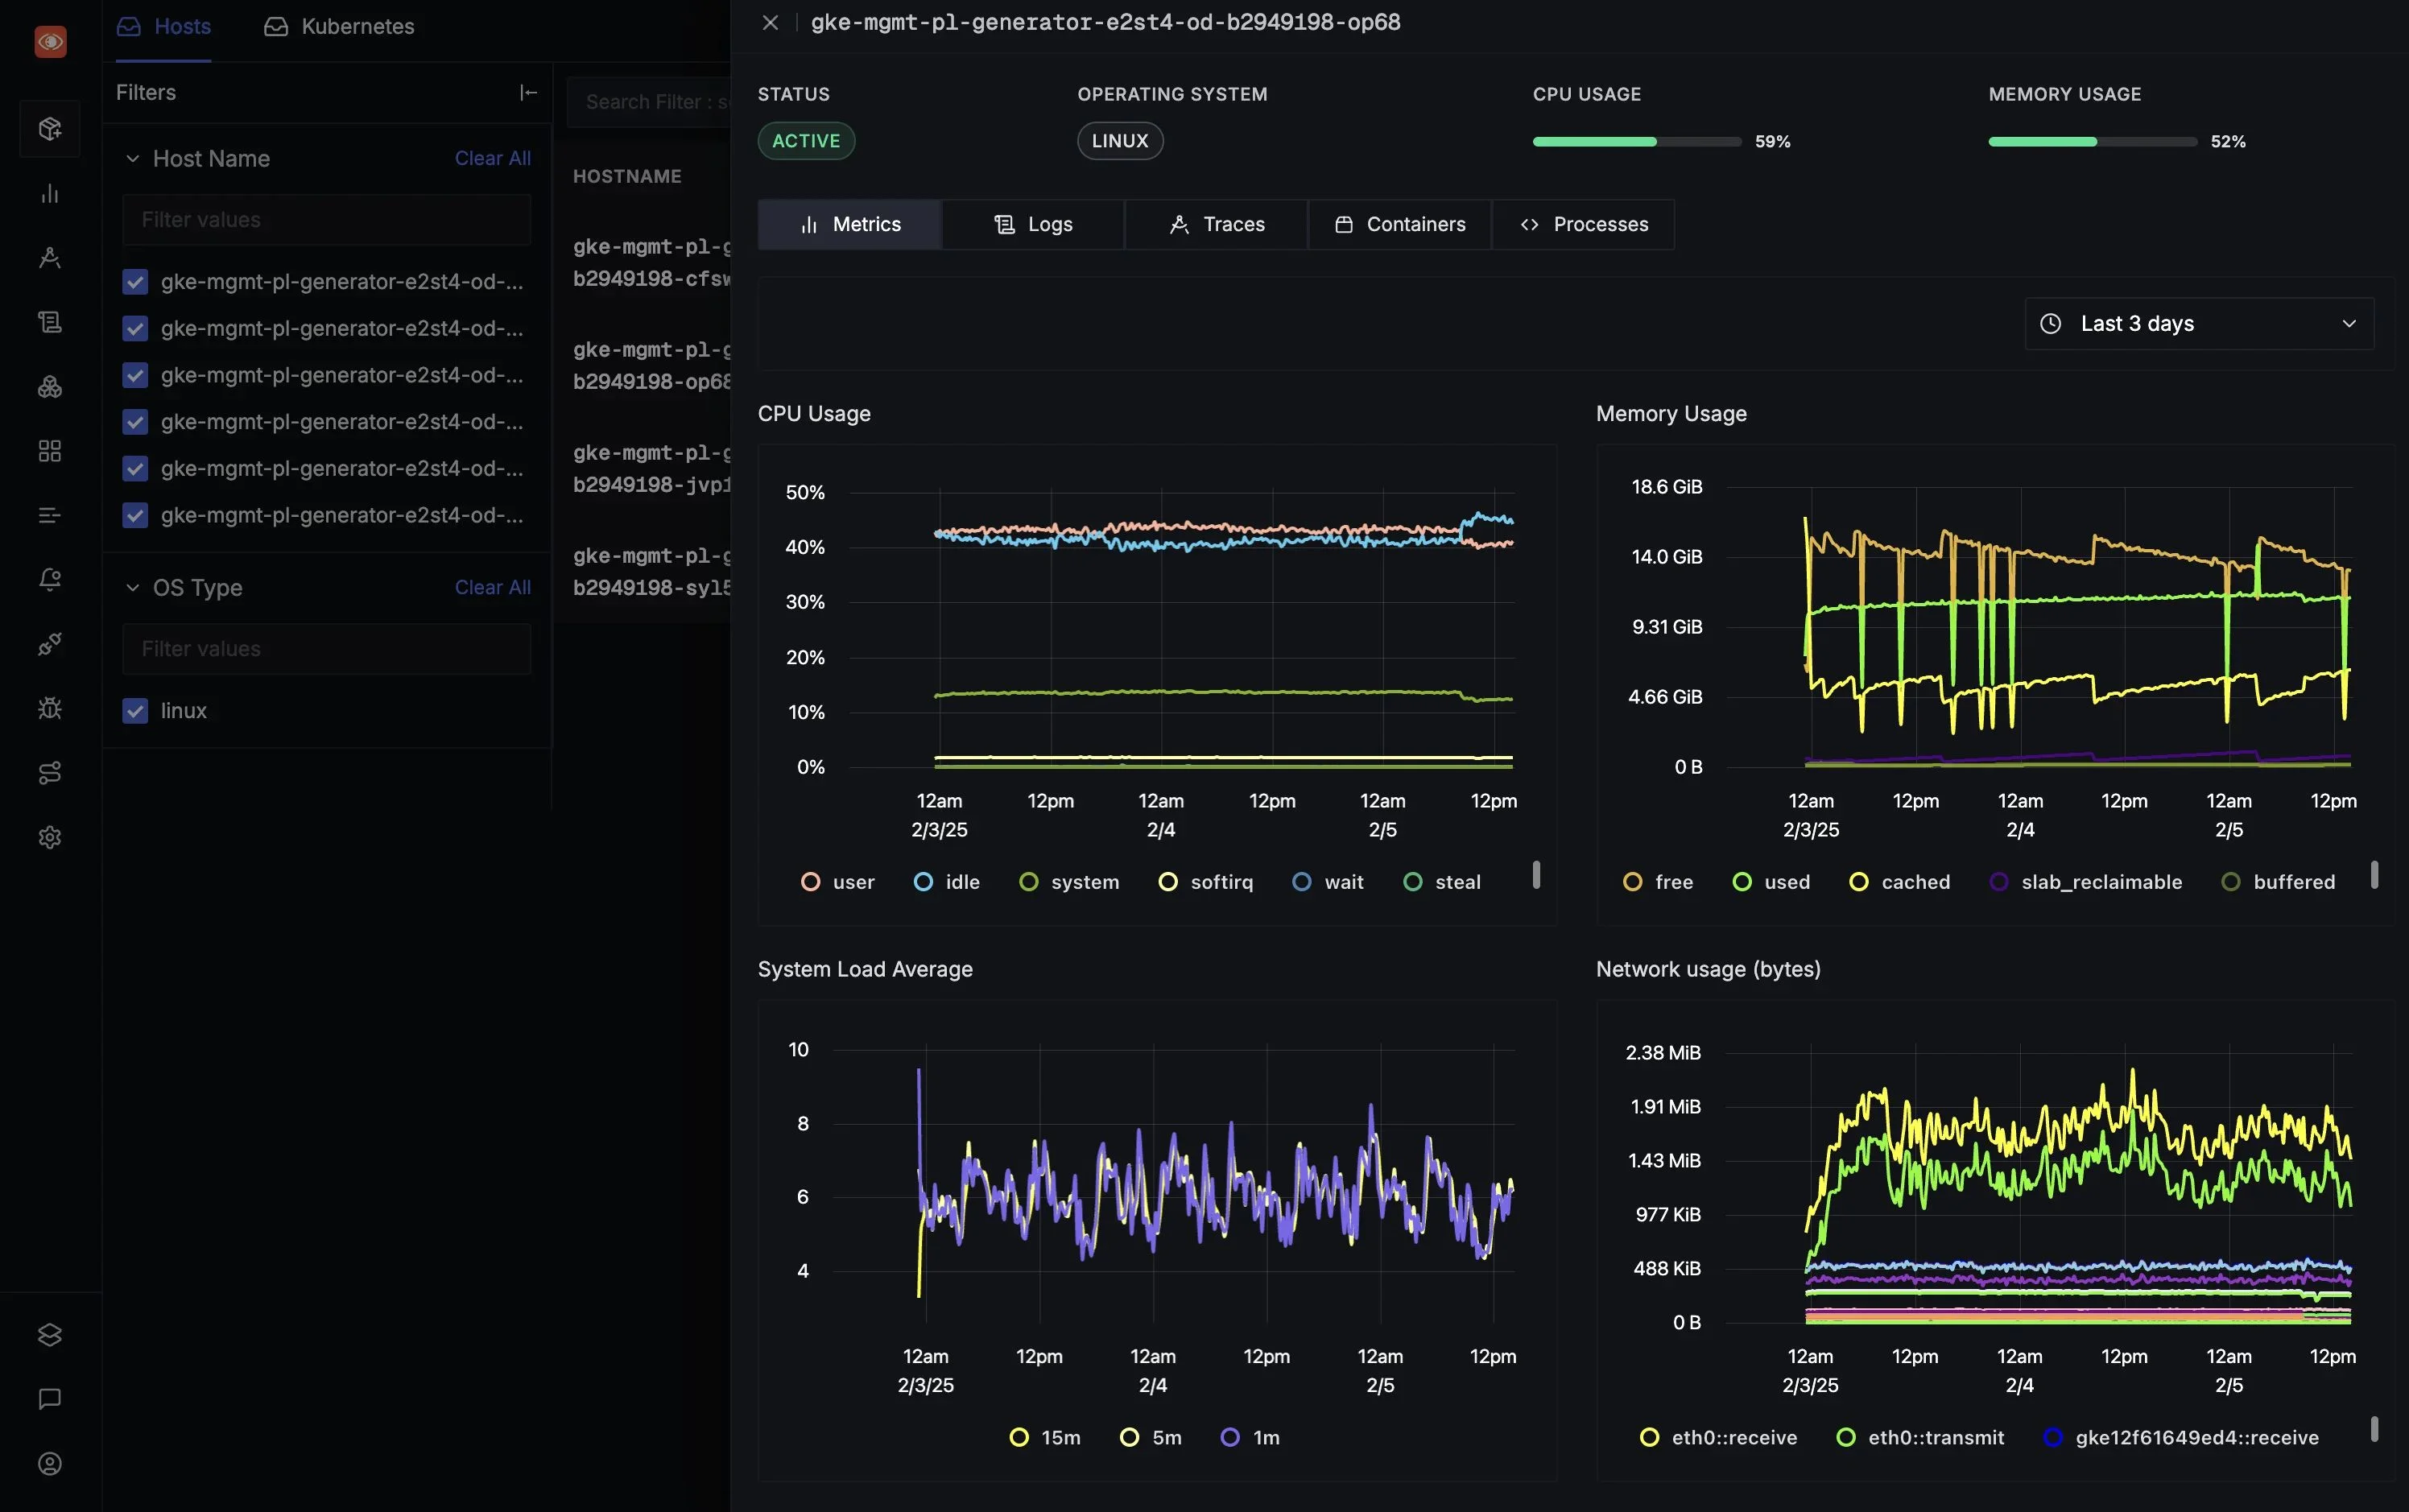
SigNoz is an all-in-one observability platform built entirely around OpenTelemetry (OTel). It brings logs, metrics, and distributed traces together into a single unified view, making it well-suited for teams that need deep correlation across signals.
Key Features
- OpenTelemetry Native: Works with standard OpenTelemetry collectors and SDKs without requiring special agents. This means you can instrument your applications without getting locked into proprietary formats.
- Correlated Signals: By housing metrics, traces, and logs in a single pane of glass, SigNoz allows you to follow a request's journey across microservices and identify root causes without toggling between different tools
- Fast Queries on Large Datasets: A columnar database that handles high-cardinality data well. You get quick results even when searching large datasets.
Why consider SigNoz over Better Stack?
SigNoz offers flexible deployment, which means you can run it in the cloud as a managed service or self-host the community edition. Additionally, you can use enterprise options, including BYOC and supported self-hosting. Better Stack is primarily a managed service and doesn’t offer a self-managed open-source/on-prem edition, though enterprise customers can request custom cluster deployments (e.g., in their VPC / with their own bucket).
Unlike the mixed approach of Better Stack (Bundled + Ingestion-based), SigNoz Cloud starts at $49/month, and beyond the included usage, logs and traces are billed at $0.30/GB and metrics at $0.10 per million samples.
If you self-host SigNoz, you avoid SigNoz Cloud usage charges, but you still pay infrastructure and operational costs, so savings depend on your scale and how you run the stack.
Get Started with SigNoz
You can choose between various deployment options in SigNoz. The easiest way to get started with SigNoz is SigNoz Cloud. We offer a 30-day free trial account with access to all features.
Those with data privacy concerns who can’t send their data outside their infrastructure can sign up for either the enterprise self-hosted or BYOC offering.
Those with the expertise to manage SigNoz themselves, or who want to start with a free, self-hosted option, can use our community edition.
Elastic Stack (ELK)
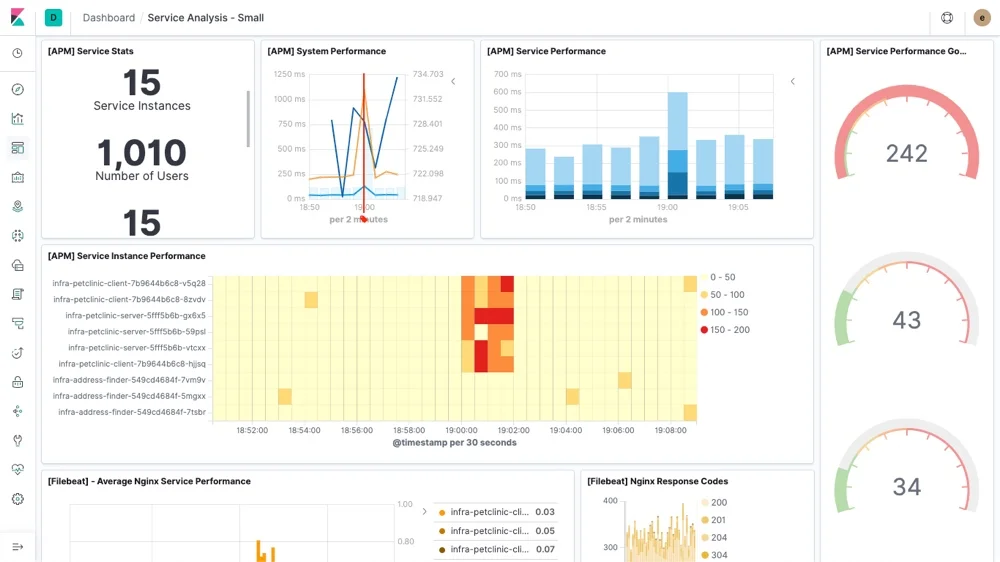
The Elastic Stack is an open-source platform that combines Elasticsearch (for storage and search), Logstash (for processing data), Kibana (for visualisations), and Beats (for collecting logs). While the ELK stack is highly scalable, managing it at a massive enterprise level requires significant expertise and ongoing effort.
Key Features
- Powerful Search: Elasticsearch uses Lucene for fast, ranked search results. This makes it excellent for digging through unstructured logs or running detailed investigations across your data.
- Flexible Dashboards: Kibana lets you build custom dashboards, create interactive visualisations, and explore your data through heatmaps and time-series charts. You can pull together logs, metrics, and traces into a single view.
Why consider Elastic Stack over Better Stack?
You can run Elastic Stack on your own servers or use their managed cloud service. Just like SigNoz, self-hosting gives you complete control over where your data lives and how much you spend. The cloud option charges based on the resources you use (like storage and compute), which many teams find easier to budget for than per-GB pricing that climbs with volume.
In terms of feature breadth, it matches Better Stack's core telemetry (logs, metrics, traces) and offers strong native OpenTelemetry support. It extends to robust built-in APM and highly customizable data processing pipelines for log enrichment. The tradeoff is that you'll need to configure these pieces yourself, but that flexibility is exactly what teams with heavy search requirements or complex data pipelines are looking for.
Grafana Stack (with Loki, Tempo, and Prometheus)
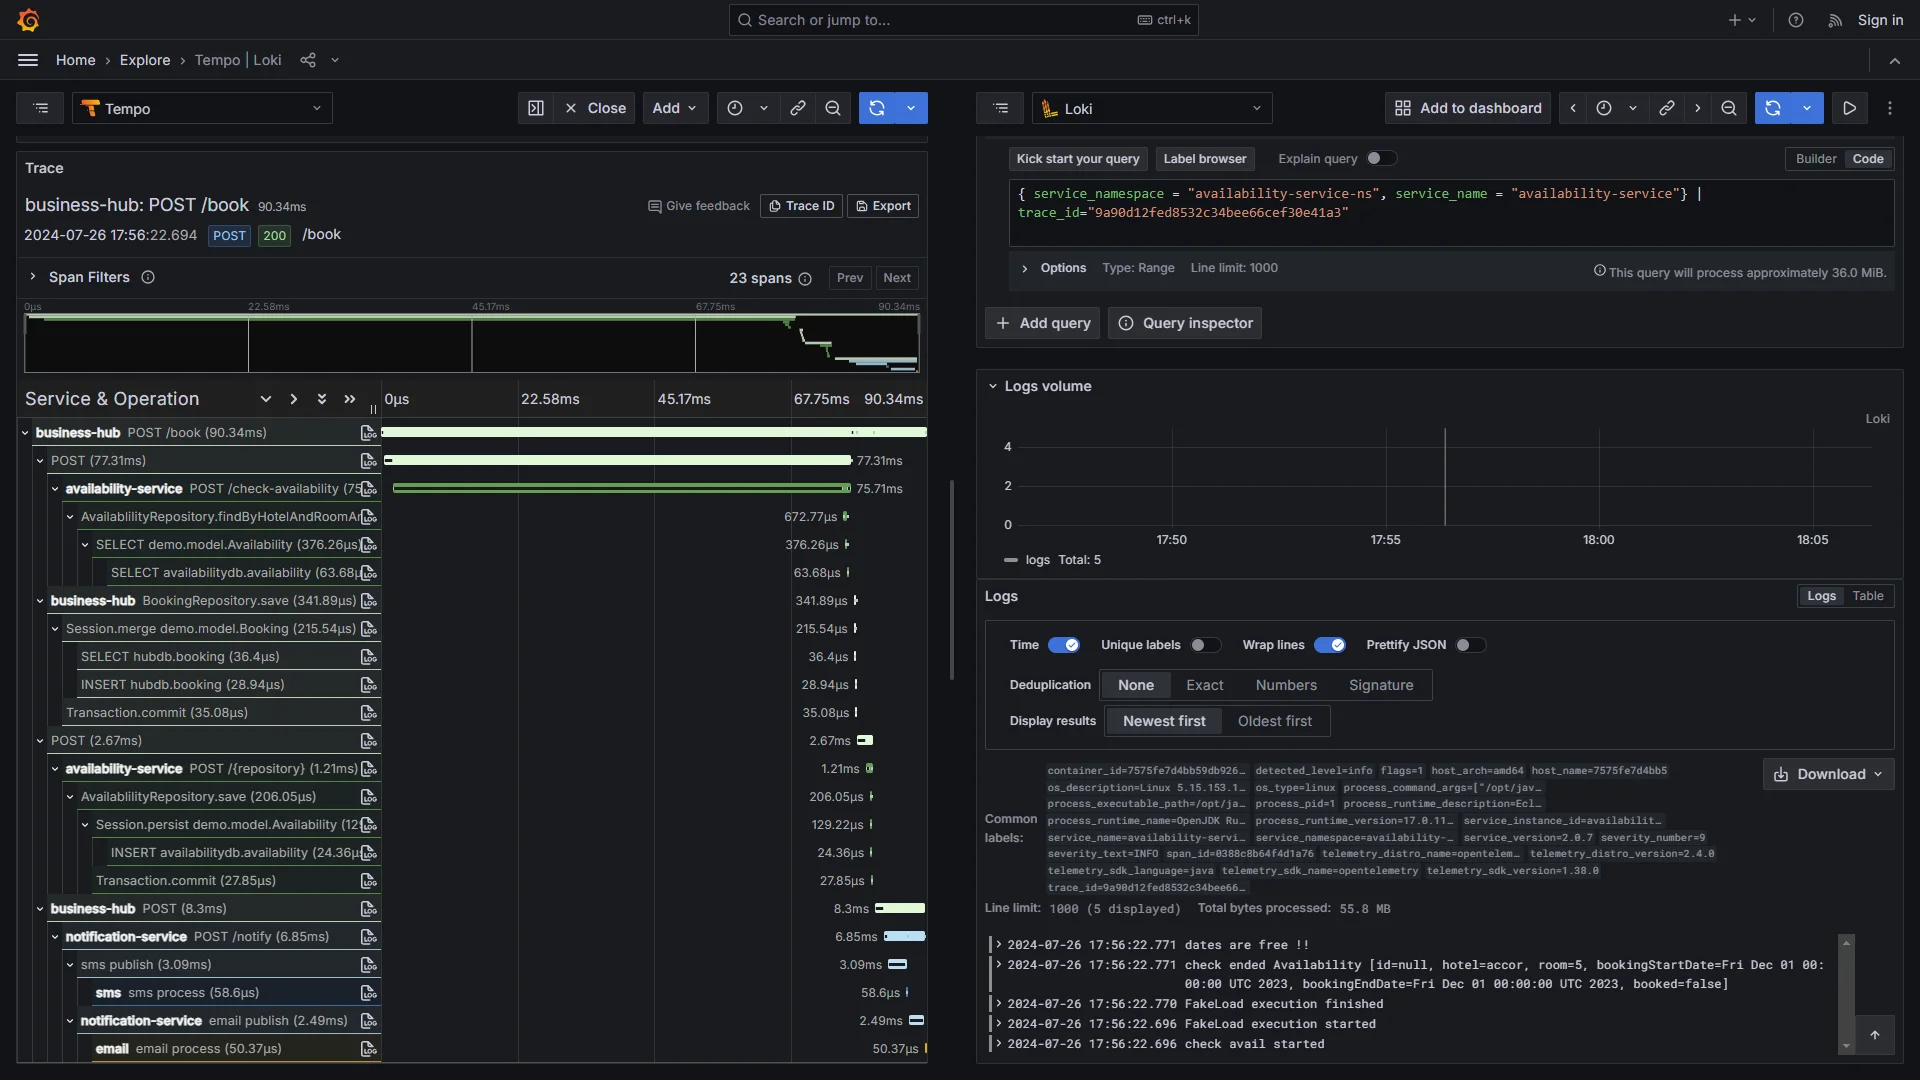
The Grafana stack brings together Loki for logs, Tempo for traces, and Prometheus for metrics, all displayed through Grafana's dashboards. It's popular with teams running Kubernetes or cloud-native setups who need something flexible they can adapt as requirements change.
Key Features
- Smart Log Storage: Loki only indexes metadata, such as labels (environment, service name), not full text. This keeps storage costs down and lets you use cheap object storage like S3 for huge log volumes.
- Build Your Own Dashboards: Grafana lets you create custom views that combine logs, traces, and metrics in one place. You can set up alerts and tap into a large plugin ecosystem for specialised analysis.
- Powerful Metrics: Prometheus handles time-series data well, with PromQL for writing detailed queries. Tempo adds distributed tracing without heavy overhead.
Why consider Grafana Stack over Better Stack?
Grafana Stack lets you host everything yourself, you can run it on your own servers or in the cloud, and keep complete control over your data. Since the core stack is open source, you only pay for infrastructure (if you self-host the OSS components, your cost is infrastructure and ops, if you use managed offerings, pricing depends on the vendor's plan).
The tradeoff is assembly required: you’re connecting Loki, Tempo, Prometheus, and Grafana rather than getting a single managed product out of the box. But if you want advanced PromQL-driven metric analysis (percentiles, label-based breakdowns, recording rules) and the ability to tune every layer (storage, retention, pipelines) rather than working within a managed service’s packaging, the Grafana stack is a better fit.
Category 2: Full-Stack and Advanced SaaS Platforms
The platforms listed below offer comprehensive, enterprise-ready features with AI-powered insights designed for large-scale operations but only offers a SaaS-based solution with no self-hosting option.
Datadog
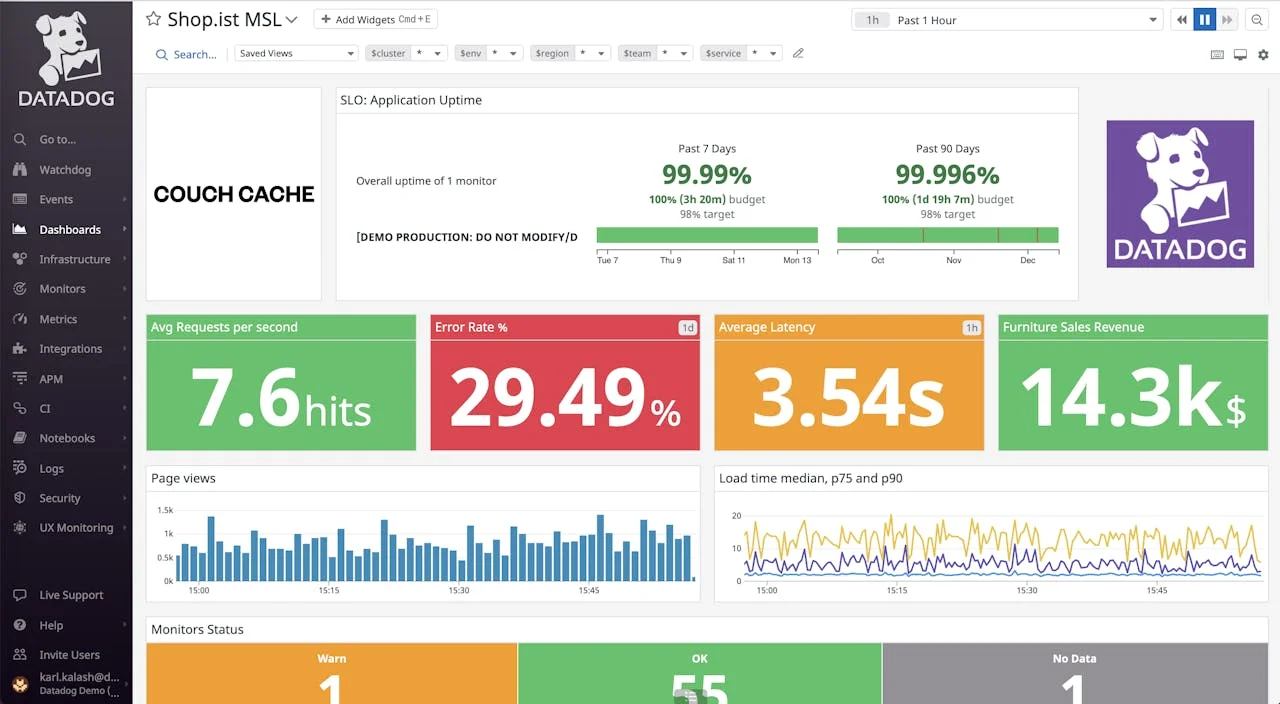
Datadog is a full-featured observability platform that covers infrastructure monitoring, application performance, logs, and security. It's known for its massive integration library, real-time dashboards, and its ability to connect everything into a single view.
Key Features
- 1,000+ Integrations: Connects virtually to any cloud service, database, or tool you're using. Smart tagging helps you filter and correlate data quickly, with pre-built dashboards to get started fast.
- AI-Powered Anomaly Detection: Automatically identifies unusual patterns in your metrics and logs, alerting your team to potential issues before they escalate into incidents.
Why consider Datadog over Better Stack?
Datadog offers broader capabilities than Better Stack. You get advanced features such as session replay for real-user monitoring, synthetic testing, security monitoring, and Watchdog AI for automatic anomaly detection, all connected across metrics, logs, traces, and frontend monitoring. This makes it a strong fit for complex containerised environments or hybrid cloud setups that require deep visibility across the entire environment.
The tradeoff is that Datadog uses per-host, per-GB, and per-million-event pricing across different products (APM, logs, infrastructure, etc.), each with its own rates. For high-volume workloads, these costs can add up quickly, and Datadog’s pricing can be harder to forecast because many capabilities are priced as separate products/units (hosts, ingested GB, events, etc.). Teams often need to carefully monitor their Datadog spend to avoid unexpected bills as their infrastructure scales.
New Relic
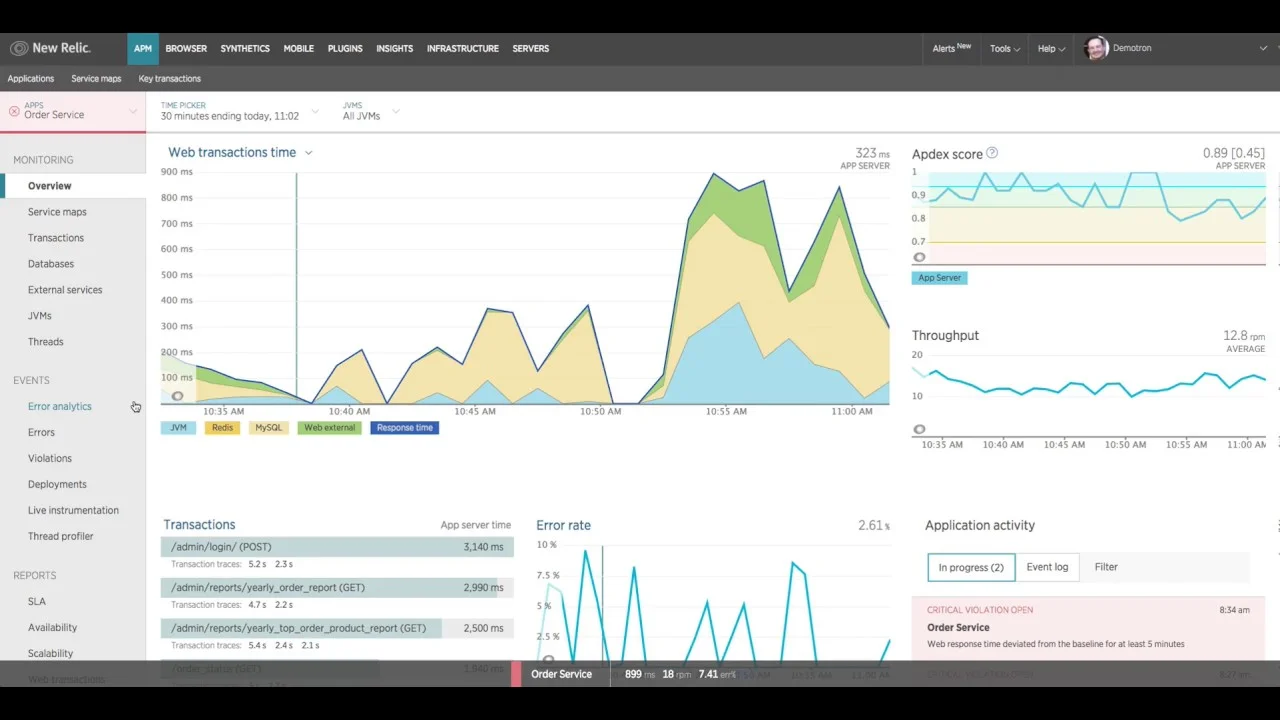
New Relic brings together performance monitoring, user experience tracking, infrastructure oversight, and AI-powered alerts to give you a complete view of your system.
Key Features
- Code-Level Visibility with AI Troubleshooting: Traces issues down to specific lines of code, then uses AI to group related alerts, identify root causes, and suggest fixes, making it faster to resolve bottlenecks before they affect users.
- Business Context: Links monitoring data to business metrics like conversion rates or transaction volumes, so you understand the real-world impact of technical issues.
- Full-Stack Coverage: Combines APM, infrastructure monitoring, browser tracking (RUM), synthetic tests, logs, and serverless monitoring in one platform with usage-based pricing.
Why consider New Relic over Better Stack?
New Relic runs entirely in the cloud with no self-hosted option. As of early 2026, pricing includes 100 GB of free data ingest per month, then $0.40 per GB for Original Data beyond that (or $0.60 per GB for the Data Plus option). User pricing depends on role (e.g., Core users at $49 and higher tiers for full platform access, basic viewing can be $0 depending on plan).
Where New Relic stands out from Better Stack is its feature breadth, which goes beyond simple logging and tracing. You get built-in real-user monitoring, synthetic testing, code profiling, and AI-powered incident management. This makes it a strong fit for teams that want a single platform covering everything from frontend performance to backend infrastructure, rather than piecing together multiple tools.
Category 3: Specialised Tools for Specific Needs
These tools solve particular problems really well. They're better than others when you want to build a custom stack that addresses your exact challenges without paying for features you won't use.
Sentry
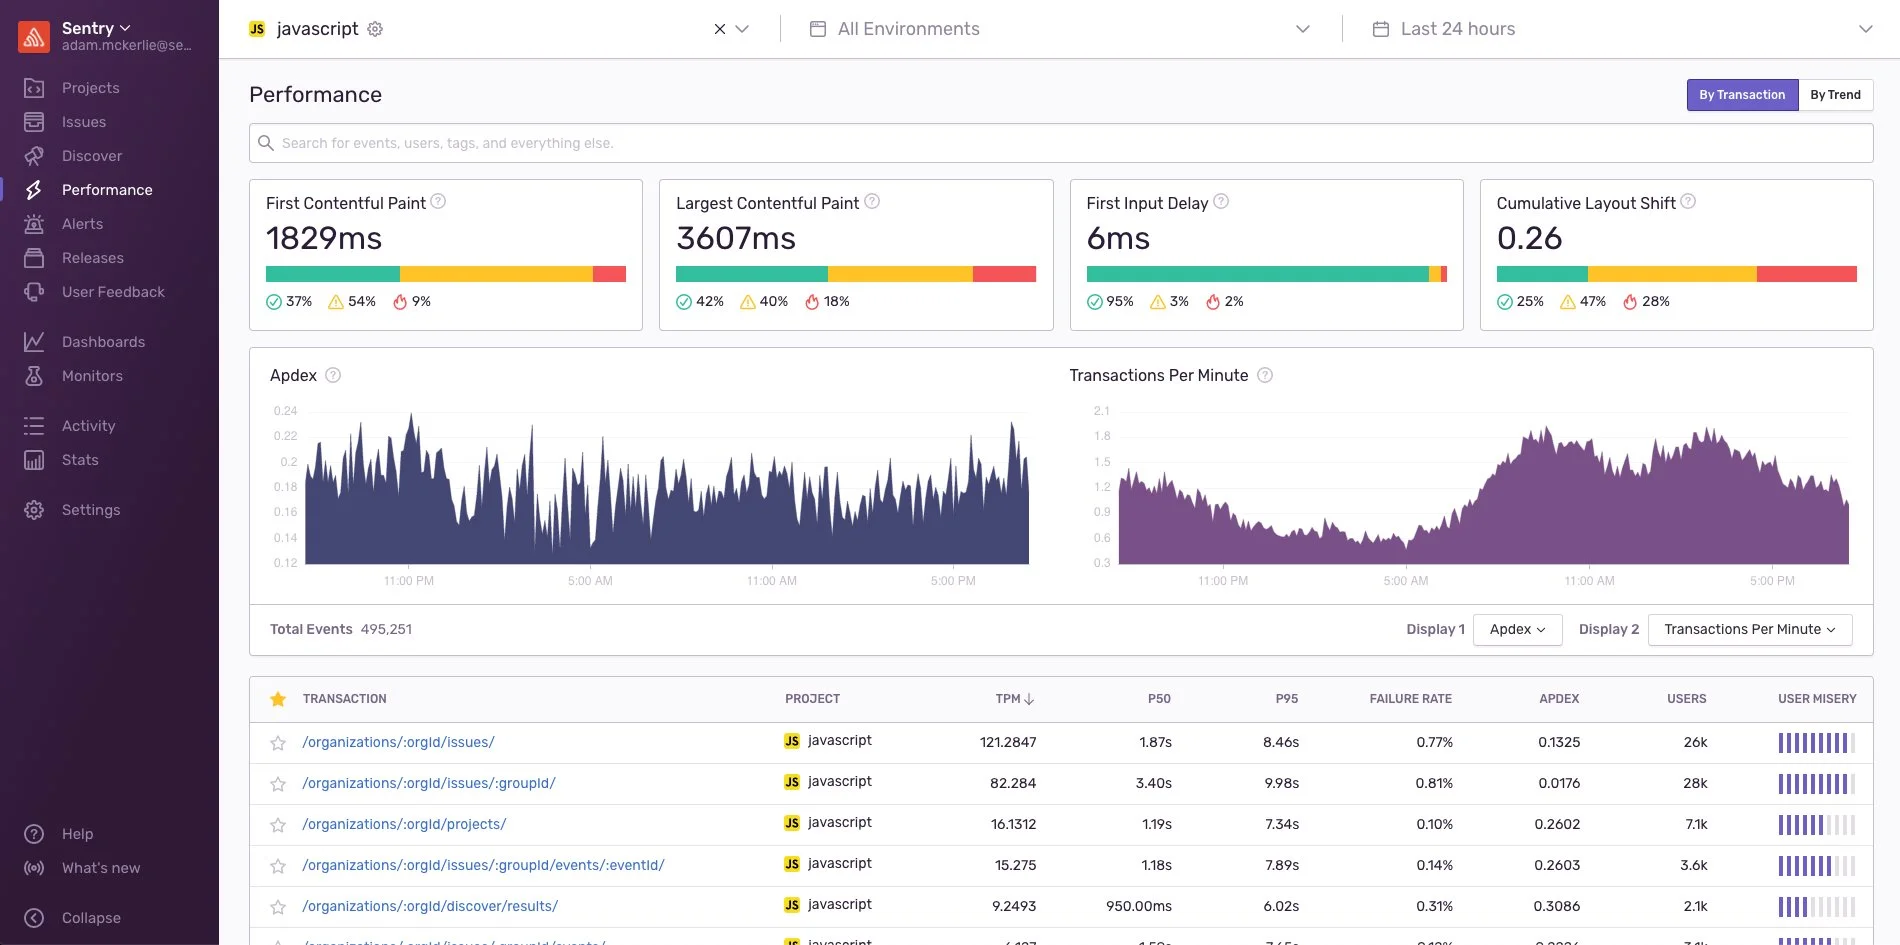
Sentry focuses on catching errors and tracking performance issues. It provides developers with detailed information about crashes and slowdowns, helping them keep their apps running smoothly.
Key Features
- Detailed Event Paths: Shows you exactly what led to an error, including stack traces and what the user was doing, making bugs easier to reproduce and fix.
- Version Monitoring: Tracks how each release performs, so you can quickly spot if a new deployment introduced more errors or performance problems.
- User Session Replays: Let you watch a visual replay of what users did before hitting an issue, with privacy protections built in.
Why consider Sentry over Better Stack?
Sentry goes deeper into debugging than most general monitoring tools like Better Stack. Sentry supports both cloud and self-hosted deployments (self-hosted deployments require operational capacity).
Pricing is based on the number of events you track. There's a generous free tier, and paid plans start at $26/month for teams. Since you're paying for specific volumes rather than broad usage tiers like Better Stack, costs tend to be more predictable as your traffic grows.
For debugging, Sentry offers features beyond basic error logging, such as visual session replays, release comparisons, and unified tracking across the frontend and backend. This makes it particularly strong for teams that need to diagnose issues quickly and maintain code stability across deployments, where Better Stack's error tools might feel more surface-level.
PagerDuty
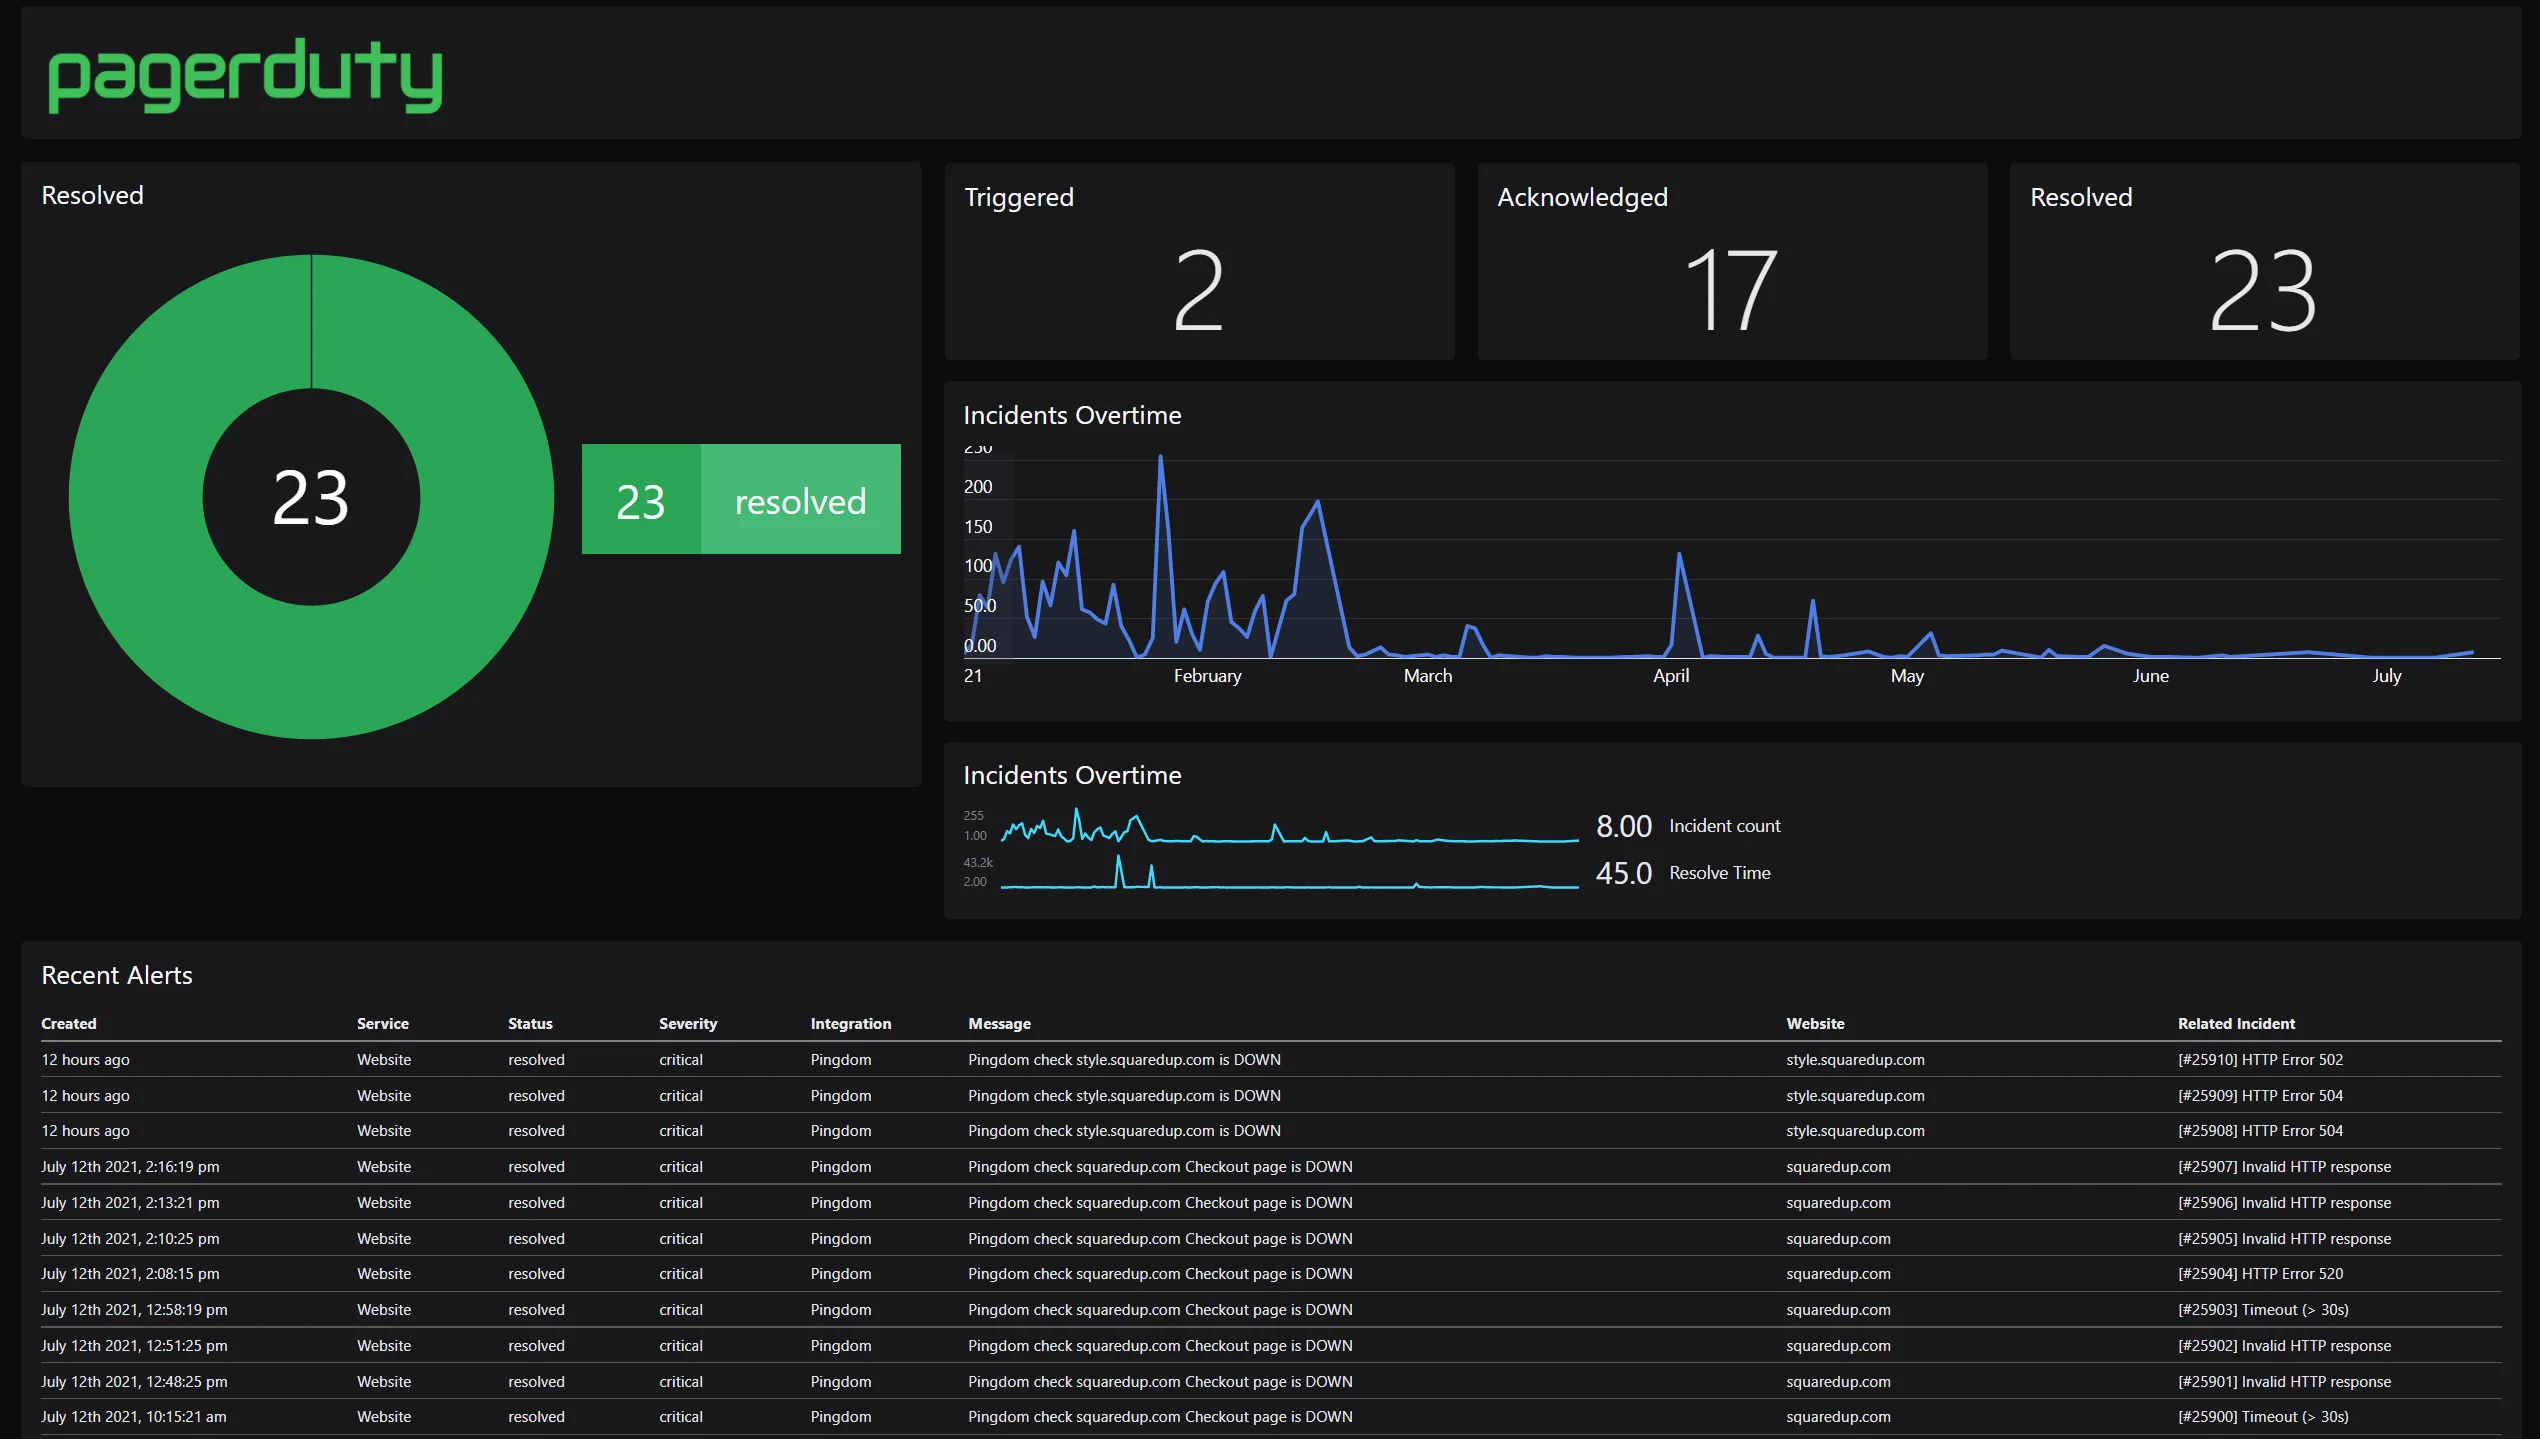
PagerDuty focuses on incident response and team coordination. It automates alerts, manages schedules, and helps teams resolve issues faster when things go wrong.
Key Features
- Smart Alert Routing: Manages on-call rotations, automatically escalates alerts, and handles complex scheduling so the right person is notified at the right time.
- Noise Reduction: Filters out duplicate alerts and groups related events together, so your team isn't overwhelmed by notification spam.
- Wide Integration Support: Connects with hundreds of tools across monitoring, chat, and ITSM ecosystems (integration counts vary by source/context).
Why consider PagerDuty over Better Stack?
PagerDuty delivers more advanced incident handling than Better Stack, with enterprise-level tools for permissions, audits, runbooks, and stakeholder updates, all designed for global teams and complex scenarios that Better Stack's simpler on-call features might not fully support. It operates as a fully managed SaaS without self-hosting.
As of Jan 2026, pricing starts at $21 per user/month for professional plans (with a free tier for up to 5 users), plus add-ons for extras like AIOps. In scope, PagerDuty extends beyond Better Stack's incident basics by emphasising noise-free alerting, detailed escalation chains, and analytics for reducing resolution times, making it a powerhouse for high-stakes environments.
Summary
| Tool | Core Focus | Key Advantages Over Better Stack |
|---|---|---|
| SigNoz | All-in-one OTel Native | Performance at scale via columnar backend (efficient high-cardinality queries). Offers flexible deployment (cloud & self-hosted options) and cost savings (no ingestion fees for self-hosting) compared to Better Stack's SaaS-only model. |
| Elastic Stack (ELK) | Search & Analytics | Powerful search capabilities (Lucene indexing) for unstructured logs and detailed investigations. Offers deployment flexibility (self-hosted control) and highly customizable data pipelines for log enrichment. |
| Grafana Stack | Modular Ecosystem | Total control via self-hosting (data residency) and cost efficiency (open source core avoids per-GB ingestion fees). strong metrics capabilities (PromQL) and modularity for teams wanting to tweak setups beyond Better Stack's managed limits. |
| Datadog | Full-Stack Enterprise | Includes session replay, security monitoring, and synthetic testing. Features advanced AI/Anomaly detection (Watchdog) and a massive integration library (1,000+) that exceeds Better Stack's scope. |
| New Relic | Full-Stack & Business | Feature breadth (RUM, code profiling, synthetic testing) and Business Context features that link telemetry to business outcomes. Offers deeper AI-powered incident management than Better Stack’s core logging/tracing focus. |
| Sentry | Error Tracking | Deep debugging via visual session replays and release comparisons. Specializes in crash reporting (stack traces, version monitoring) that goes significantly deeper into code stability than Better Stack's general error logging. |
| PagerDuty | Incident Response | Advanced incident handling with noise reduction, complex scheduling, and detailed escalation chains. Provides enterprise-level workflows (audits, runbooks) that go far beyond Better Stack’s simpler on-call features. |
Hope we answered all your questions about the better stack alternatives. If you have more questions, feel free to use the SigNoz AI chatbot or join our Slack community.
You can also subscribe to our newsletter for insights from observability nerds at SigNoz, and get open-source, OpenTelemetry, and devtool-building stories straight to your inbox.
