Datadog vs Sentry - Which Monitoring Tool to Choose? [2026 Guide]
Datadog and Sentry are monitoring tools but with different use cases. Datadog is tailored towards application performance and full stack observability of systems while Sentry specializes in identifying and reporting application errors.
In this post, I have compared Datadog and Sentry on important features like error monitoring, APM, log management, etc.
I instrumented a sample Python Application and sent data to both Datadog and Sentry to evaluate my experience. Some takeaways are subjective and based on personal preference.
Datadog vs Sentry: Overview
Here’s a quick overview of the overall platform features and functionality of Datadog and Sentry.
| Features | Datadog | Sentry |
|---|---|---|
| APM | ✅ | ✅ |
| Infrastructure Monitoring | ✅ | ❌ |
| Session Replay | ✅ | ✅ |
| Profiling | ✅ | ✅ |
| Open-Source Version | ❌ | ✅ |
| Application Security | ✅ | ❌ |
| Log Management | ✅ | 🟡 |
| Alerting | ✅ | ✅ |
| OpenTelemetry Support | 🟡 | 🟡 |
| Error Monitoring | ✅ | ✅ |
| Incident Management | ✅ | ❌ |
| Cloud SIEM | ✅ | ❌ |
| Real User Monitoring | ✅ | ❌ |
| Cron Monitoring | ❌ | ✅ |
| 14-days Free Trial | ✅ | ✅ |
✅ - Available
❌ - Not Available
🟡 - Limited
Error Monitoring: Sentry
Datadog
Datadog's error monitoring system provides detailed insights into error patterns, including the frequency, impact, and root causes. This aids in quicker and more effective troubleshooting, enabling the tracking, triage, and debugging of errors with ease.
One of its key features is its error grouping capability. This allowed it to group similar errors coming from my application into a single issue for easy identification of important errors and noise reduction. It also allows for the creation of error tracking monitors which can alert you when an issue in your application starts.
Sentry
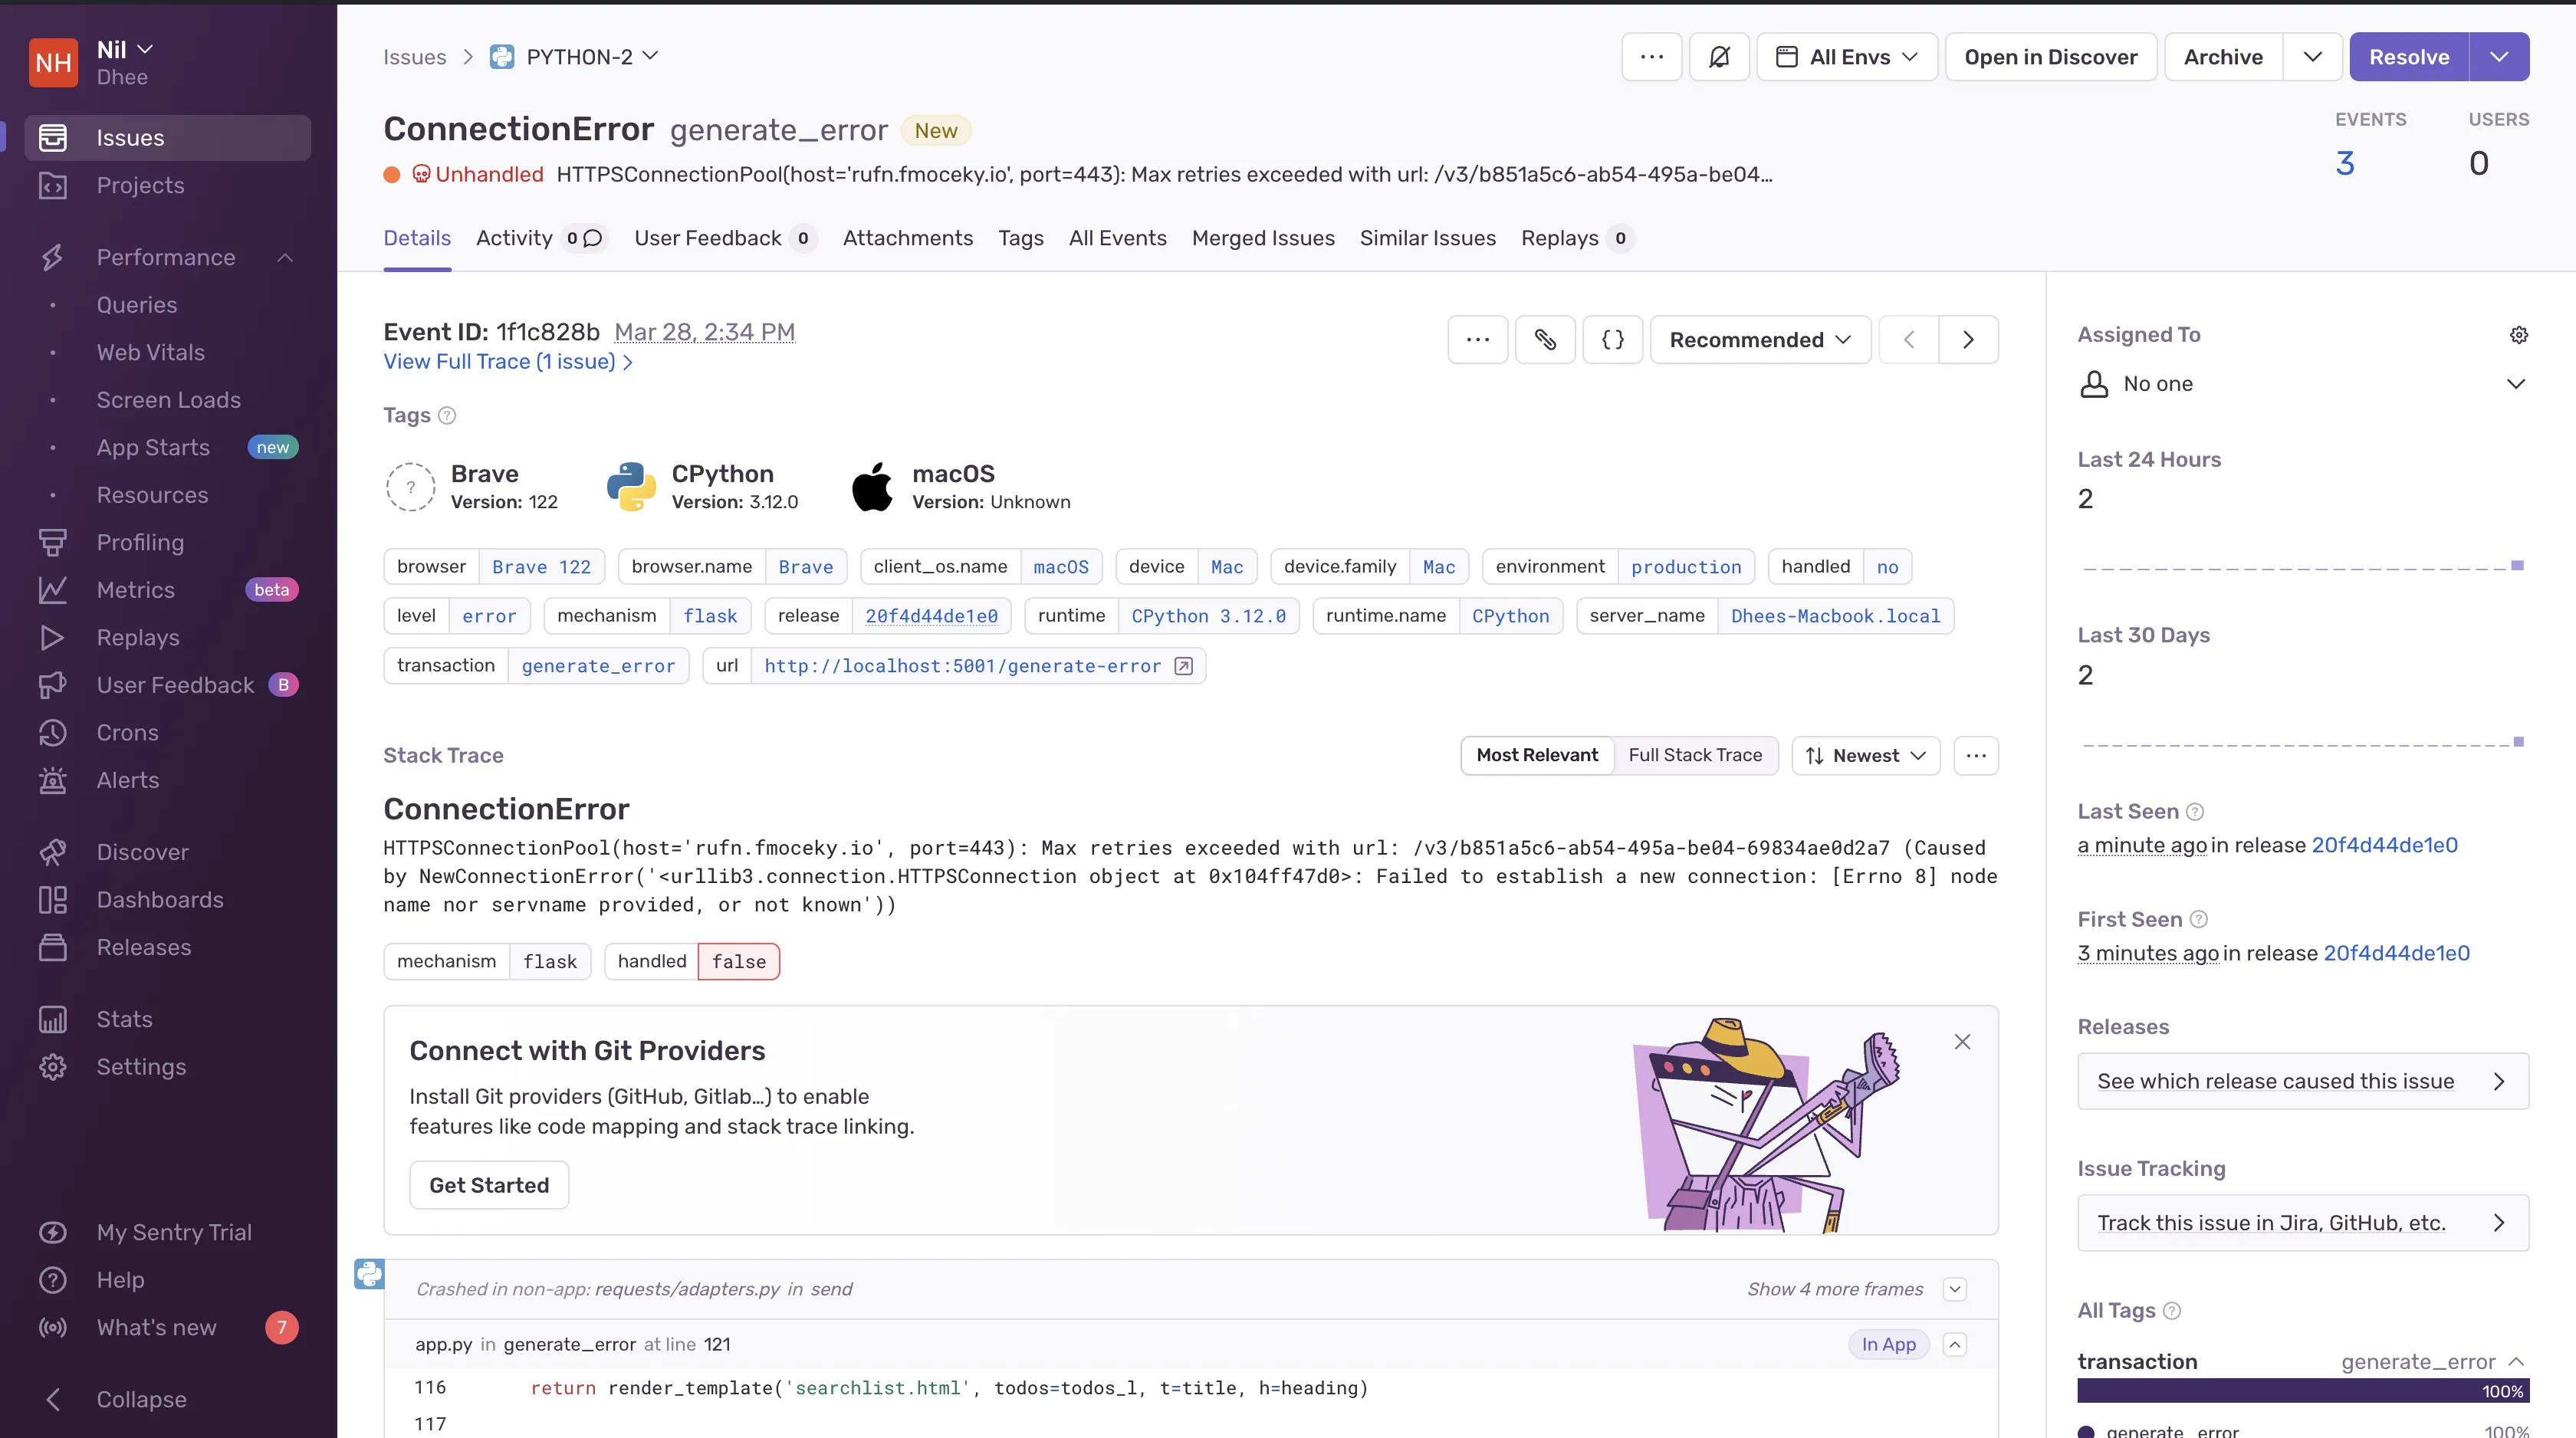
Sentry performs error monitoring by capturing errors, uncaught exceptions, and unhandled rejections, as well as other types of errors that are displayed as issues. An error issue in Sentry is a grouping of error events.
The Issues UI displays information about errors and performance problems in your application. It allows you to filter by properties such as browser, device, impacted users, or whether an error is unhandled. Selecting an issue provides you with details of that issue. For my application, it provided information on what the error message was, when it first occurred, tags, and more.
Sentry excels better at error monitoring compared to Datadog. The reason for this is Sentry's primary focus on application-level error tracking and performance monitoring. It is specifically designed to capture, aggregate, and analyze errors and exceptions in real-time, providing developers with detailed insights into application issues.
APM: Datadog
Datadog
Datadog’s APM provides deep visibility into your applications, enabling you to identify performance bottlenecks, troubleshoot issues, and optimize your services. With distributed tracing, out-of-the-box dashboards, and seamless correlation with other telemetry data, Datadog APM helps ensure the best possible performance and user experience for your applications.
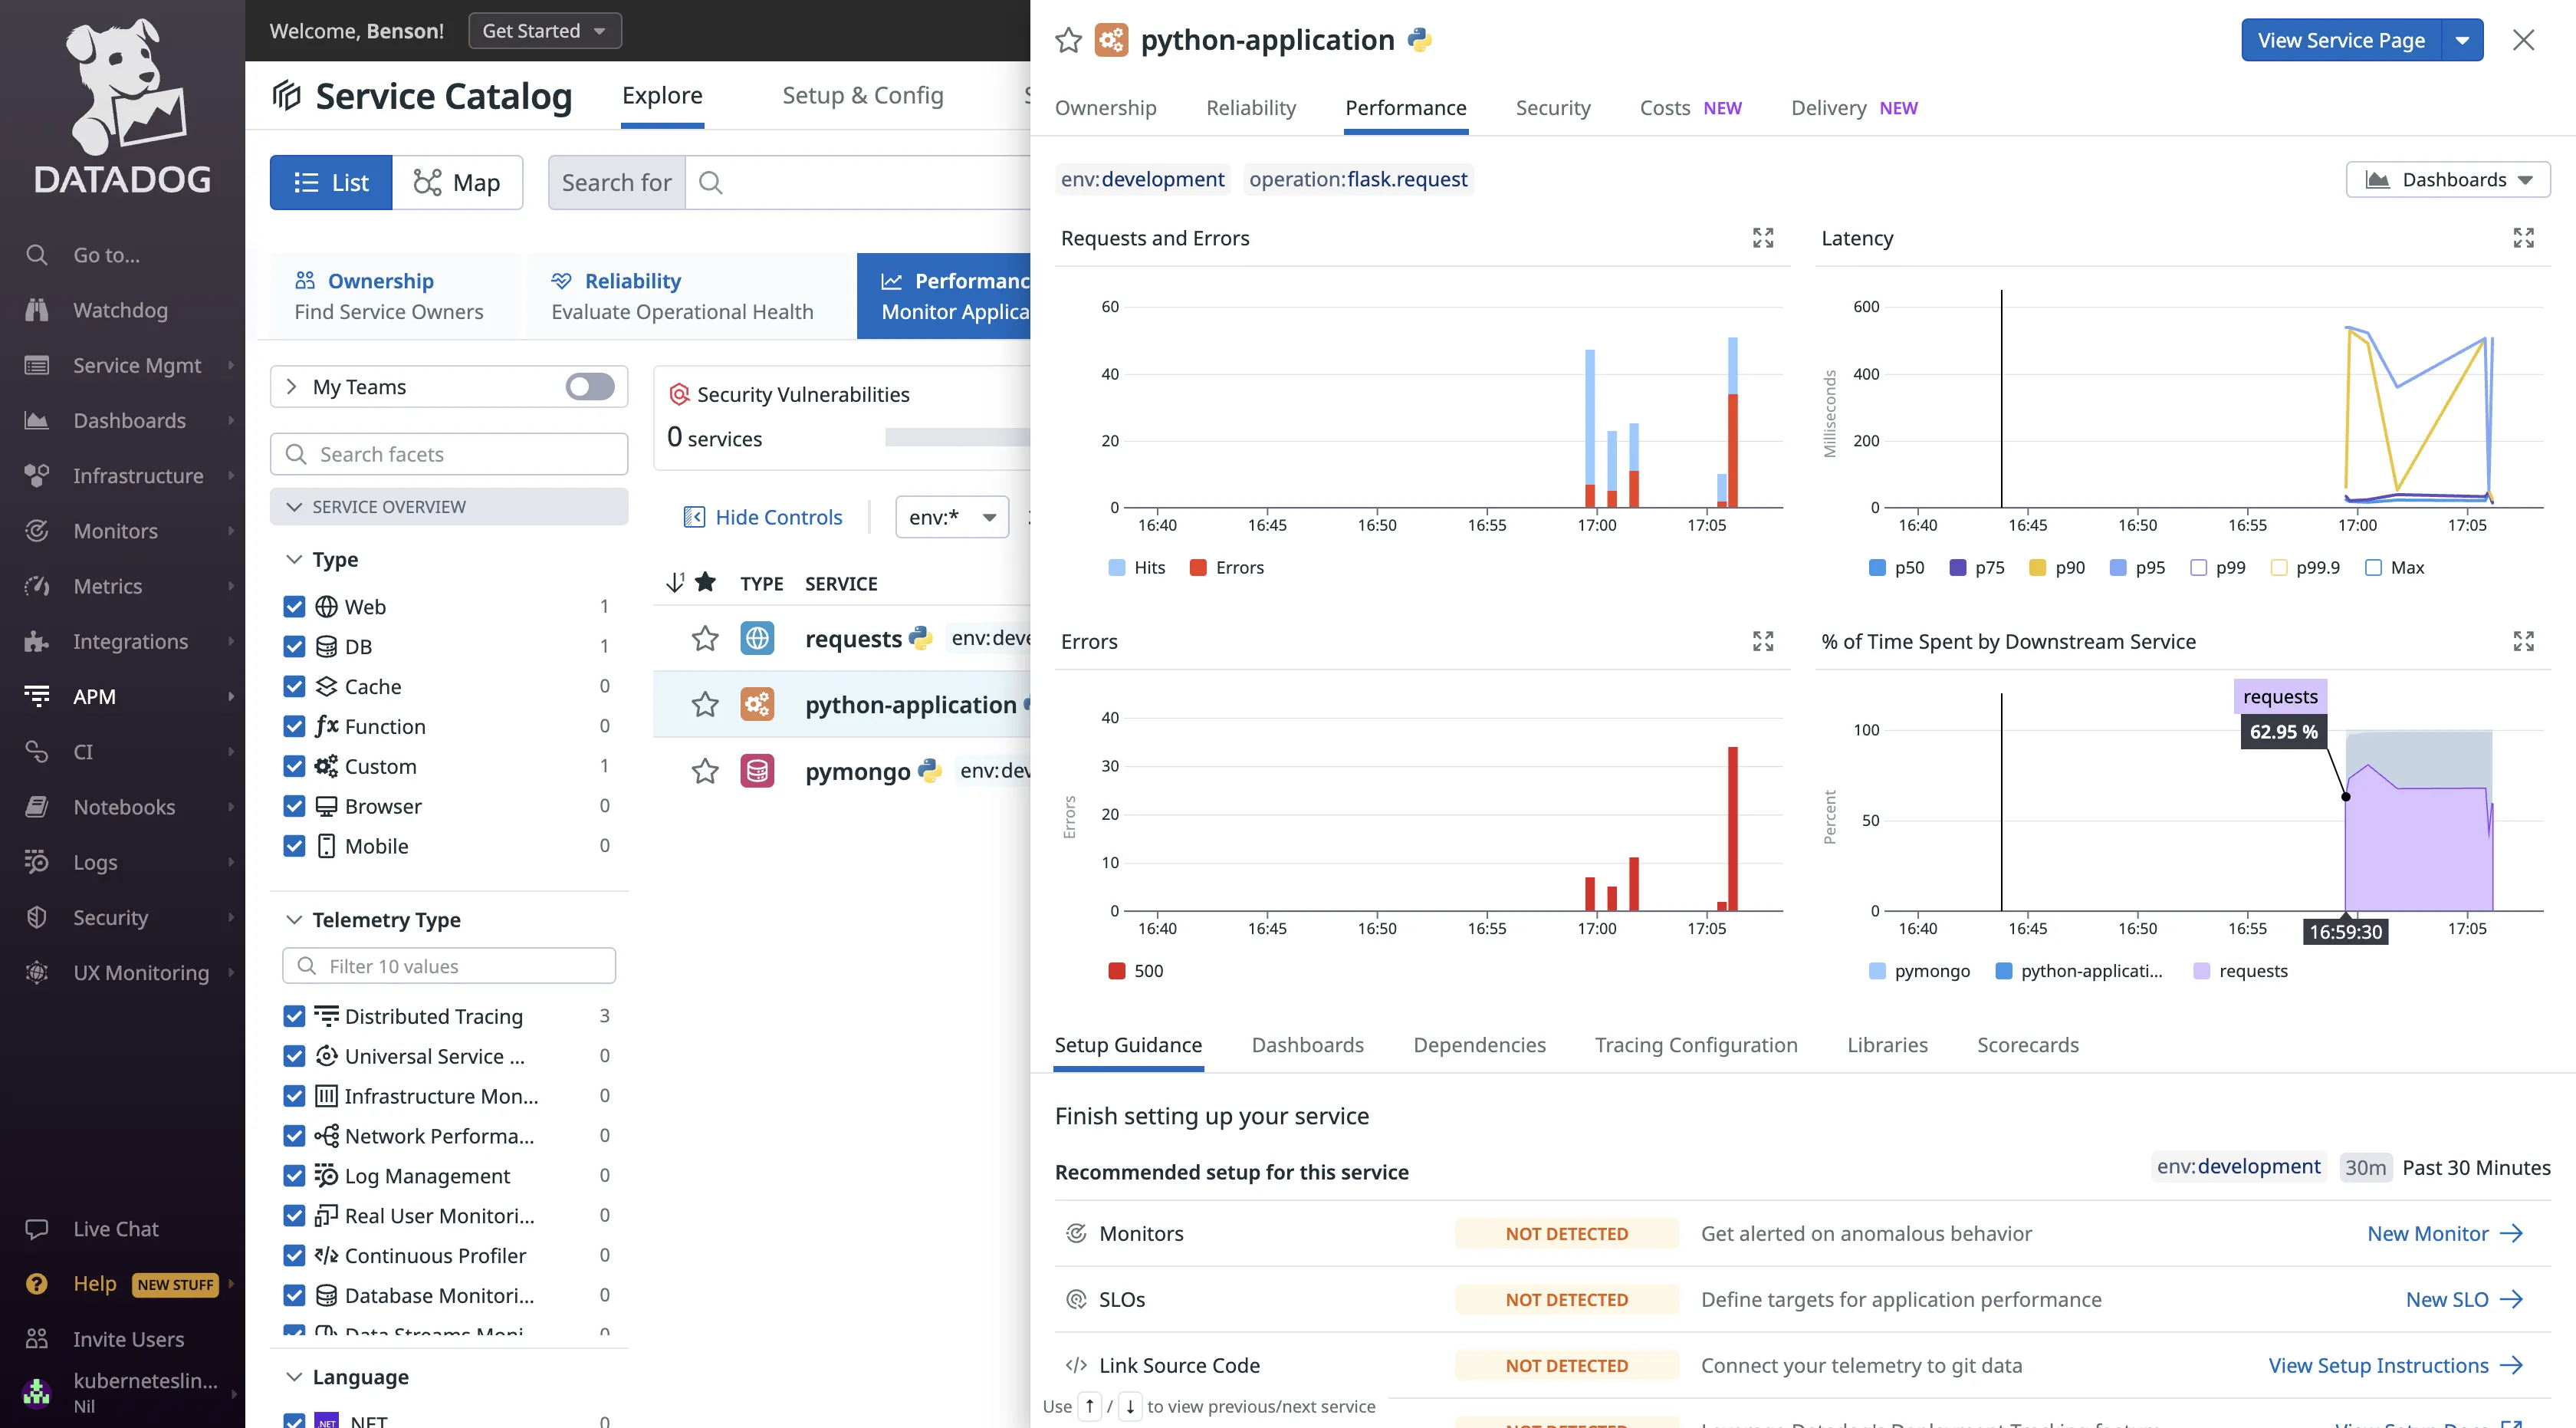
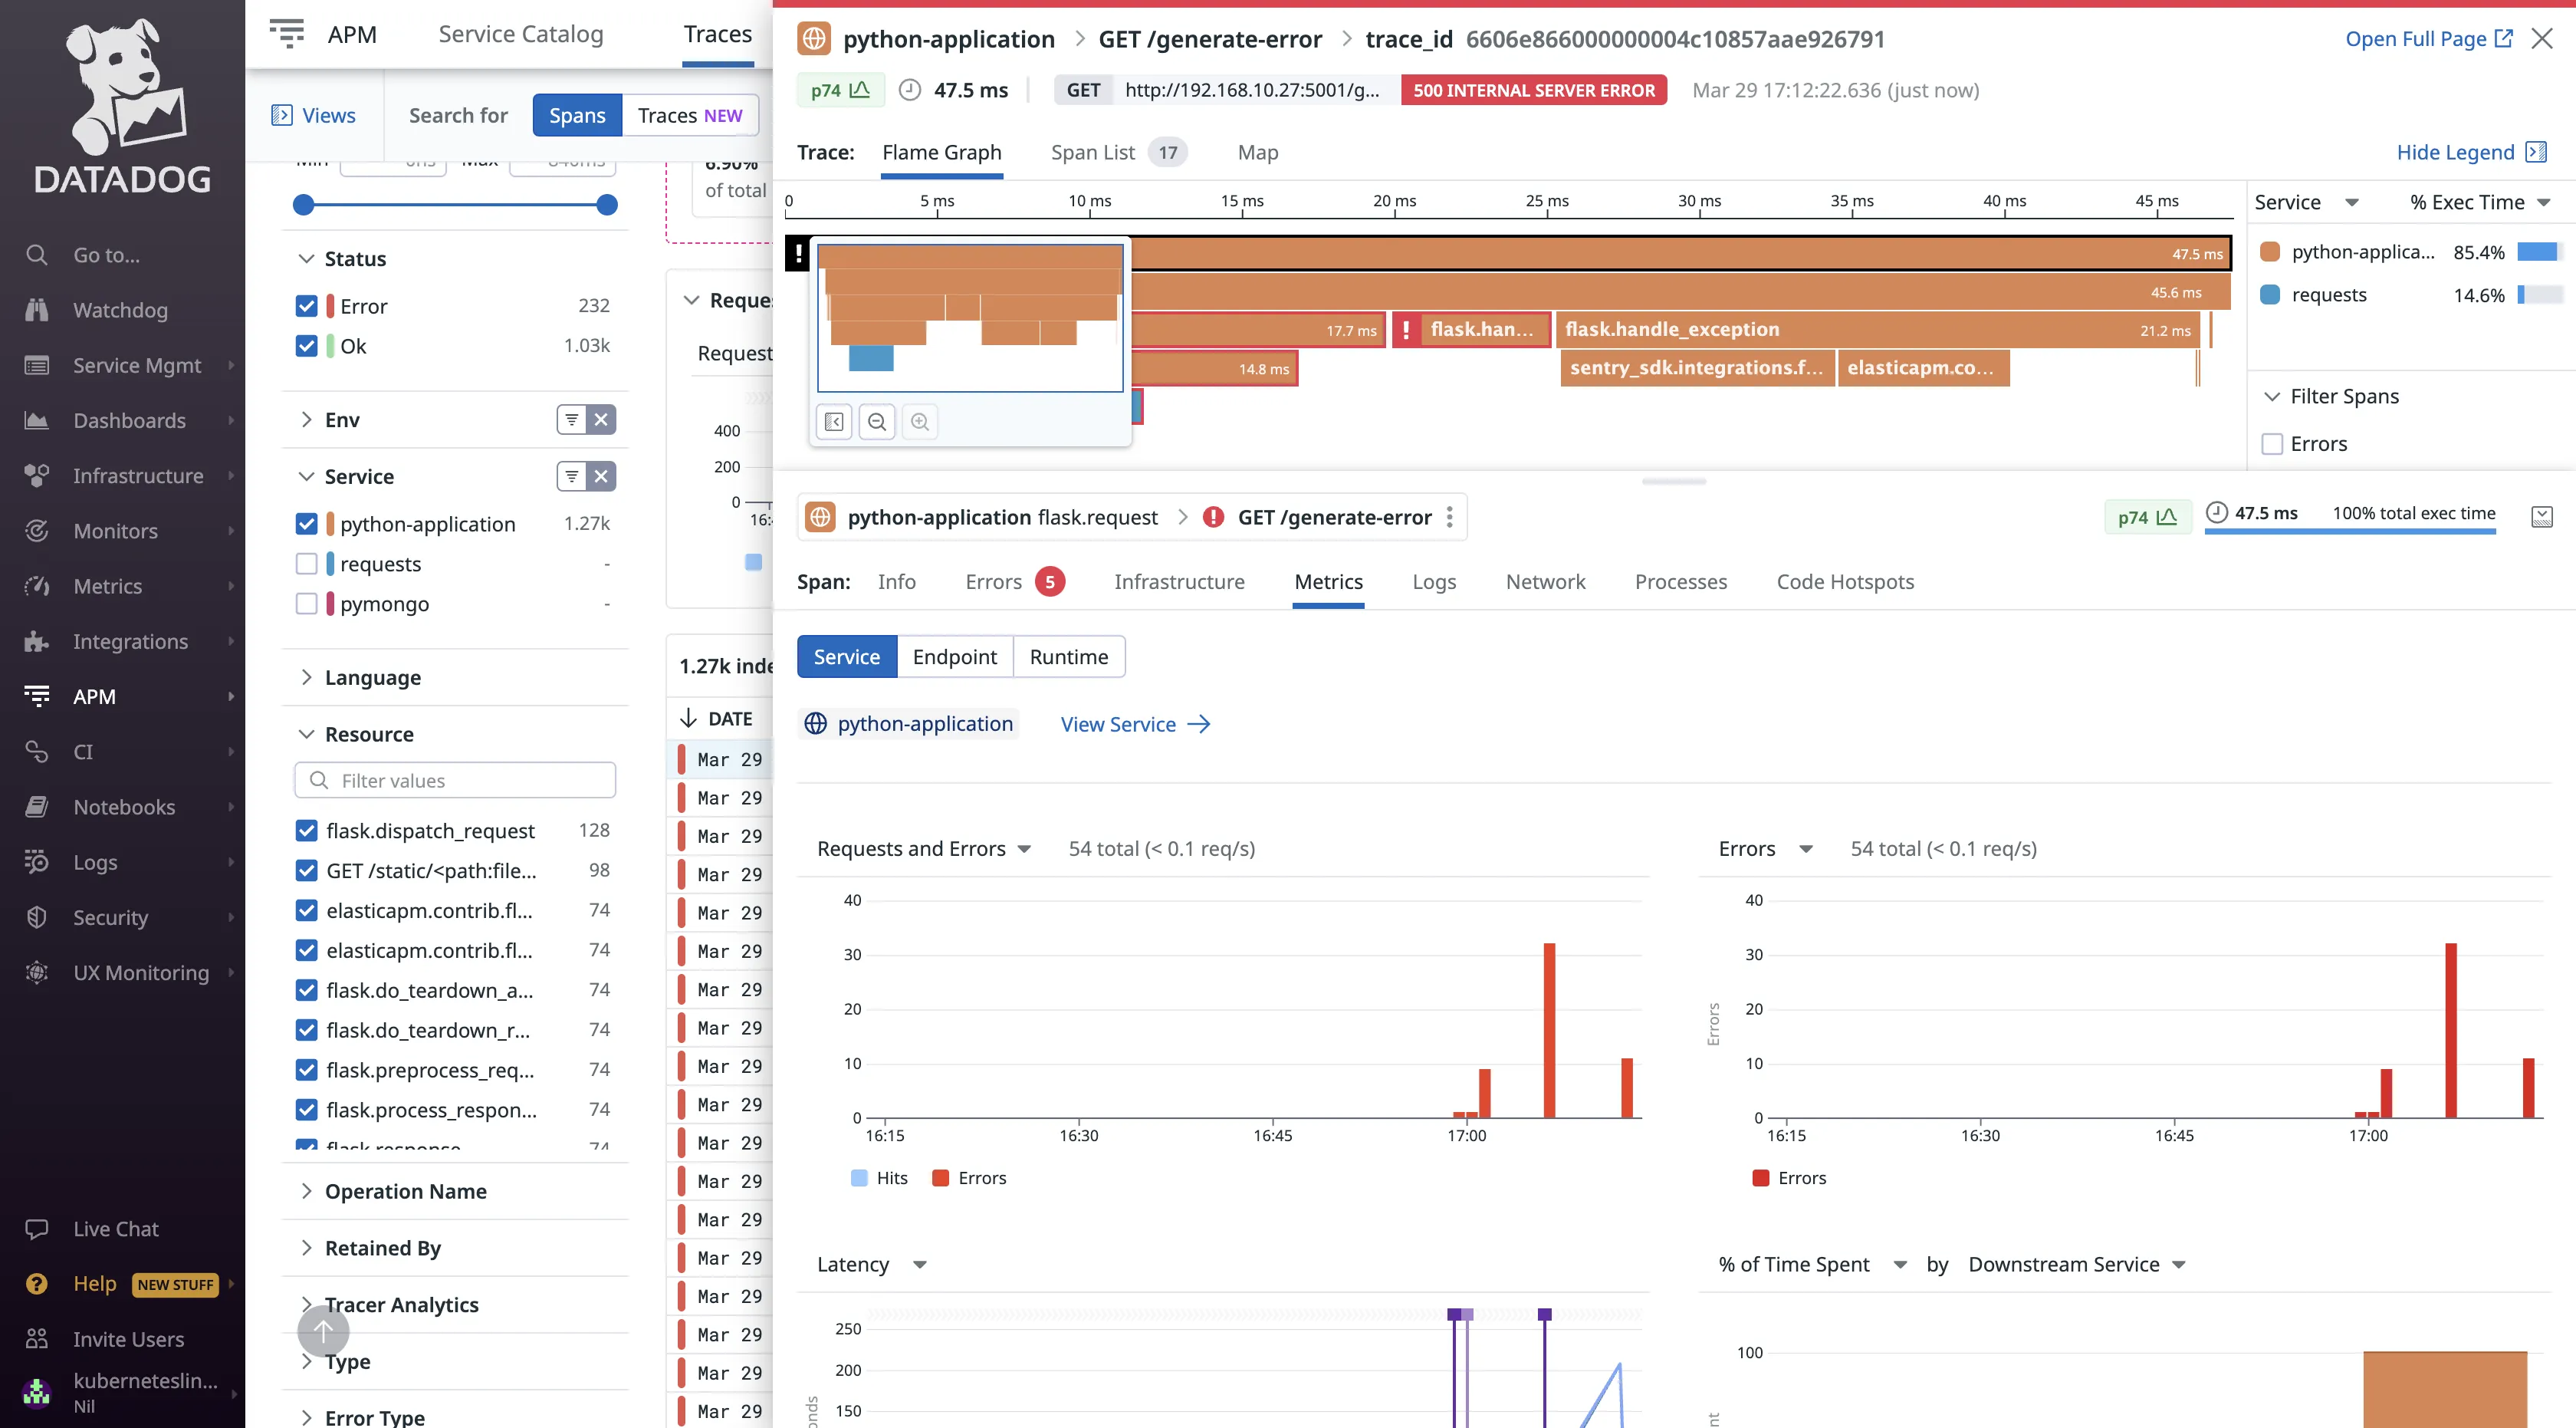
The Trace Explorer facilitates real-time search and analysis of your traces, allowing me to locate root causes, and resolve errors. It also lets you correlate related logs and metrics for a thorough understanding of any issue.
Sentry
Sentry tracks an application's performance by identifying slow code and tracing slow transactions to problematic API calls or database queries.
The Performance UI offers a comprehensive overview of the metrics and transactions being monitored against your application. It was able to detect and categorize common performance issues in my application into manageable issues for improved resolution.
It also allows users to set alarms on the latency issues affecting the most users, so you can fix what’s urgent faster.
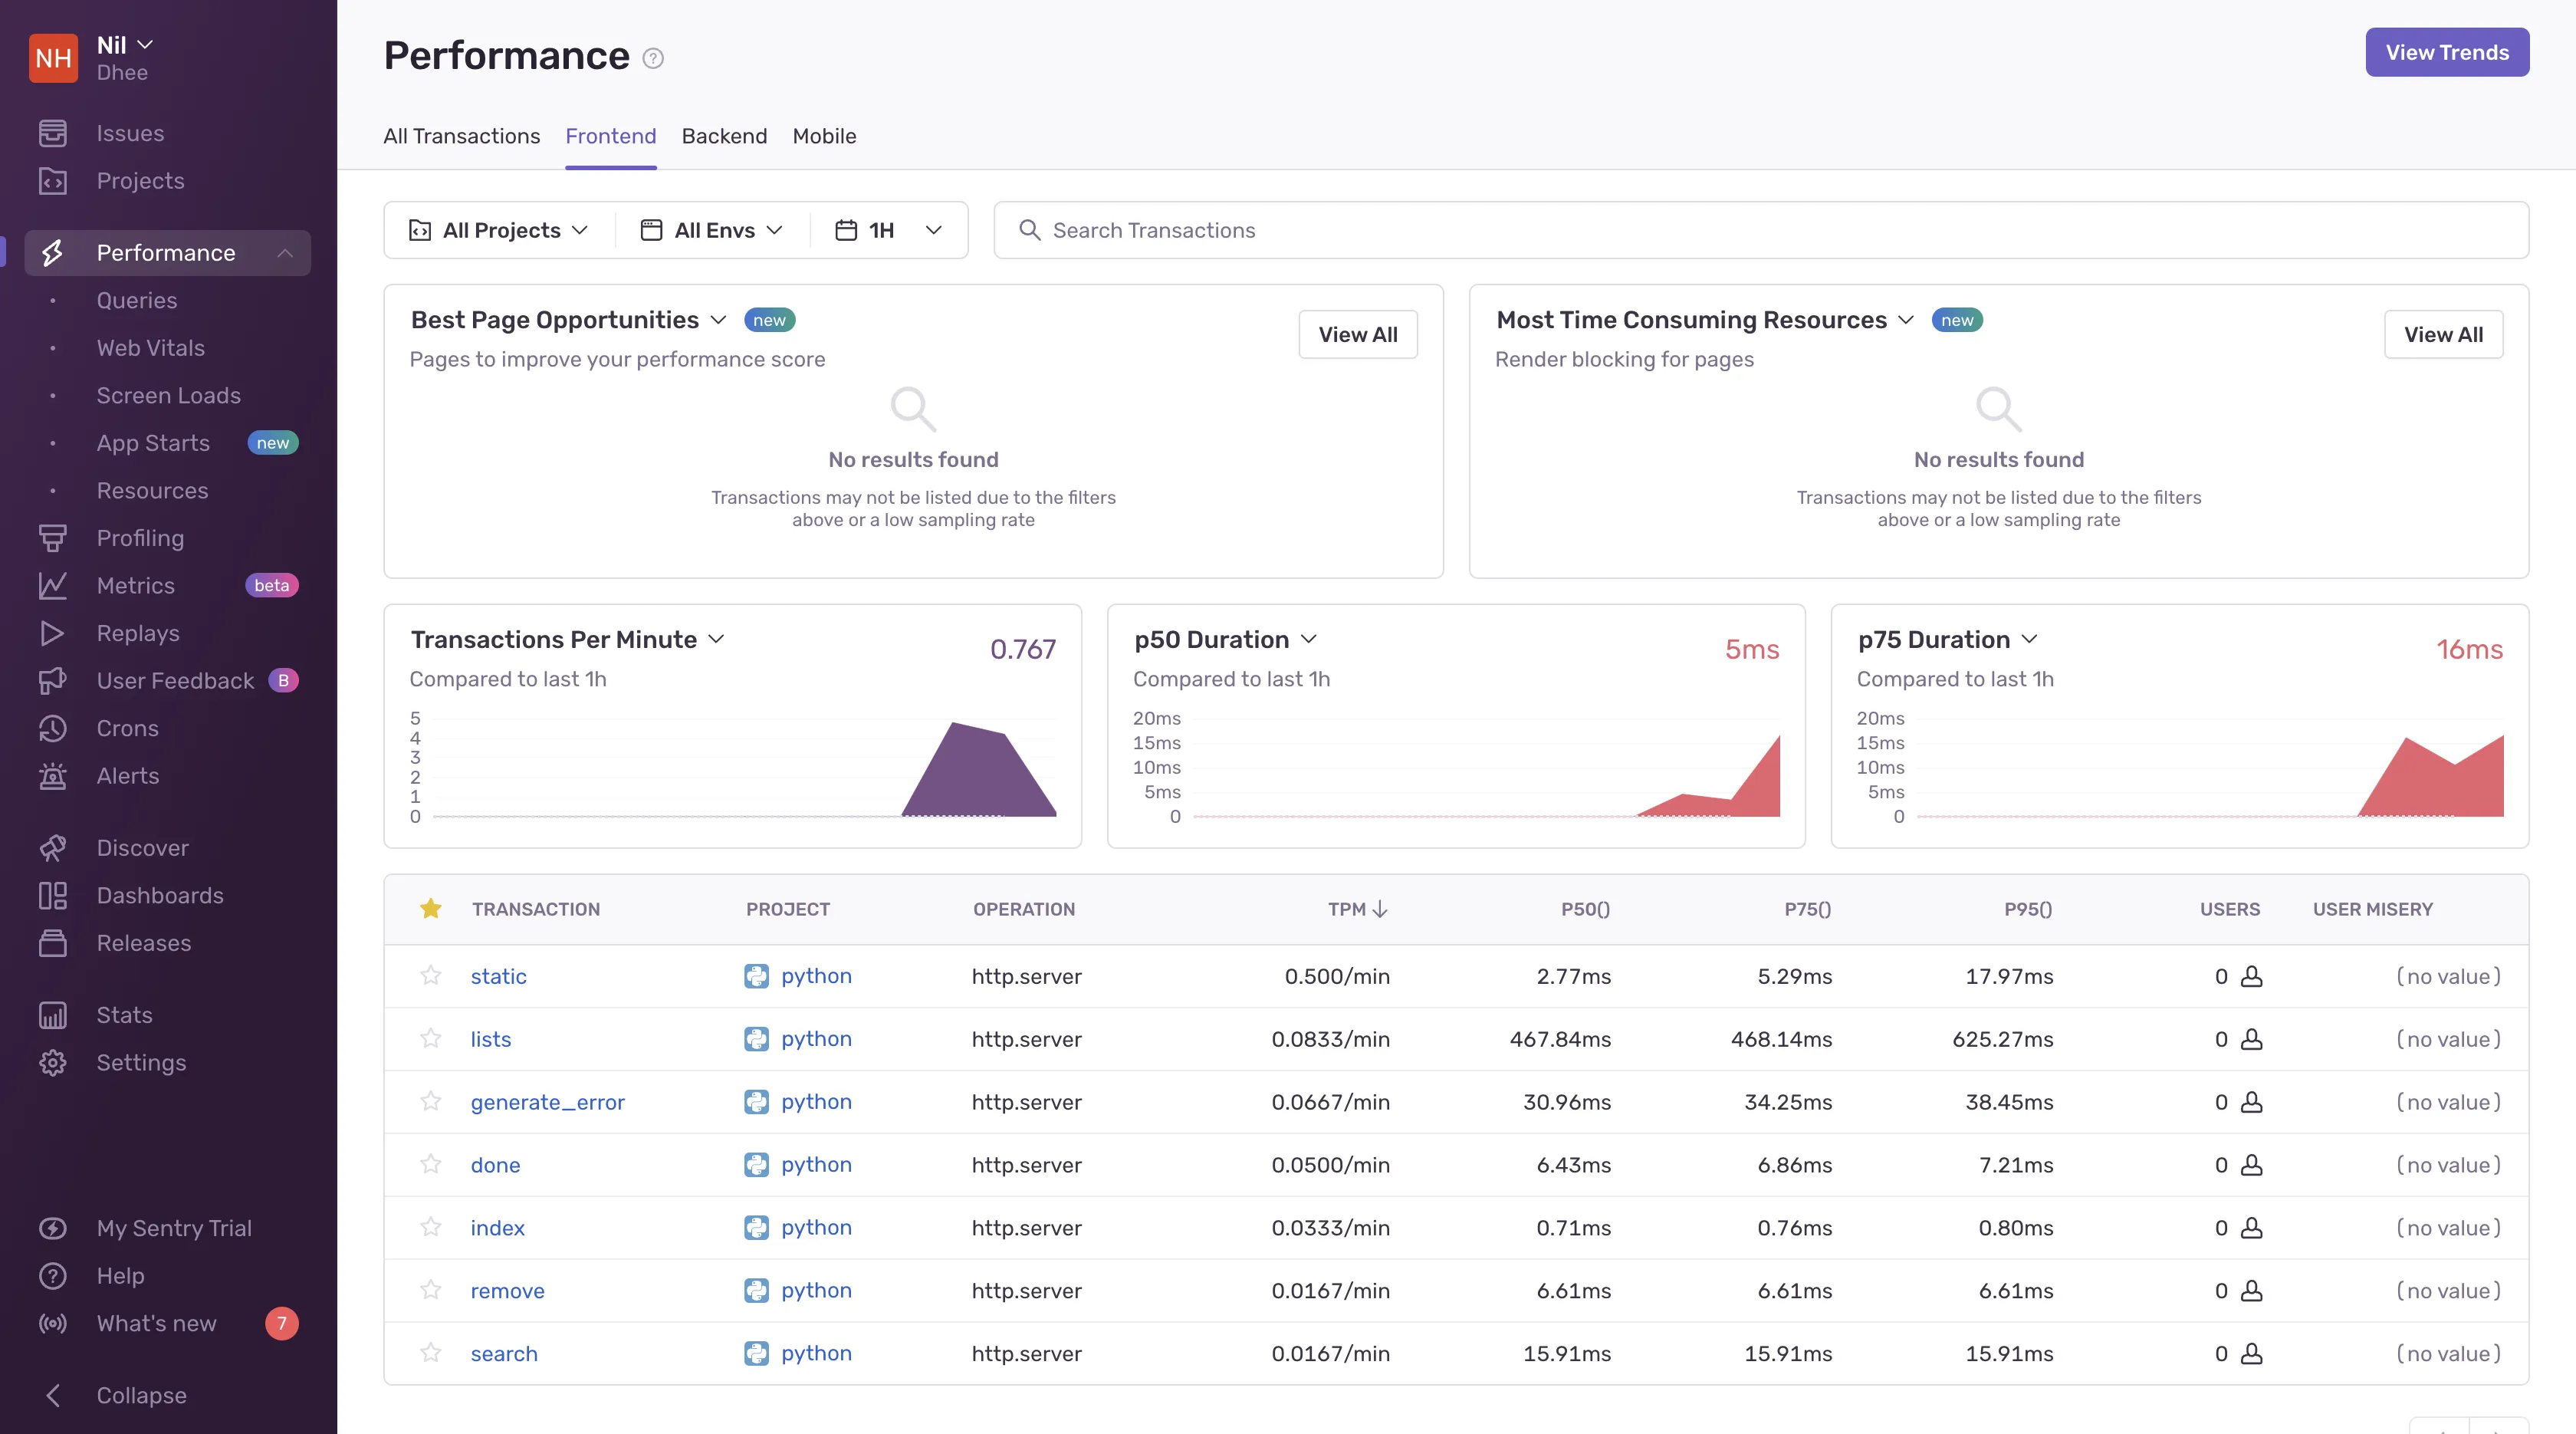
Unlike Datadog, Sentry is essentially built for error tracing and exception monitoring with APM capabilities. Datadog which is built for APM offers better APM capabilities.
Cut Your Observability Spend by 80%—Here's How
Switch from Datadog seamlessly with our automated migration tool, comparable features and up to 80% cost savings.
Log Management: Datadog
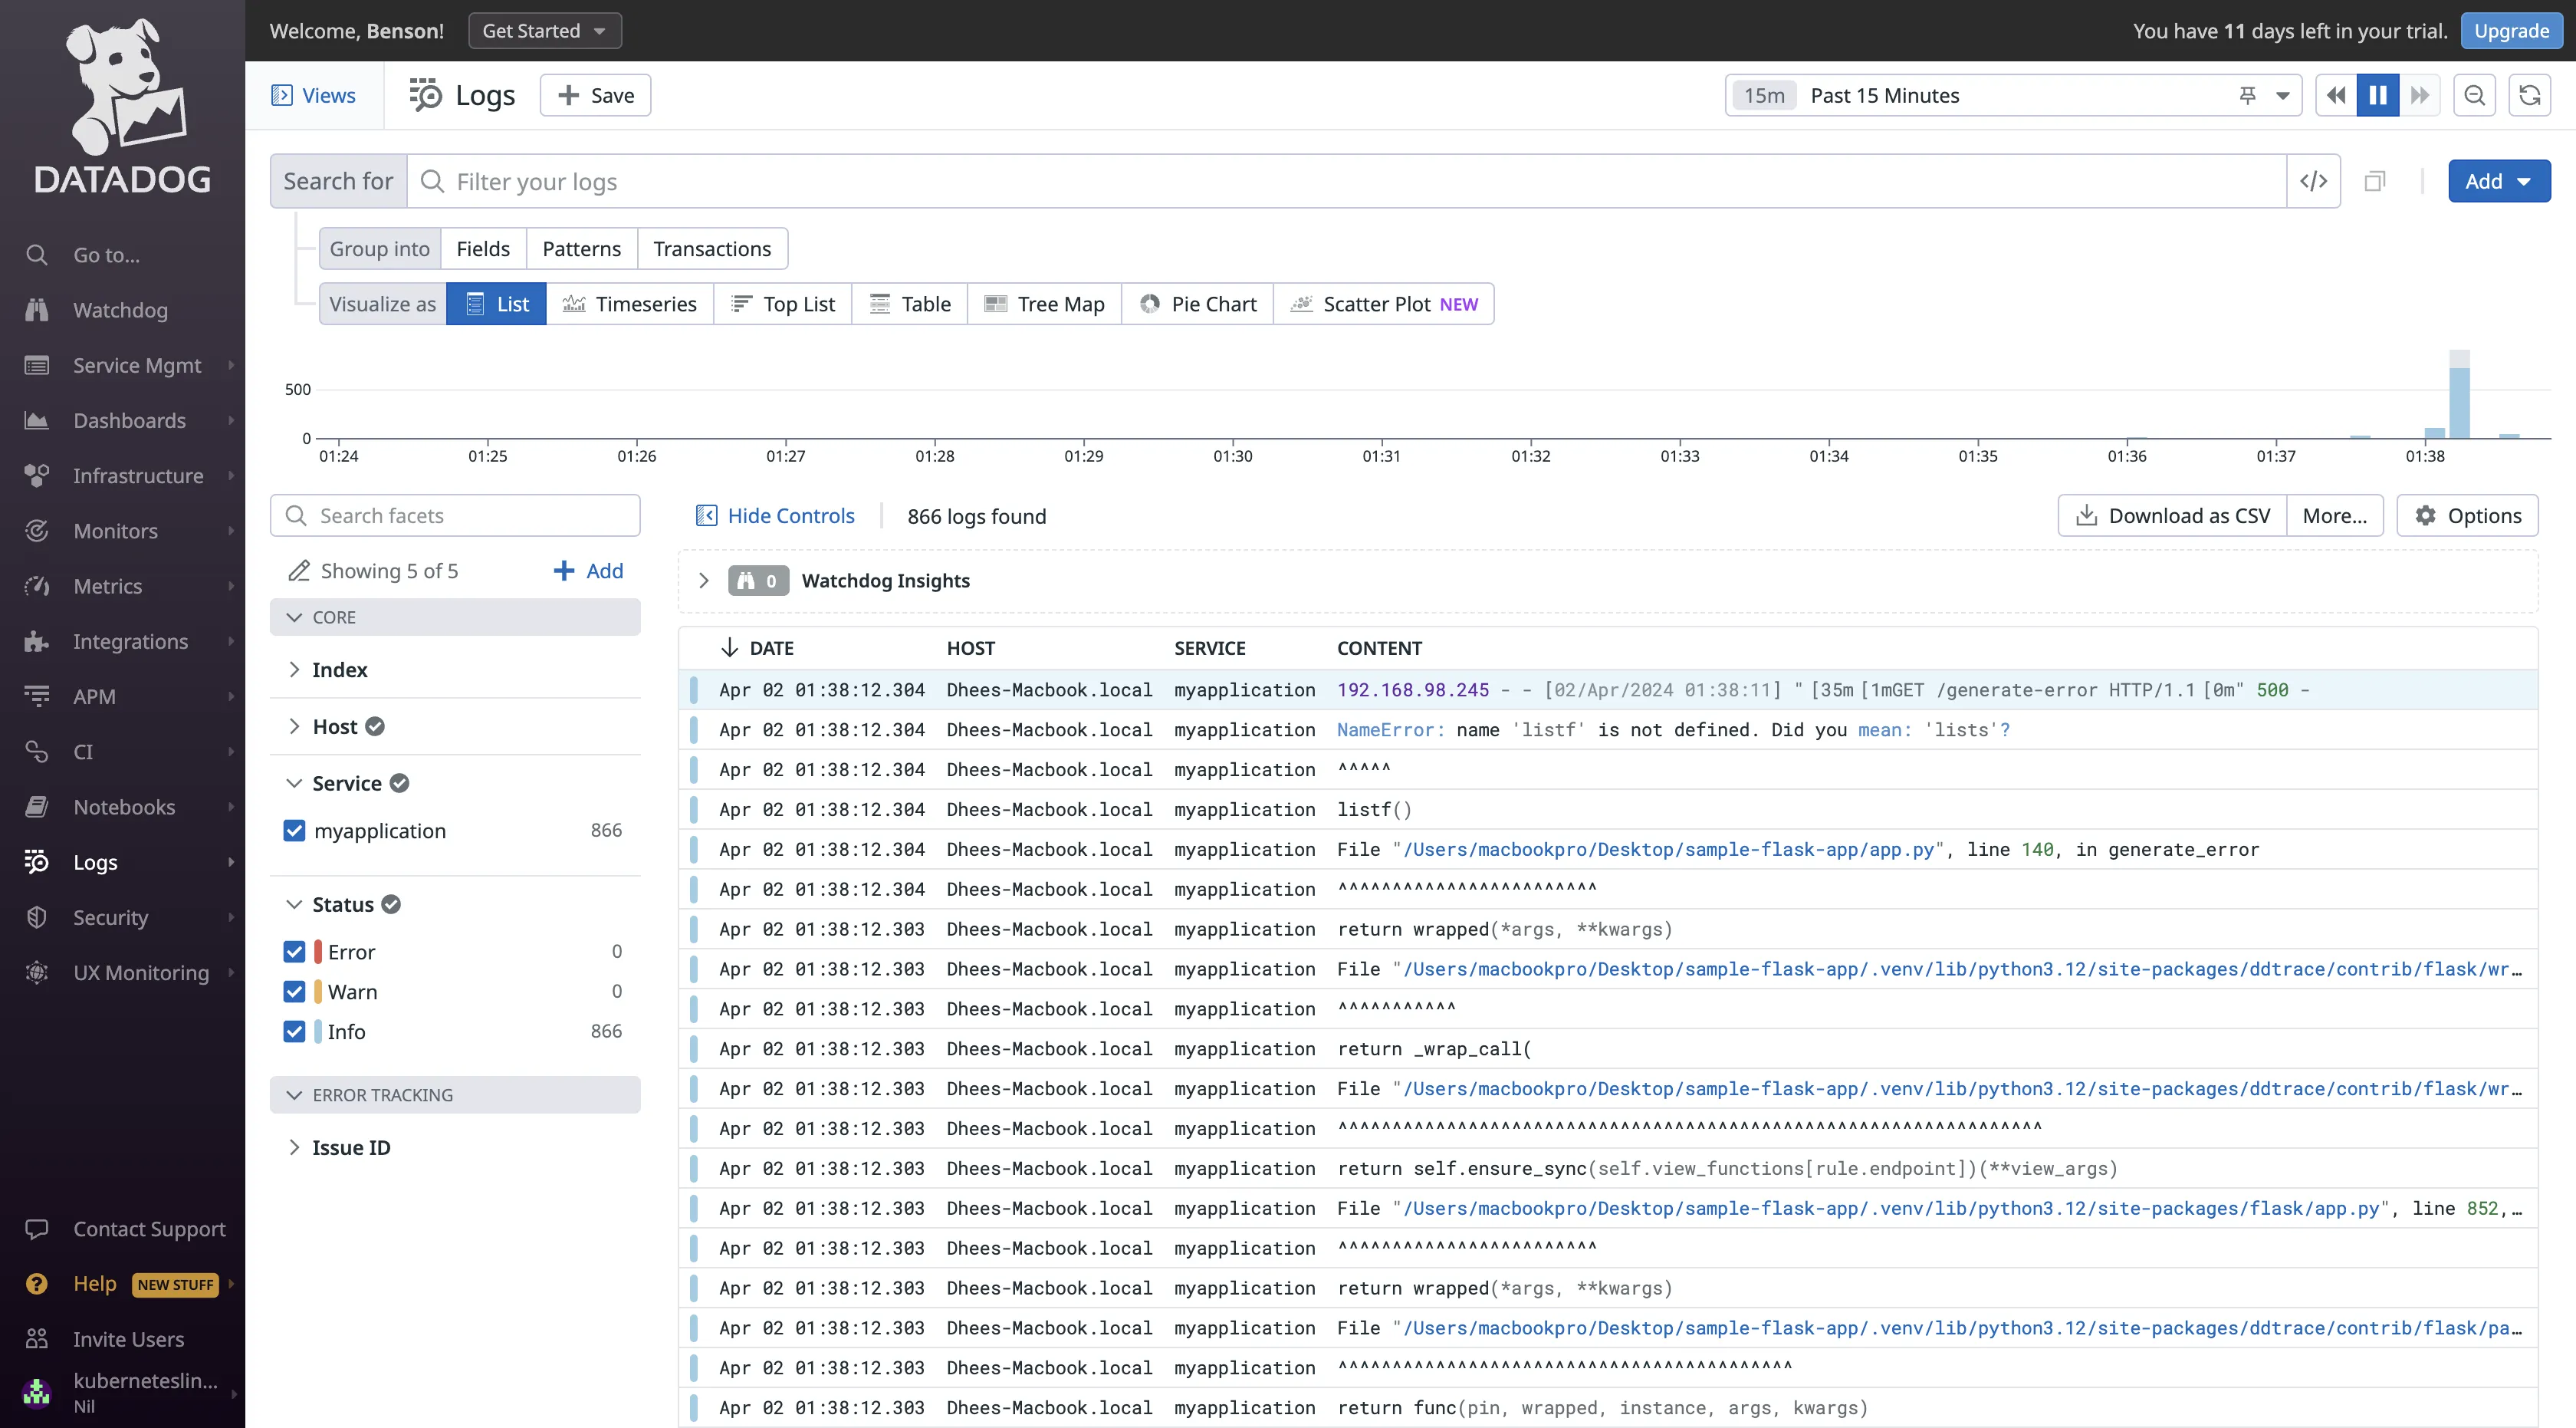
Datadog
By default, the Datadog Agent does not collect logs. This has to be configured manually by editing the Datadog agent config file. After configuration, Datadog immediately picked up my application logs and I could monitor them in real-time through its live tail feature.
Datadog allows for filtering and searching of logs to help users quickly find the information they need. especially in environments where large volumes of log data are generated. It also provides different visualization options for viewing logs.
Datadog has what it calls “Logging without Limits”, which ensures that users can cost-effectively collect, store, and analyze log data by decoupling log ingestion from indexing. This feature empowers organizations to capture all relevant log data, regardless of volume or complexity, enabling comprehensive monitoring and analysis for better insights and decision-making.
Sentry
Sentry doesn’t exactly perform log management. It integrates with your existing application logging infrastructure and enhances it with additional insights without replacing the need for traditional logs. It captures events and stores them in a way that is optimized for error tracking and debugging.
Datadog performs better at log management since it has a log management service.
Pricing: Sentry
Datadog
Datadog utilizes an SKU pricing model with each Datadog product varying in price. This model can lead to unpredictable costs, especially in situations where your data volume changes over time. Without the ability to accurately predict the cost for a given month, your Datadog bill may experience unexpected spikes.
Also, Datadog charges for additional monitoring requirements like the creation of custom metrics ($0.05 per custom metric) and enabling error tracking (additional charges based on event volume).
Sentry
Sentry operates on a pricing model structured around user seats and monthly rates, featuring various tiers, with the developer tier available at a starting price of $0 per month (free trial). The team and business tiers are priced at $20 and $80 monthly while the enterprise tier requires contacting the Sentry team.
Sentry's pricing is based on the number of user seats and monthly fees, offering different tiers. The developer tier is accessible at no cost. It has a 14-day free trial for free access. The other tiers are priced at $20 and $80 per month.
Between both tools, Datadog’s pricing is more expensive.
Choosing Between Datadog and Sentry
Choosing between Datadog and Sentry depends on your monitoring and observability needs.
Here’s a use-case-based guide to help you:
- If you want full visibility into your application performance, choose Datadog.
- If you want to track errors in your applications, choose Sentry.
- If you want a better correlation between your telemetry signals, choose Datadog.
- If you want more control, flexibility, and insights into your infrastructure, application, and services, choose Datadog.
- If your use case is real-user monitoring, then choose Datadog.
If you are still not satisfied with both tools, there are a ton of good options in the market. A really good contender to both Datadog and Sentry you can check out is SigNoz.
SigNoz: A Better Alternative to Datadog and Sentry
SigNoz excels in providing a holistic approach to observability, seamlessly integrating Metrics, Logs, and Traces into a single, unified platform.
Here are the notable features:
- It’s open-source
- It’s OpenTelemetry-native
- No hidden pricing or special pricing for custom metrics
- No user-based or host-based pricing
SigNoz uses Clickhouse as its underlying database, ensuring rapid data ingestion and efficient data aggregation.
Additionally, the platform simplifies the creation of custom dashboards, enabling users to tailor their monitoring to specific needs and preferences.
Getting Started with SigNoz
SigNoz Cloud is the easiest way to run SigNoz. Sign up for a free account and get 30 days of unlimited access to all features.

You can also install and self-host SigNoz yourself since it is open-source. With 24,000+ GitHub stars, open-source SigNoz is loved by developers. Find the instructions to self-host SigNoz.
Frequently Asked Questions
Q: What is the difference between Datadog and Sentry in terms of their primary use cases?
A: Datadog is a comprehensive monitoring and analytics platform that provides insights into infrastructure, applications, and security. It's designed to monitor everything from servers and databases to applications and services, offering a wide range of metrics and alerts. Sentry, on the other hand, is primarily focused on application monitoring and error tracking. It specializes in real-time error tracking that gives developers insight into production deployments and information to reproduce and fix crashes.
Q: What are the benefits of using Datadog and Sentry together for observability?
A: Combining Datadog and Sentry can provide a more comprehensive view of an organization's operations. Datadog's infrastructure and application monitoring capabilities can complement Sentry's error tracking and application performance monitoring, offering a holistic approach to observability. This integration can help teams identify and resolve issues more efficiently by correlating infrastructure problems with application errors.
Related Content
