Top 6 Jaeger Alternatives in 2026 [Open-Source Included]
Jaeger is an open-source distributed tracing backend that has been on the market for a while. It was developed by Uber Technologies in 2015 and contributed to the Cloud Native Computing Foundation (CNCF). It is designed to monitor and troubleshoot complex distributed systems by providing insights into the flow of requests and responses across microservice architectures.

Distributed tracing is critical for cloud-native microservices-based applications. Before we look into Jaeger alternatives, let’s have a brief overview of distributed tracing.
What is Distributed Tracing?
Distributed tracing is a method used in software development and system monitoring to track and visualize the flow of requests as they propagate through various components of a distributed system or application.
In simpler terms, it's like tracing the journey of a request as it moves through different parts of a complex system, such as microservices, APIs, and databases. Each step in the journey is recorded and linked together, allowing developers and operators to understand how different components interact and contribute to the overall performance and behavior of the system.
Distributed tracing is useful in identifying bottlenecks, latency issues, and errors, enabling teams to diagnose and troubleshoot problems more effectively. It provides insights into the performance and behavior of distributed systems, helping improve reliability, scalability, and user experience.
Why do we need Jaeger Alternatives?
Jaeger is a powerful tool for distributed tracing, but it has its downsides, which may necessitate considering an alternative tool. Jaeger’s UI is limited, and you might need more capabilities for analyzing your trace data.
Another notable limitation is its narrow focus on distributed tracing. In today's complex software ecosystems, troubleshooting and resolving issues require more than just tracing requests across microservices.
You need access to rich metrics that offer insights into system performance, resource utilization, and application behavior. Jaeger lacks observability features such as metrics collection, logging, and profiling. This means you may need to use additional tools alongside Jaeger to gather comprehensive observability data. Using multiple tools for monitoring is not easy and often requires more engineering bandwidth.
Another limitation worth considering is the maintenance required for the databases supported by Jaeger. Currently, Jaeger supports Cassandra and Elasticsearch as its backends, but these databases require ongoing maintenance and may not scale as easily as other options. This can be a concern for teams that are looking for a more scalable and easier-to-maintain solution for their distributed tracing needs.
Top 6 Jaeger Alternatives
Here are the top 6 Jaeger alternatives to consider adopting in 2024:
SigNoz

SigNoz is a robust alternative to Jaeger, offering a full-stack, open-source solution that provides a unified view of logs, metrics, and traces. By consolidating these signals into a single pane of glass, SigNoz enables engineering teams to gain deeper insights into application performance and troubleshoot issues more effectively.
SigNoz also provides advanced features for tracing data. You can run aggregates on trace data and filter it across your application-specific attributes to troubleshoot performance issues.
SigNoz is built to support OpenTelemetry natively. OpenTelemetry is backed by Cloud Native Computing Foundation and is the second most active project after Kubernetes in the CNCF landscape. OpenTelemetry is the future of cloud-native application instrumentation. Jaeger also shifted from Jaeger clients to OpenTelemetry SDKs for generating trace data.
Key features
Apart from distributed tracing, SigNoz also provides:
- APM: Monitor application metrics like p99 latency, error rates for your services, external API calls, and individual endpoints.
- Metrics and Dashboards: Monitor any metrics important to you and create dashboards around any use case like external calls, API endpoints, JVM metrics.
- Log management: • Support for OpenTelemetry logs or any existing logging pipeline that you have.
- Exceptions Monitoring: Record exceptions automatically in Python, Java, Ruby, and Javascript
- Advanced tracing: Run aggregates on trace data to get business-relevant metrics
- Alerts: Easy to set alerts with DIY query builder
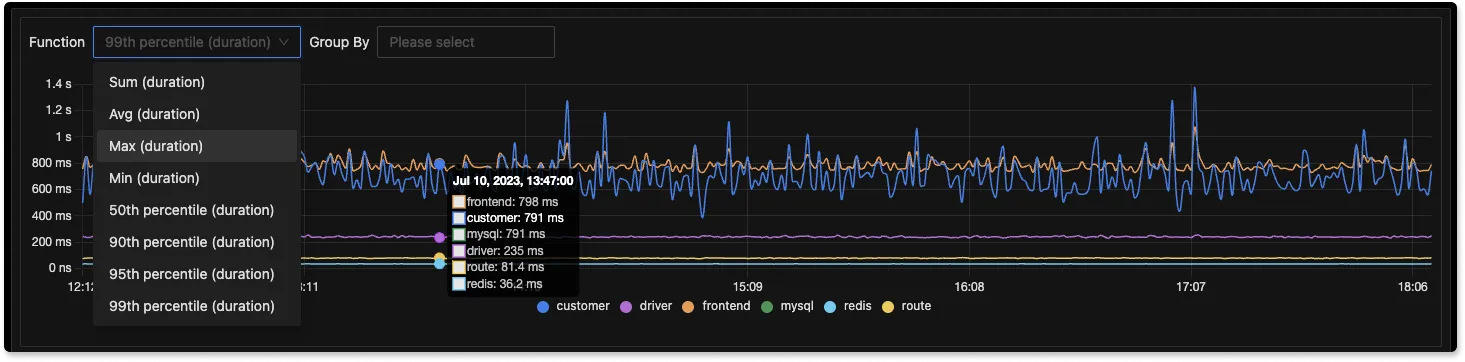
Honeycomb
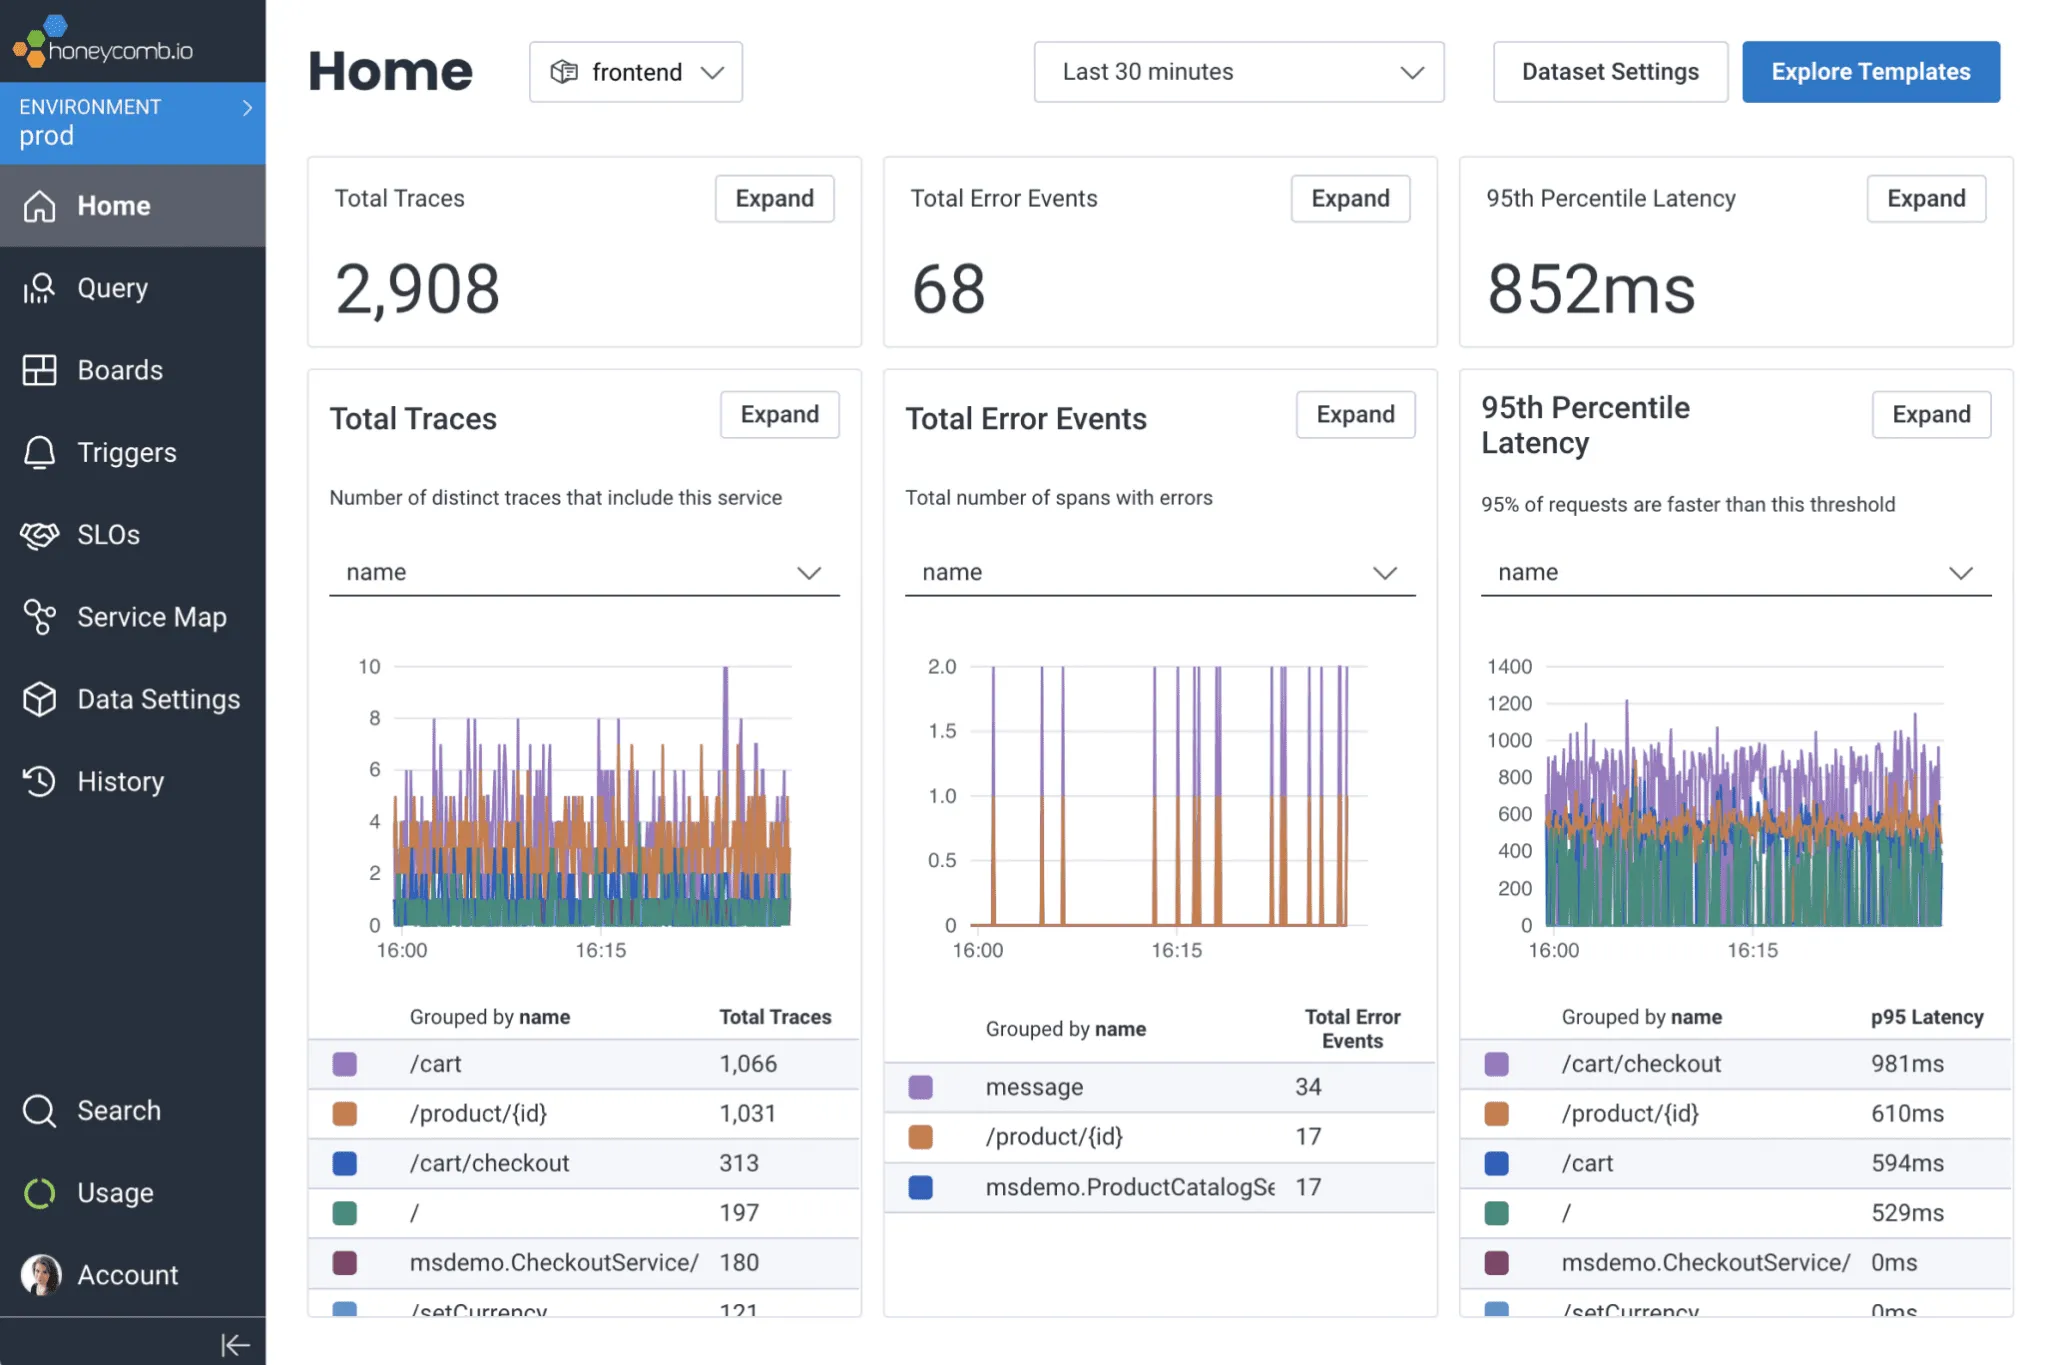
Honeycomb is a full-stack, cloud-based observability tool that provides users with real-time insights into their complex systems and supports events, logs, and traces.
Honeycomb's tracing feature connects events to show the sequence of operations within a system clearly. It can also simulate user activity within the system, allowing it to detect patterns, correlations, or anomalies that may not be evident when analyzing individual events separately.
Honeycomb can also identify traces associated with poor user experiences in systems when used with BubbleUp, Honeycomb’s anomaly detection tool, by performing an automatic analysis of attributes across millions of requests.
Key features
- Application observability
- High-dimensional data analysis
- SLO alerting
- Customizable dashboards
Tempo by Grafana (open-source)
Grafana Tempo is an open-source distributed tracing backend specifically designed for storing and retrieving trace data efficiently. Its high scalability allows it to handle large volumes, reducing operational complexities and costs. This is attributed to its object storage backend, which enables long-term trace storage and positions it as a good alternative to Jaeger. Tempo utilizes TraceQL, a custom query language designed specifically for analyzing traces. With TraceQL, specific spans can be easily selected for analysis.
In addition, Tempo integrates seamlessly with Grafana, Mimir, Prometheus, and Loki, providing comprehensive observability and monitoring capabilities.
Key Features
- Object storage backend for long-term storage
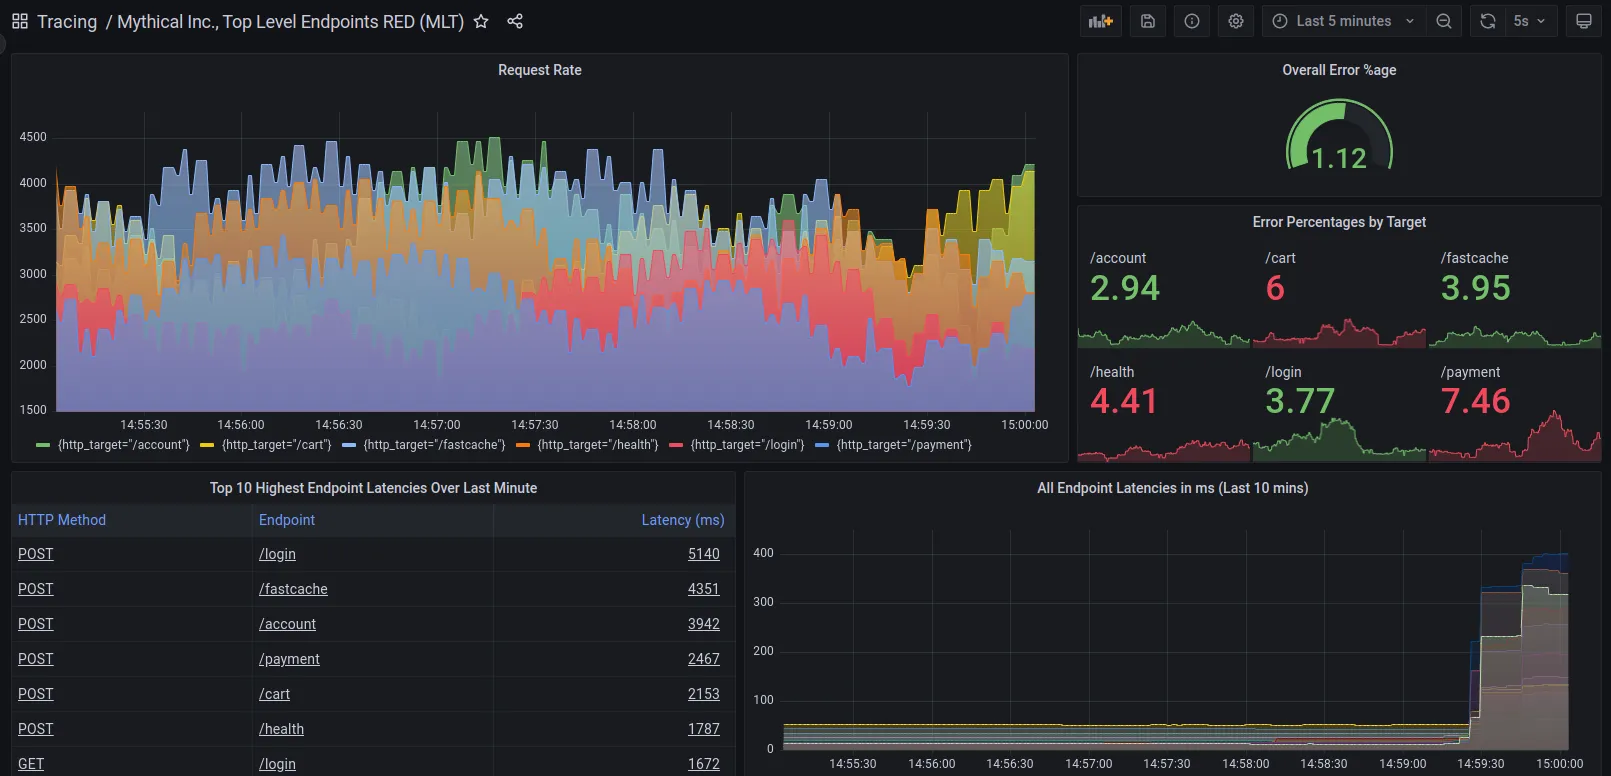
Datadog
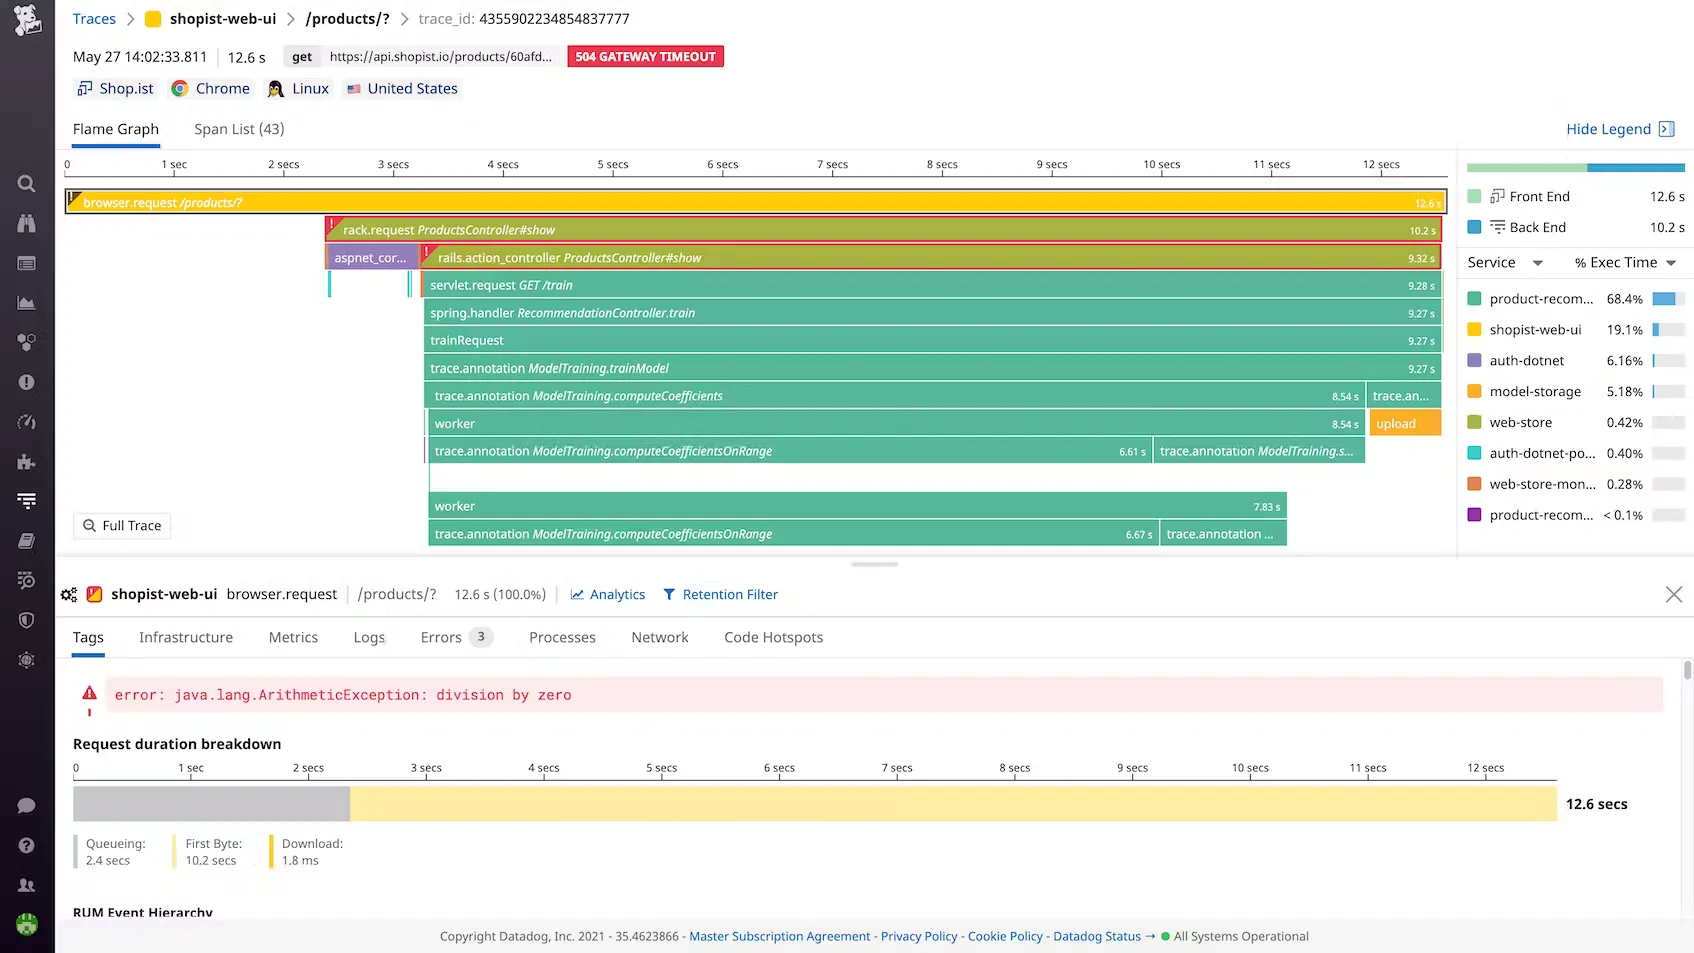
Datadog is a leading observability platform that provides comprehensive monitoring and analytics solutions for modern cloud-scale applications. It allows you to pinpoint issues by seamlessly correlating traces with a variety of data sources, such as logs, infrastructure metrics, database queries, network calls, and frontend telemetry, all in one unified view.
Datadog's distributed tracing tool is particularly powerful, enabling real-time searches and analyses of traces that are error-prone, have high latency, or are valuable. It also includes a feature for creating tag-based retention filters, which help manage traces by retaining only the most important ones based on tail-based criteria.
Key features
- Full stack observability
- Infrastructure monitoring
- Security monitoring
- Custom dashboards and alerts
- Out-of-the-box integrations
New Relic
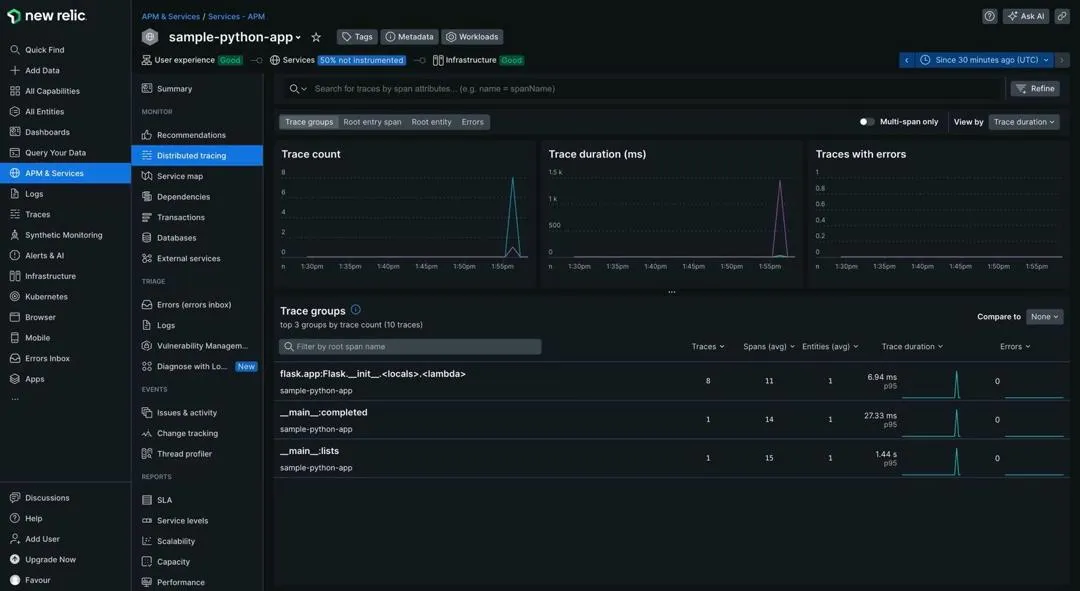
New Relic is an all-in-one platform designed to help you monitor your applications and services in real-time. It focuses on four key types of data: metrics, events, logs, and traces, which are referred to as "MELT.” With New Relic, you can track requests across your distributed system using its distributed tracing feature. It offers a user-friendly interface dedicated to understanding and analyzing your traces.
New Relic also offers support for trace sampling, a feature designed to reduce the volume of spans generated. This capability is valuable for the reduction of data storage and ingestion costs, as well as for focusing on relevant traces while filtering out unnecessary noise.
Key features
- Real-time performance monitoring
- Full stack observability
- Unified data view
- APM and Infrastructure management
- Synthetic monitoring
- Distributed tracing
Aspecto
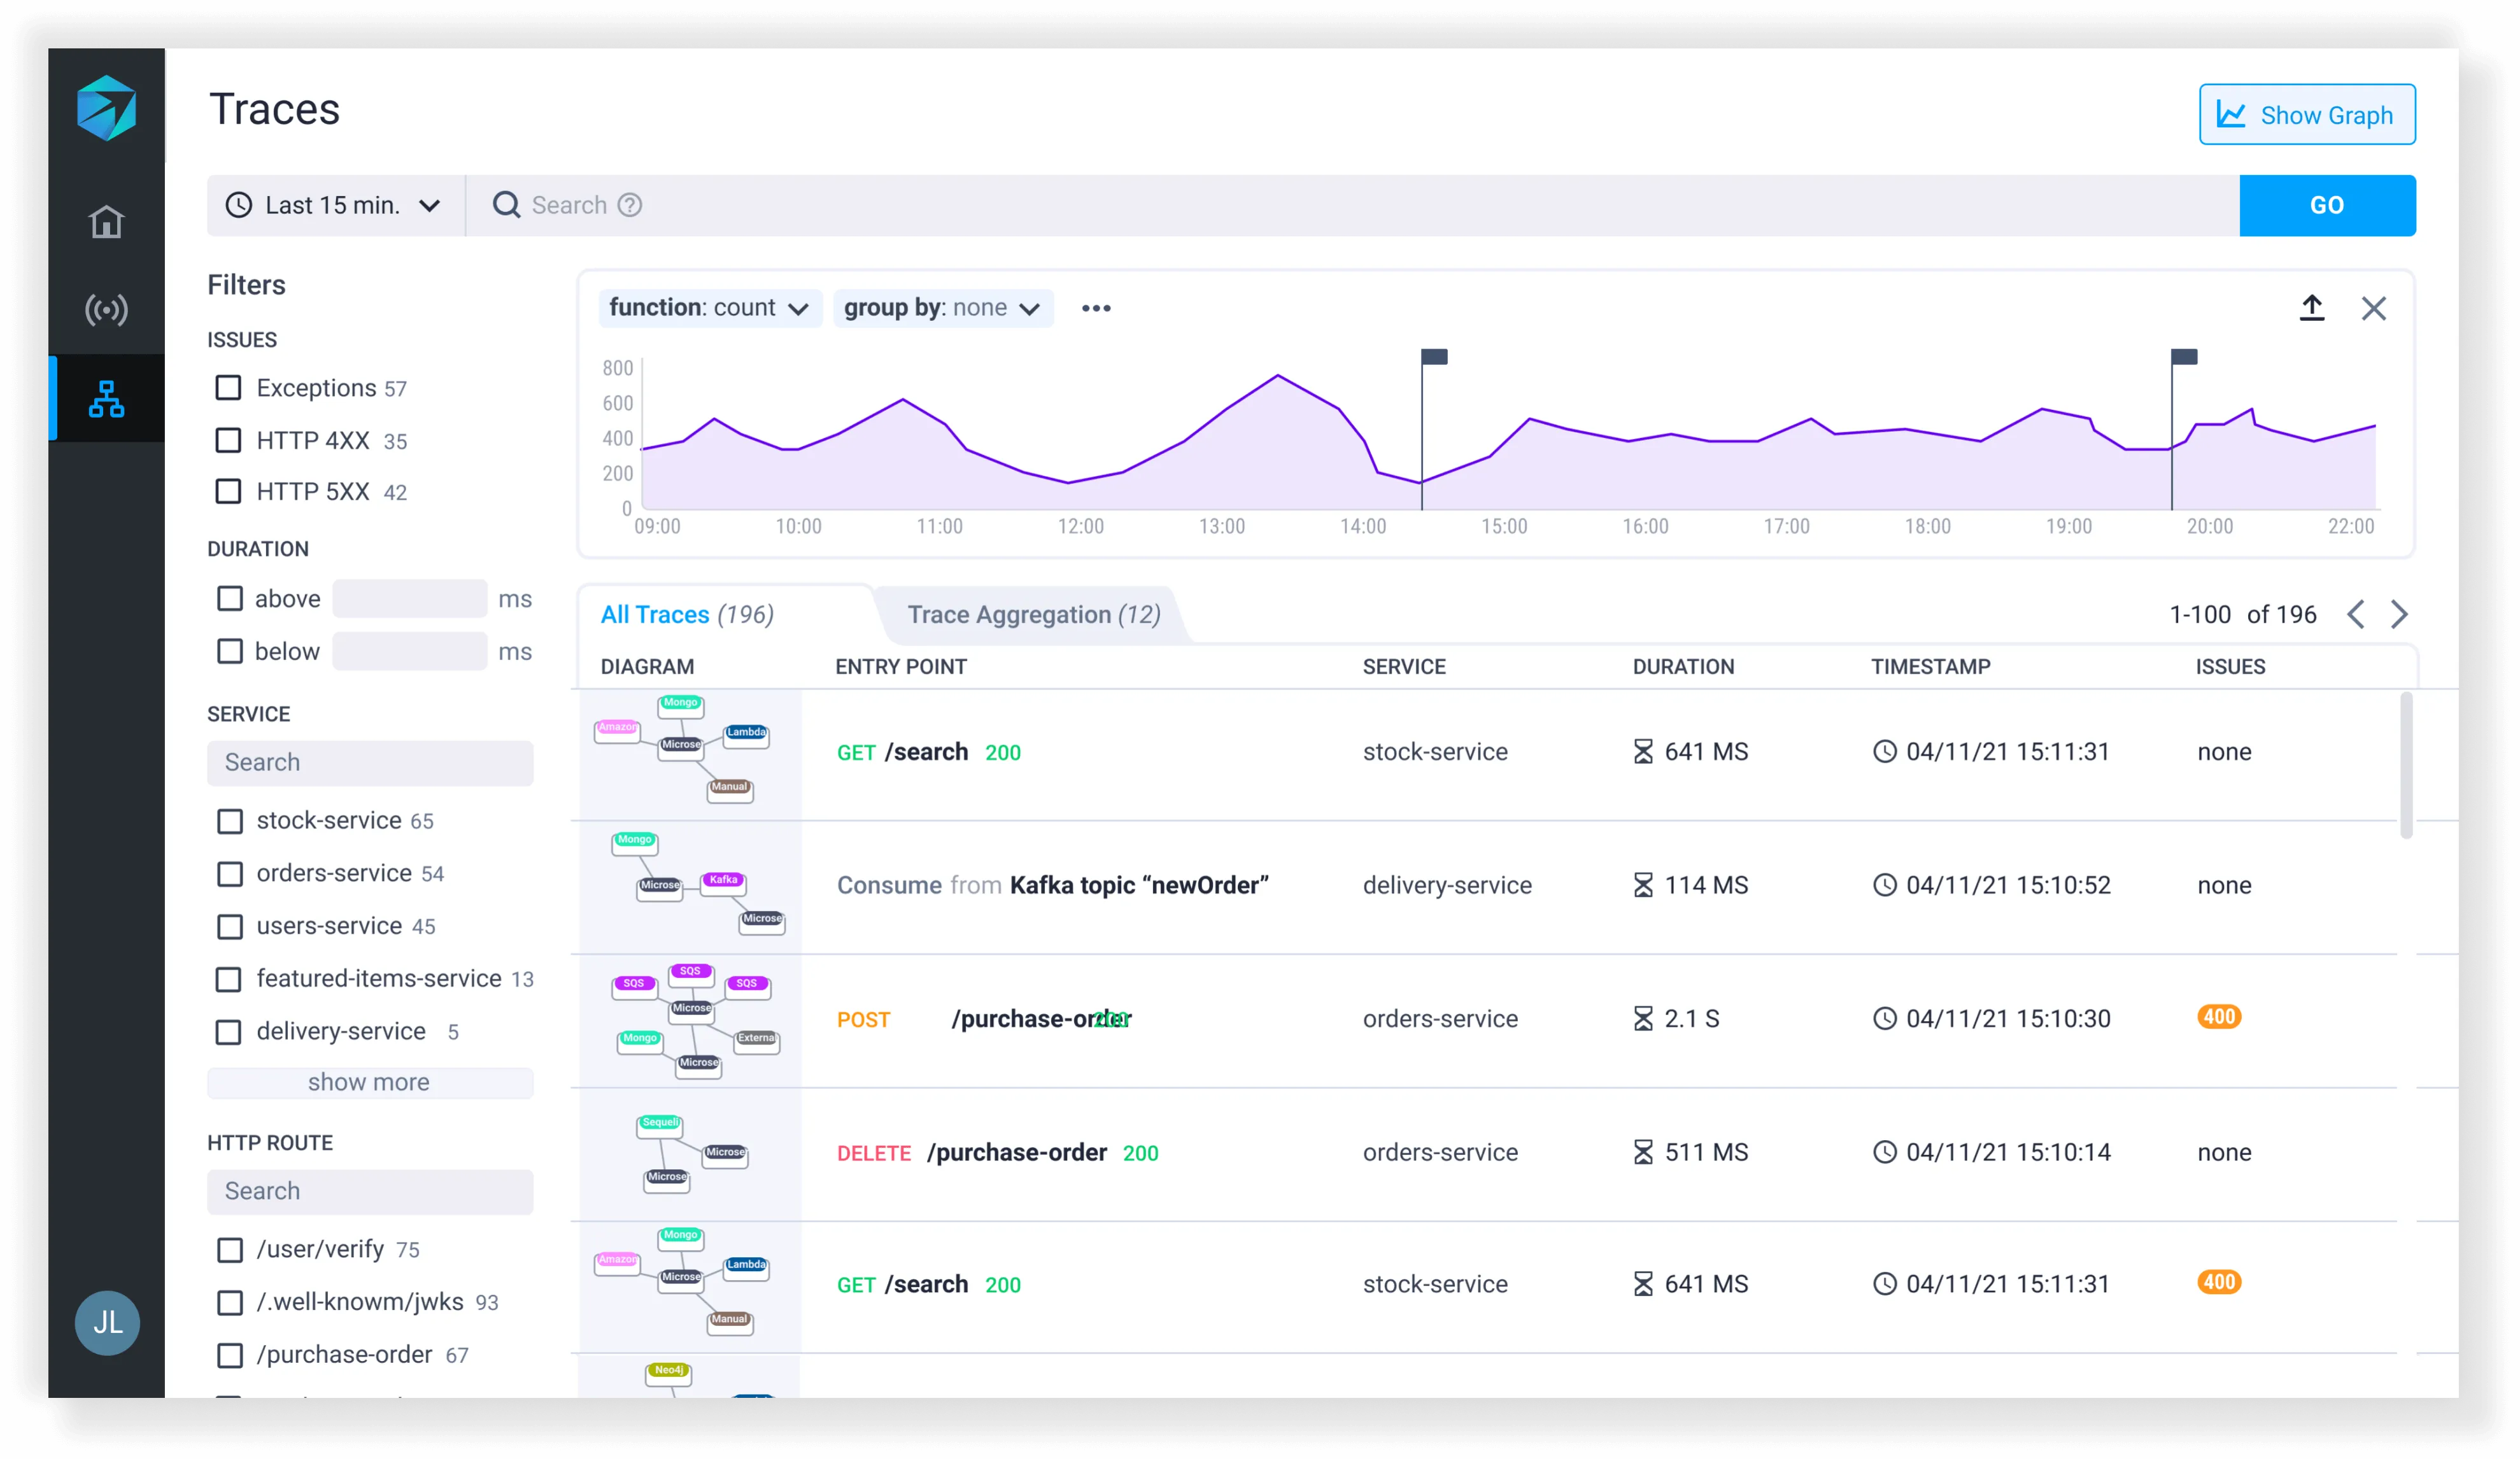
Aspecto is an observability platform powered by OpenTelemetry that simplifies the process of troubleshooting and debugging distributed applications. It stands out as a flexible and feature-rich alternative to Jaeger, offering a unified interface that requires no code changes, making it easy for developers to visualize and troubleshoot transactions within their distributed services. With its secondary dimension grouping functionality, Aspecto allows you to delve deeper into your tracing data, facilitating the identification of key system issues.
Aspecto has a built-in sampling feature that efficiently reduces telemetry costs at scale, while its comprehensive logs and traces visualization ensures complete system visibility and streamlined troubleshooting.
Key features
- Advanced OpenTelemetry data search and filtering capabilities
- Advanced service map visualization
- Built-in sampling
- End-to-end message broker visibility
- Search functionality
- Log correlation
How to choose a Jaeger Alternative?
In conclusion, when evaluating alternatives to Jaeger for distributed tracing purposes, there are certain factors you should be looking out for. Firstly, prioritize a robust and comprehensive tool, providing insights into all aspects of your telemetry data, such as metrics, traces, logs, and events. This will enable you to understand your system's performance and behavior completely, eliminating the need to use multiple tools in your setup.
Also, consider solutions built on the OpenTelemetry framework, as it provides a standardized framework for collecting telemetry data across your entire infrastructure. This standardization simplifies the process of integrating different tools and services, making it easier to manage and analyze your telemetry data.
In this case, SigNoz stands out as a robust option. It is open-source with a SaaS option and natively supports OpenTelemetry, making it a versatile solution for full-stack monitoring and observability. Also, SigNoz utilizes ClickHouse, a high-performance open-source columnar database management system well-suited for real-time analytics and managing large-scale data. This combination makes SigNoz an excellent choice for organizations seeking a scalable, performance-optimized solution for their distributed tracing requirements.
Getting Started with SigNoz
SigNoz Cloud is the easiest way to run SigNoz. Sign up for a free account and get 30 days of unlimited access to all features.

You can also install and self-host SigNoz yourself since it is open-source. With 24,000+ GitHub stars, open-source SigNoz is loved by developers. Find the instructions to self-host SigNoz.
Further Reading
Distributed Tracing with OpenTelemetry - Part 1
