Kibana vs Splunk - Choose between the Two Leading Log Management Tools
Splunk and Kibana are highly regarded for their data analysis and visualization capabilities. Splunk is a platform for searching, monitoring, and analyzing machine-generated big data, including logs, events, and metrics. Kibana, on the other hand, is an open-source data visualization dashboard for Elasticsearch.
This article aims to compare and contrast two of the industry’s most prominent data visualization tools, Splunk and Kibana. By examining their features, functionalities, and use cases, we provide readers with comprehensive insights to make informed decisions about which tool best suits their data visualization needs.
Kibana vs Splunk: At a glance
Here’s a quick overview of the differences between Kibana and Splunk.
| Kibana | Splunk | |
|---|---|---|
| Type | Open source software | Proprietary, closed-source, and commercial software |
| Search capabilities | Simplified query language | It uses (S.P.L) (Splunk Processing Language) |
| Data Ingestion | Relies on Elasticsearch for data indexing and collection | Ingests and indexes various data types from different sources. |
| Pricing and Cost | Open-source, cost-effective | More expensive |
| Target Audience | Data analysts, developers, business users | Widely used in IT operations, security, and analytics |
| Data visualization | Advanced | Limited |
| Scalability and Performance | Scalable, but relies on Elasticsearch cluster performance | Highly scalable |
| Alerting and Monitoring | Limited | YES |
| Log Management and Analytics | Limited | YES |
| Real-time Data Monitoring | Limited | YES |
| Ease of Use | User-friendly, accessible | It can be complex, may require training |
| Customization and Extensibility | customization options may be more limited compared to Splunk | It supports a wide range of apps and plugins. |
| Compliance and Security | It inherits security features from Elasticsearch but may need extra setup for advanced security. | It provides strong compliance and security features, such as role-based access control, data encryption, and audit logging. |
| Deployment Options | Deployed with Elasticsearch, which can be on-premises or in the cloud and also offers managed Elasticsearch services | Deployed as a stand-alone and offers on-premises and cloud deployment. |
Before we start deep dive into key differences of Kibana and Splunk, let’s have a brief overview of both platforms.
Overview of Splunk and Kibana
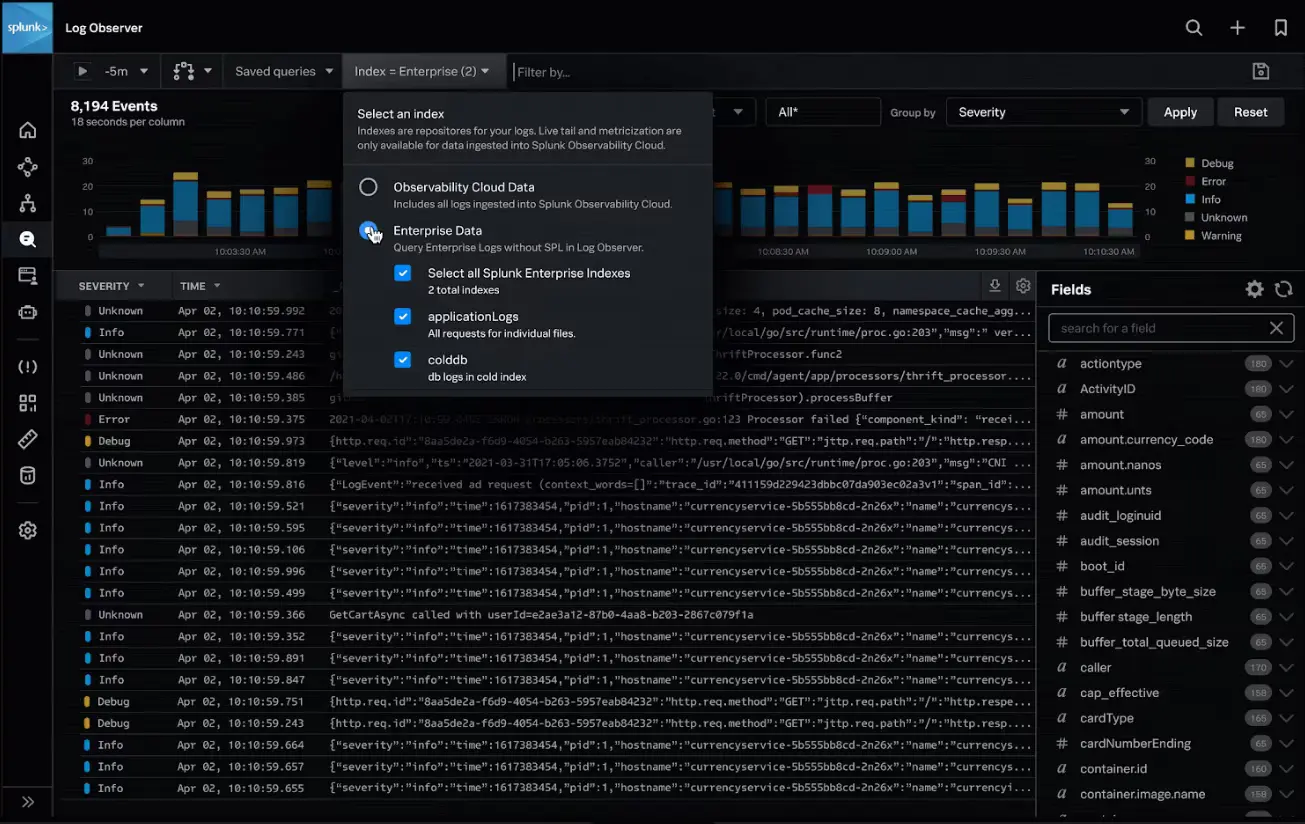
Splunk and Kibana are highly regarded for their data analysis and visualization capabilities. Splunk is a platform for searching, monitoring, and analyzing machine-generated big data, including logs, events, and metrics. It provides real-time insights into operational data through a user-friendly interface, allowing users to quickly identify and troubleshoot issues, track performance, and gain valuable insights from their data.
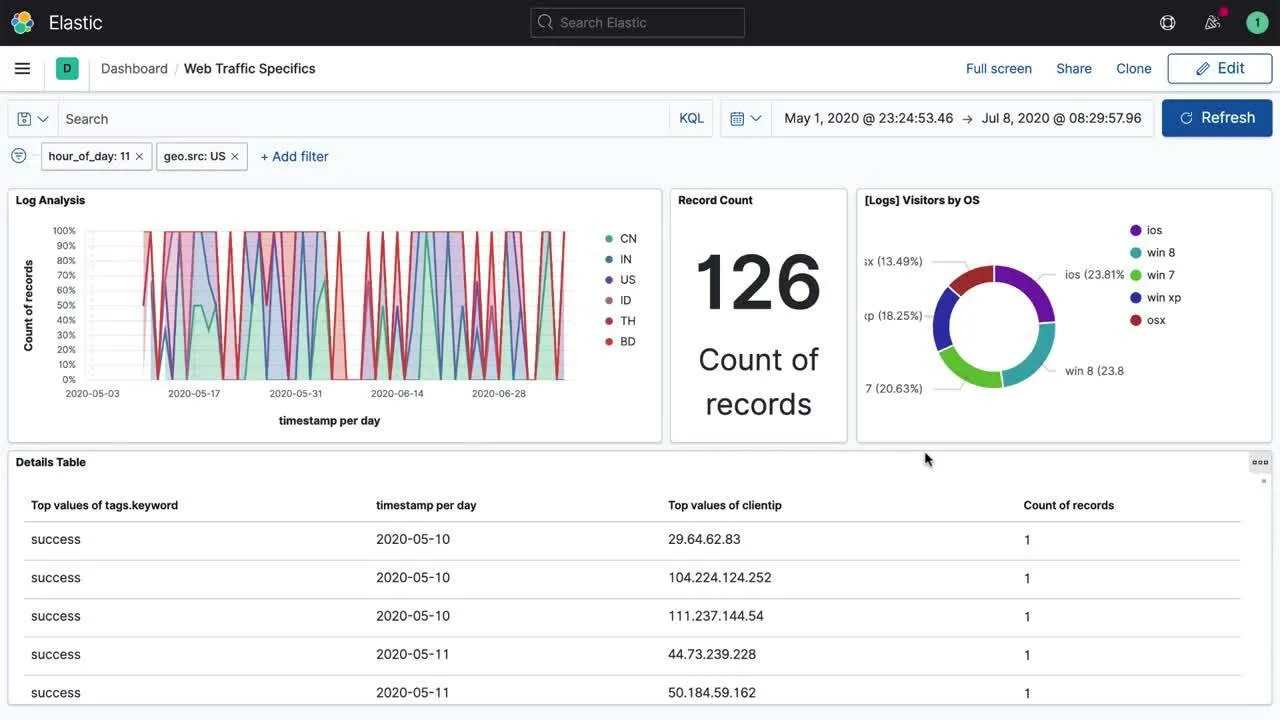
Kibana, on the other hand, is an open-source data visualization dashboard for Elasticsearch. It provides users with a variety of visualization options, including charts, graphs, maps, and tables, to help them understand and explore their data. Kibana is commonly used alongside Elasticsearch to create interactive visualizations and dashboards for monitoring, analyzing, and exploring large datasets.
Key Features of Splunk
Splunk core features include:
- Real-time Data Monitoring: Splunk offers powerful real-time data monitoring capabilities, allowing users to monitor data streams as they are generated. This enables immediate insights into system performance, user behavior, and other critical metrics, empowering users to make informed decisions quickly.
- Log Management and Analytics: Splunk's log management and analytics capabilities are renowned for their comprehensiveness. Splunk allows users to efficiently manage and analyze logs from various sources, providing valuable insights into system performance, security, and other aspects of IT infrastructure. Its powerful search and visualization features make it a popular choice for organizations looking to make sense of their log data.
-
Target Audience: Splunk's target audience primarily consists of IT operations professionals, security experts, and business analytics specialists. These professionals leverage Splunk's capabilities to monitor and troubleshoot IT systems, enhance security posture, and derive valuable business insights from data analysis.
-
Data Ingestion: Splunk is renowned for its ability to ingest and index a wide range of data types, including log files, metrics, and events. It can collect data from diverse sources such as servers, applications, and network devices. This flexibility allows Splunk to handle the complex data needs of organizations, making it a powerful tool for data analysis and monitoring.
-
Search Processing Language (SPL): Splunk utilizes its proprietary SPL (Search Processing Language) to enable users to query and analyze data effectively. SPL empowers users to conduct intricate searches and analyses on their log data, providing unparalleled flexibility and control over data exploration and extraction. This unique capability sets Splunk apart as a robust and powerful tool for data analytics and visualization.
-
Alerting and Monitoring: Splunk provides robust alerting and monitoring features, enabling users to set up alerts based on predefined conditions and monitor their log data in real time. This capability allows users to proactively detect and respond to issues, ensuring the smooth operation of their IT infrastructure. Splunk's alerting and monitoring capabilities are highly configurable, allowing users to tailor them to their specific needs and requirements.
-
Scalability: Splunk is engineered to scale efficiently, making it well-suited for organizations with substantial log management requirements. It can handle large volumes of data, ensuring organizations can effectively manage and analyze their data as it grows. This scalability is a key feature of Splunk, enabling organizations to maintain high performance and reliability even as their data needs expand.
Key Features of Kibana
Kibana is part of the ELK stack, which stands for Elasticsearch, Logstash, and Kibana. The ELK stack is a collection of three open-source tools that are commonly used together for log management and analytics.
Kibana's core functionalities encompass the following:
- Data Visualization and Dashboard Creation: In Kibana, users have the ability to create dynamic and interactive dashboards that visualize Elasticsearch queries. These dashboards can then be shared with others, enabling collaborative data analysis and decision-making. Kibana's intuitive interface and powerful visualization options make it a valuable tool for exploring and presenting data from Elasticsearch.
- Elasticsearch Integration: Kibana seamlessly integrates with Elasticsearch, offering a user-friendly interface for exploring, analyzing, and visualizing data stored in Elasticsearch. This tight integration enables users to leverage Elasticsearch's powerful search and analytics capabilities through Kibana's intuitive interface, making it easier to derive valuable insights from complex data sets.
- Target Audience: Kibana's target audience includes data analysts, developers, and business users who benefit from its powerful data visualization and exploration capabilities. These users can leverage Kibana's intuitive interface to create compelling visualizations and dashboards, enabling them to derive meaningful insights from their data.
- Search and Filter: Kibana offers robust search and filter capabilities, empowering users to swiftly locate specific data points within their log data. This functionality streamlines the data exploration process, enabling users to extract valuable insights efficiently.
- Elasticsearch Integration: Kibana's seamless integration with Elasticsearch simplifies the visualization and analysis of data stored in Elasticsearch indexes. This tight integration allows users to effortlessly create dynamic visualizations and dashboards that provide valuable insights into their data.
Key Differences: Kibana vs Splunk
Functionality and Features:
Splunk offers a comprehensive suite of features, including advanced log management, security information and event management (SIEM), and real-time data monitoring. It excels in providing a wide range of functionalities for managing and analyzing machine-generated data.
In contrast, Kibana is renowned for its powerful visualization capabilities, especially when integrated with Elasticsearch. While it may not offer the same breadth of features as Splunk, Kibana's strength lies in its ability to create interactive dashboards and visualizations for in-depth data analysis. When used alongside Elasticsearch, Kibana provides a robust platform for exploring and visualizing large datasets, making it ideal for data analysts and developers seeking to derive meaningful insights from their data.
Scalability and Performance:
Splunk is renowned for its exceptional scalability and robust performance, capable of efficiently handling vast volumes of data across diverse use cases. Its architecture allows for horizontal scaling, enabling organizations to expand their deployment to accommodate growing data needs seamlessly.
On the other hand, Kibana's scalability is closely tied to the performance of the underlying Elasticsearch cluster. Elasticsearch's distributed nature allows Kibana to scale horizontally by adding more nodes to the cluster. However, achieving optimal performance in Kibana heavily relies on properly configuring and maintaining the Elasticsearch cluster. Splunk and Kibana are scalable solutions, Splunk's reputation for handling large-scale deployments and demanding workloads is well-established, making it a preferred choice for organizations with extensive log management and analytics requirements.
Visualization and Reporting:
Splunk and Kibana both offer robust visualization features but with different emphases. Splunk's primary focus is on log management and analysis, so while it provides some visualization capabilities, they may not be as advanced or customizable as Kibana's.
However, Splunk's visualizations can still provide valuable insights into data. On the other hand, Kibana is renowned for its powerful visualization capabilities, offering a wide range of options such as bar charts, line charts, pie charts, and maps. Kibana's visualizations are highly customizable, allowing users to create interactive dashboards and reports that cater to their specific needs. Splunk and Kibana offer strong visualization features, Splunk's visualizations are more geared towards providing insights into log data, while Kibana's visualizations are highly customizable and suitable for creating interactive dashboards and reports for a wide range of data analysis purposes.
Data Collection and Indexing:
Splunk provides a comprehensive out-of-the-box solution for data collection and indexing, making it easy for users to ingest and index various types of data sources. Splunk's robust data collection capabilities include support for log files, metrics, events, and other forms of machine-generated data, allowing users to quickly start collecting and analyzing data without extensive configuration.
In contrast, Kibana relies on Elasticsearch for data indexing and collection. While Elasticsearch provides powerful indexing capabilities, setting up and configuring Elasticsearch for data collection may require additional effort and expertise compared to Splunk's out-of-the-box solution. Additionally, users may need to configure Elasticsearch to ingest and index data from different sources, which can add complexity to the setup process. Overall, Splunk's comprehensive data collection and indexing capabilities provide users with a streamlined experience for collecting and analyzing data, while Kibana's dependence on Elasticsearch for data indexing and collection may require additional configuration and setup effort.
Visualization and Reporting:
While both Splunk and Kibana offer strong visualization features, they differ in their focus and customization options.
Splunk's primary emphasis is on log management and analysis, so its visualization capabilities, while valuable, may not be as advanced or customizable as Kibana's. Splunk's visualizations can still provide valuable insights into data, particularly for log data analysis.
In contrast, Kibana is renowned for its powerful and highly customizable visualization capabilities. It offers a wide range of visualization options, including bar charts, line charts, pie charts, and maps, allowing users to create interactive dashboards and reports tailored to their specific needs. Kibana's visualizations enable users to explore and analyze data in depth, making it a preferred choice for data analysts and developers seeking advanced visualization capabilities. In summary, while Splunk's visualizations are effective for log management and analysis, Kibana's visualizations are highly customizable and suitable for creating interactive dashboards and reports for a wide range of data analysis purposes.
Ease of Use:
Kibana is renowned for its user-friendly interface and ease of use, making it accessible to users with varying levels of technical expertise. Its intuitive design and straightforward navigation make it easy for users to explore and visualize data without extensive training.
On the other hand, Splunk, while powerful, can be more complex and may require more training to use effectively. Its rich feature set and advanced capabilities can be overwhelming for new users, particularly those without a strong technical background. However, once users become familiar with Splunk's interface and functionality, they can leverage its powerful tools for advanced data analysis and visualization. In summary, Kibana's user-friendly interface makes it an ideal choice for users looking for a straightforward and intuitive data visualization tool. In contrast, Splunk's complexity may require more time and training to master, but it offers advanced capabilities for users seeking more sophisticated data analysis and management features.
Use Cases and Industry Adoption:
Splunk is widely adopted in sectors requiring robust IT operations and security monitoring, such as cybersecurity, network monitoring, and IT troubleshooting. Its comprehensive features for log management, real-time monitoring, and security information and event management (SIEM) make it a popular choice among organizations with demanding operational and security needs.
In contrast, Kibana's strong visualization capabilities make it preferred in scenarios where interactive data exploration and visualization are key, such as data analytics, business intelligence, and performance monitoring. Its ability to create interactive dashboards and visualizations makes it well-suited for users seeking to derive insights and trends from their data. Overall, while Splunk is favored for its extensive IT and security monitoring capabilities, Kibana's focus on visualization and data exploration makes it a preferred choice for users seeking to visualize and analyze data in a more interactive and intuitive manner.
Community and Support:
Splunk:
- Splunk has a large and active community with extensive documentation and forums.
- The company provides robust support options, including professional services and training.
- Splunk's community is known for its expertise and willingness to help with troubleshooting and best practices.
Kibana:
- Kibana benefits from the Elasticsearch community and has strong community support.
- Official support is primarily provided by Elastic, the company behind Elasticsearch, offering documentation and forums.
- The community is active and helpful, but the support may not be as extensive as Splunk's, especially for complex issues.
Alerting and Monitoring :
Splunk:
- Splunk provides robust alerting and monitoring capabilities.
- Users can set up alerts based on predefined conditions and monitor data in real-time.
- Splunk's alerting features are highly configurable, allowing users to tailor alerts to their specific needs.
- It offers real-time monitoring of log data, providing immediate insights into system performance and security.
Kibana:
- Kibana's alerting capabilities are more limited compared to Splunk.
- It can be extended using third-party plugins for more advanced alerting features.
- Kibana provides real-time monitoring and visualization of data from Elasticsearch.
- It is well-suited for users who prioritize data visualization and exploration over advanced alerting and monitoring features.
How to choose between Kibana and Splunk?
When deciding between Splunk and Kibana, it's essential to consider your specific needs and requirements:
- Organizations seeking a comprehensive log management and analytics platform often opt for Splunk, while those looking for a potent data visualization tool that integrates well with Elasticsearch favor Kibana.
- Splunk is the preferred choice for environments needing robust log management, security monitoring, and real-time data analysis capabilities. Use Splunk if you need a comprehensive platform for ingesting, analyzing, and visualizing diverse types of data and logs. Splunk is known for its advanced search and filter capabilities, making it easy to search and analyze data from various sources. It is suitable for businesses facing complex data analysis needs, especially large enterprises dealing with extensive log volumes and requiring robust security and alert management features. However, note that Splunk's extensive features come with substantial maintenance costs and licensing expenses based on indexed data volume.
- Kibana shines in projects that emphasize data visualization, especially when Elasticsearch is already part of the technology stack. Choose Kibana if you prioritize data visualization and exploration, especially when used alongside Elasticsearch. Kibana excels in visualizing and exploring data, offering a powerful solution for organizations focused on data visualization and exploration. It is particularly beneficial for projects that emphasize data visualization and are already using Elasticsearch. However, Kibana's alerting capabilities are more limited compared to Splunk, and it may require additional configurations or plugins for advanced security features.
While both Splunk and Kibana excel in data visualization and analysis, their suitability depends on the organization's specific needs, budget, and existing infrastructure. Splunk is unmatched in its comprehensive data analysis capabilities, making it ideal for complex enterprise environments where robust features are paramount.
On the other hand, Kibana shines in visualizing and exploring data, particularly when paired with Elasticsearch, offering a powerful solution for organizations focused on data visualization and exploration.
An alternative to Kibana and Splunk - SigNoz
SigNoz can be a great alternative to Kibana and Splunk. We provide log management as one of our core features, and in a performance benchmark, we found SigNoz to be 2.5x faster than ELK while using 50% fewer resources.
Compared to Splunk, SigNoz can be much more cost-effective. Splunk is mainly suited for enterprise use cases. SigNoz can also be a one-stop solution for all your observability needs. It provides logs, metrics, and traces under a single pane of glass. Since you have all three signals under a single tool, you can get much deeper insights about your application with the correlation between the three signals.
Getting Started with SigNoz
SigNoz Cloud is the easiest way to run SigNoz. Sign up for a free account and get 30 days of unlimited access to all features.

You can also install and self-host SigNoz yourself since it is open-source. With 24,000+ GitHub stars, open-source SigNoz is loved by developers. Find the instructions to self-host SigNoz.
Further Reading:
