New Relic vs Grafana - In-depth Comparison [2026]
New Relic and Grafana are popular monitoring and observability tools that provide a wide range of products with similar features. In this post, I have compared New Relic and Grafana on important features like APM, log management, infrastructure monitoring, application security, etc.
💡 I instrumented a sample application and sent data to New Relic and Grafana to evaluate my experience. Some takeaways are subjective and based on personal preference.
New Relic vs Grafana: Overview
New Relic is a full-stack observability platform with its own data store, while Grafana is a visualization and dashboarding layer that queries backends like Prometheus and Loki (its collection now runs through Grafana Alloy, an OpenTelemetry Collector distribution). They can be complementary (New Relic as the backend platform, Grafana for dashboards), so this is not always a strict either-or.
New Relic and Grafana are both powerful tools designed for monitoring and observability, but they serve different purposes and offer unique features. Grafana is primarily known for its data visualization capabilities, allowing users to create interactive dashboards that provide insights into their data. When integrated with the Grafana stack, which includes additional components like Loki for logging, it becomes a comprehensive observability and monitoring solution.
New Relic, on the other hand, is an all-in-one observability and monitoring solution. It integrates a wide range of features directly within its platform.
Here’s a quick overview of the overall platform features and functionality of New Relic and Grafana.
| Features | Grafana | New Relic |
|---|---|---|
| APM | ✅ | ✅ |
| Log management | 🟡 | ✅ |
| Infrastructure monitoring | 🟡 | ✅ |
| Visualization | ✅ | ✅ |
| Real user monitoring | ✅ | ✅ |
| OpenTelemetry support | ✅ | ✅ |
| Incident response and management | 🟡 | ✅ |
| Application security | ❌ | ✅ |
| Free Tier | ✅ | ✅ |
✅ - Available
❌ - Not Available
🟡 - Limited
APM: New Relic
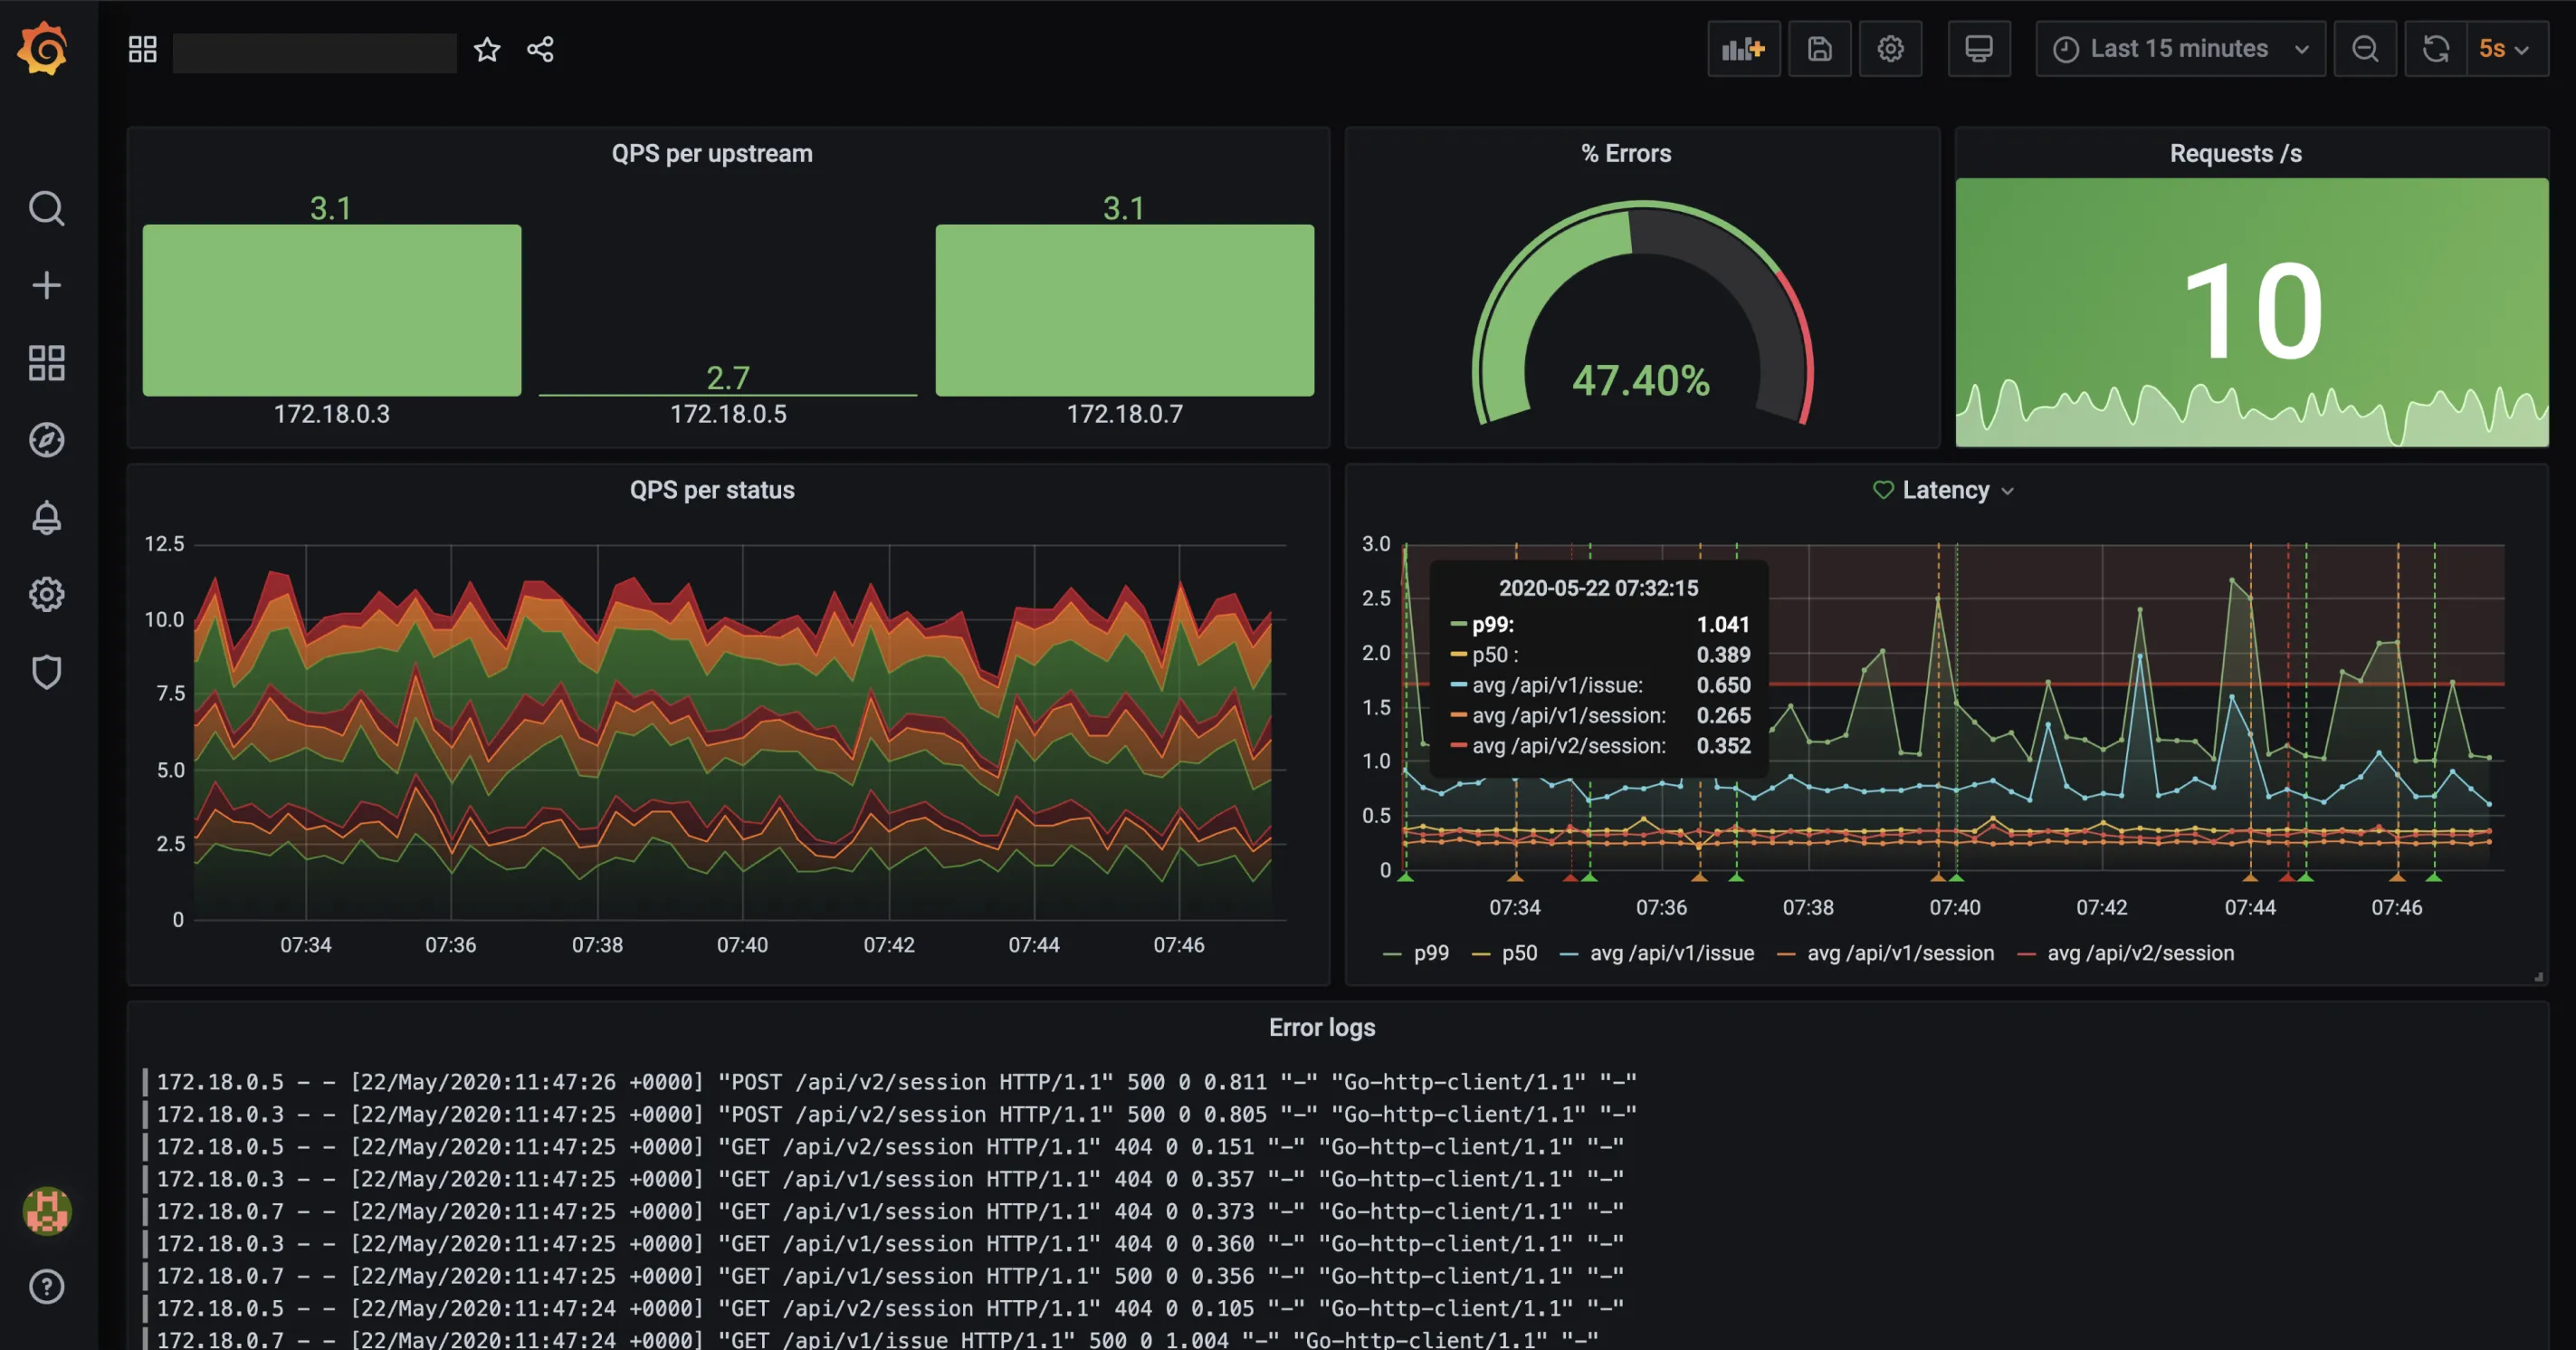
To evaluate the APM feature in Grafana and New Relic, I sent data from a sample application to both platforms. The APM setup in both platforms was simple with Grafana having extra steps.
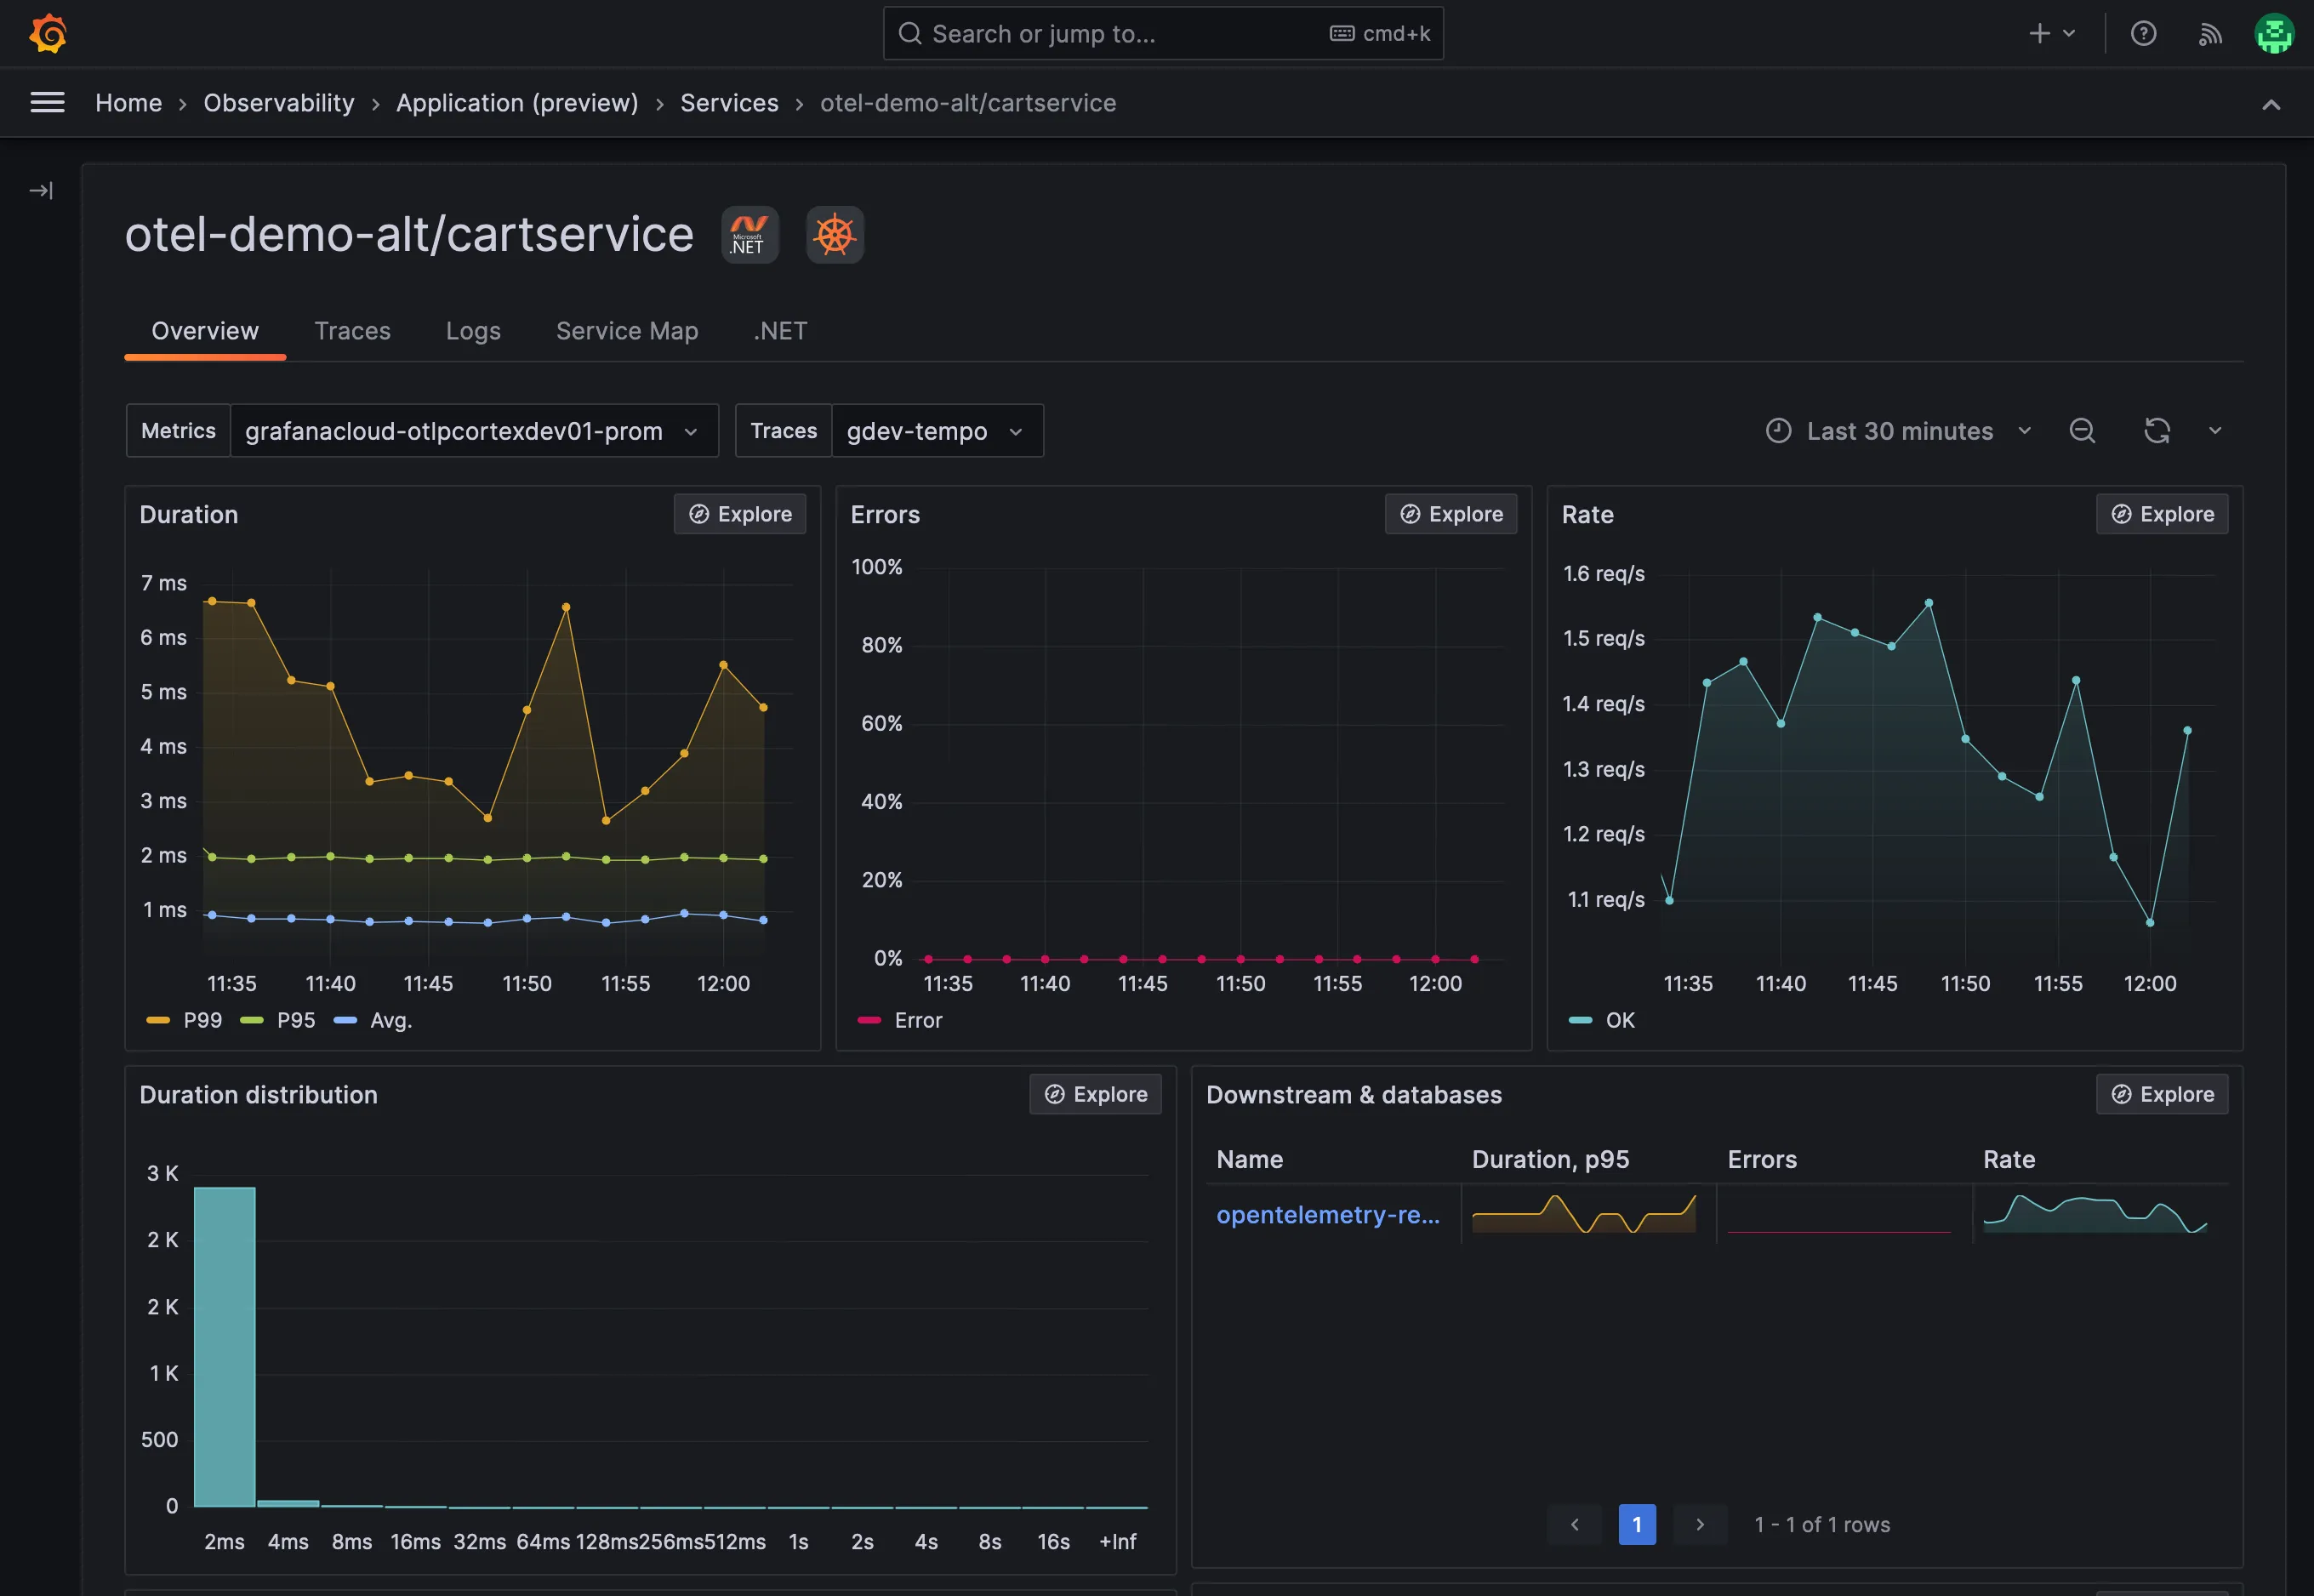
Grafana Cloud uses its Application Observability solution to observe and monitor the performance of applications. This solution allows for the detection of anomalies in applications and root cause analysis. It helped me identify request failures in my application.
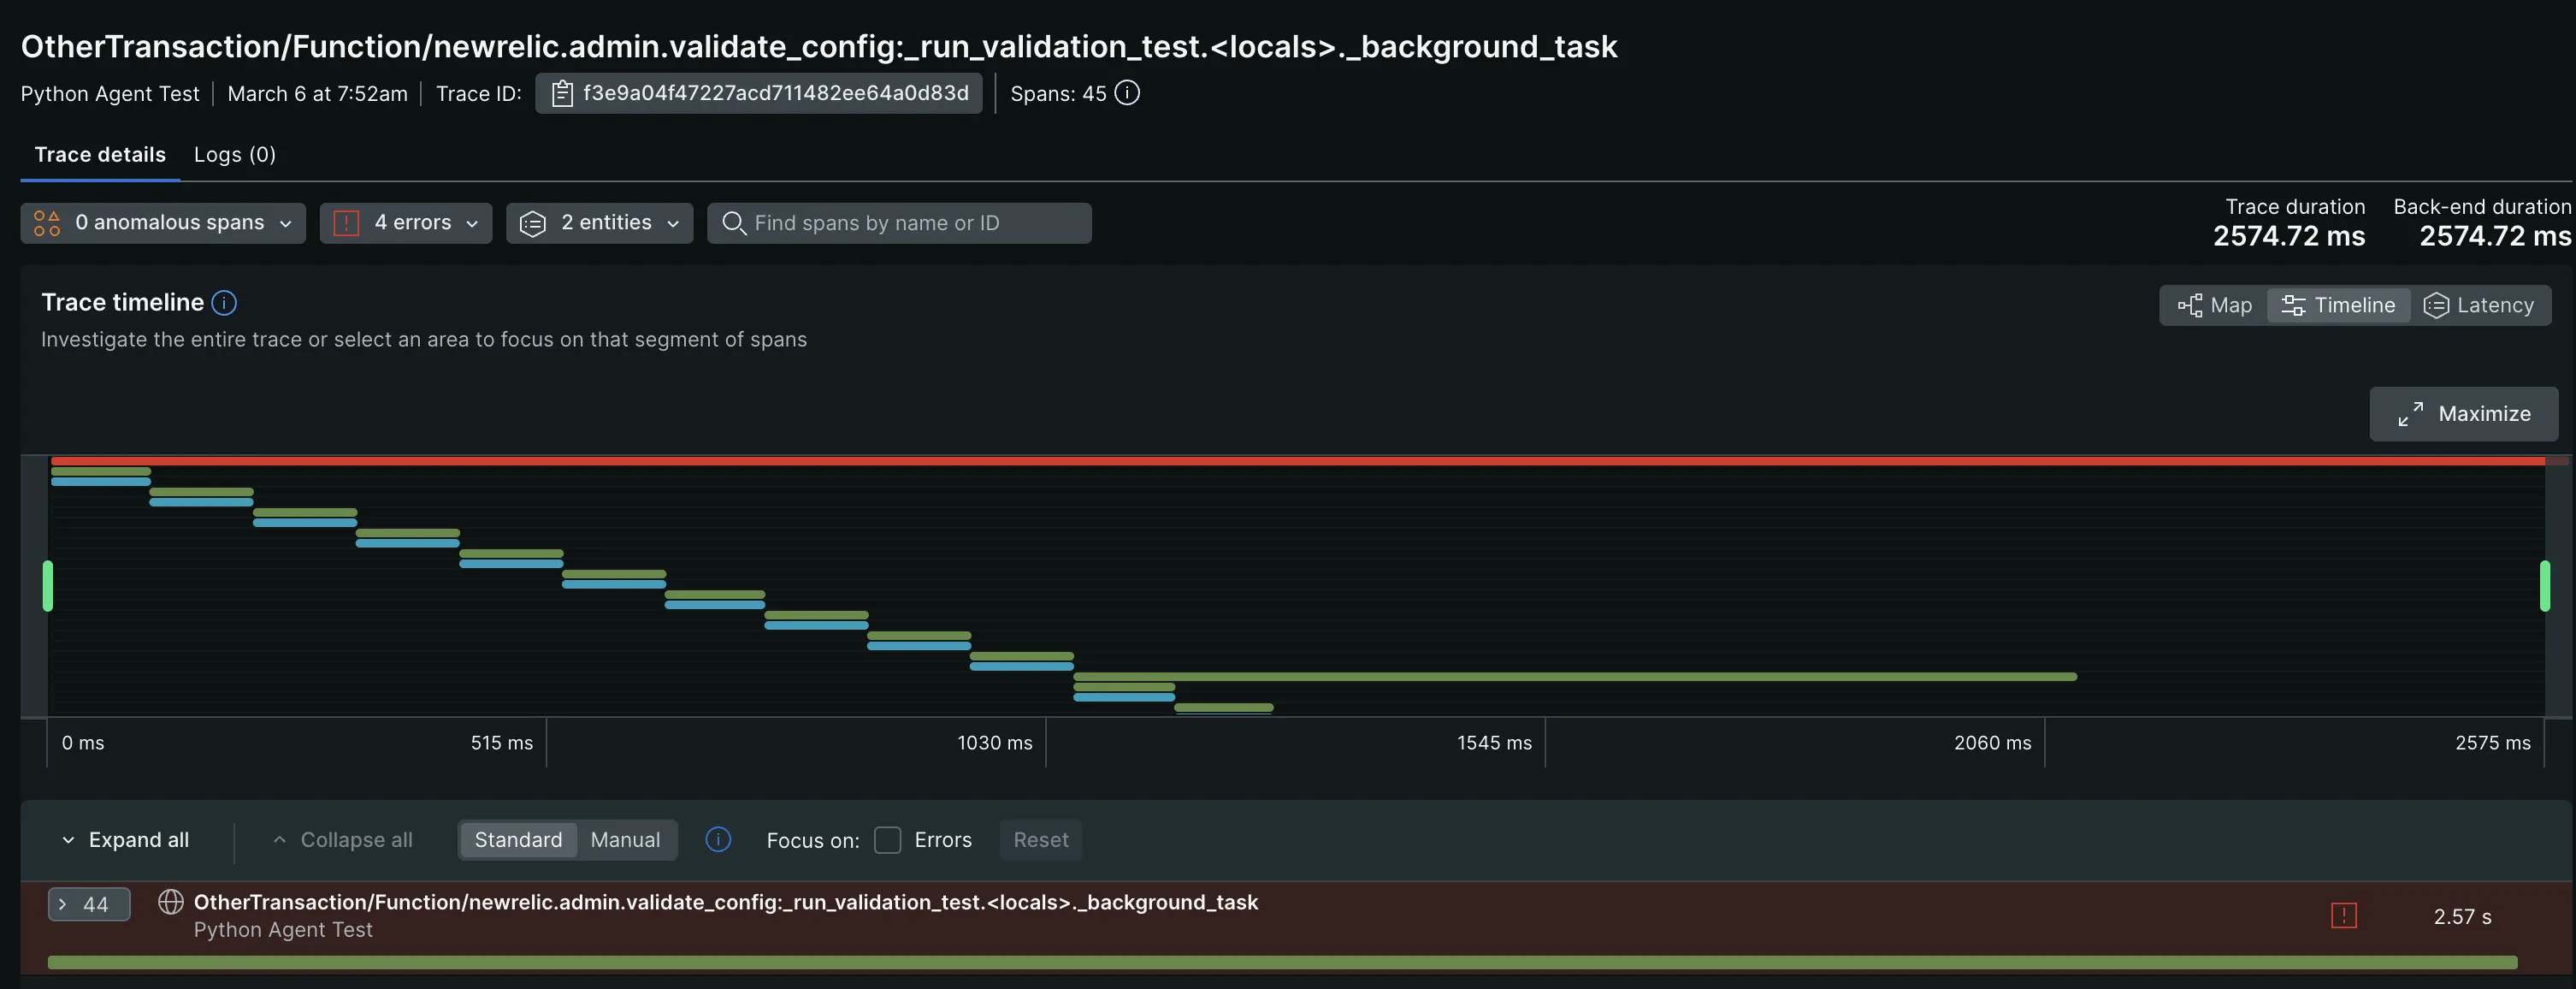
New Relic’s APM feature provided me with real-time monitoring of my application’s telemetry data, including metrics, logs, events, and transactions, through a combination of pre-built and custom dashboards. On the Distributed Tracing page, I was able to filter traces by Trace Groups, Root entry span, Root entity, and Errors. This allowed me to focus more on specific traces with failures and latency issues.
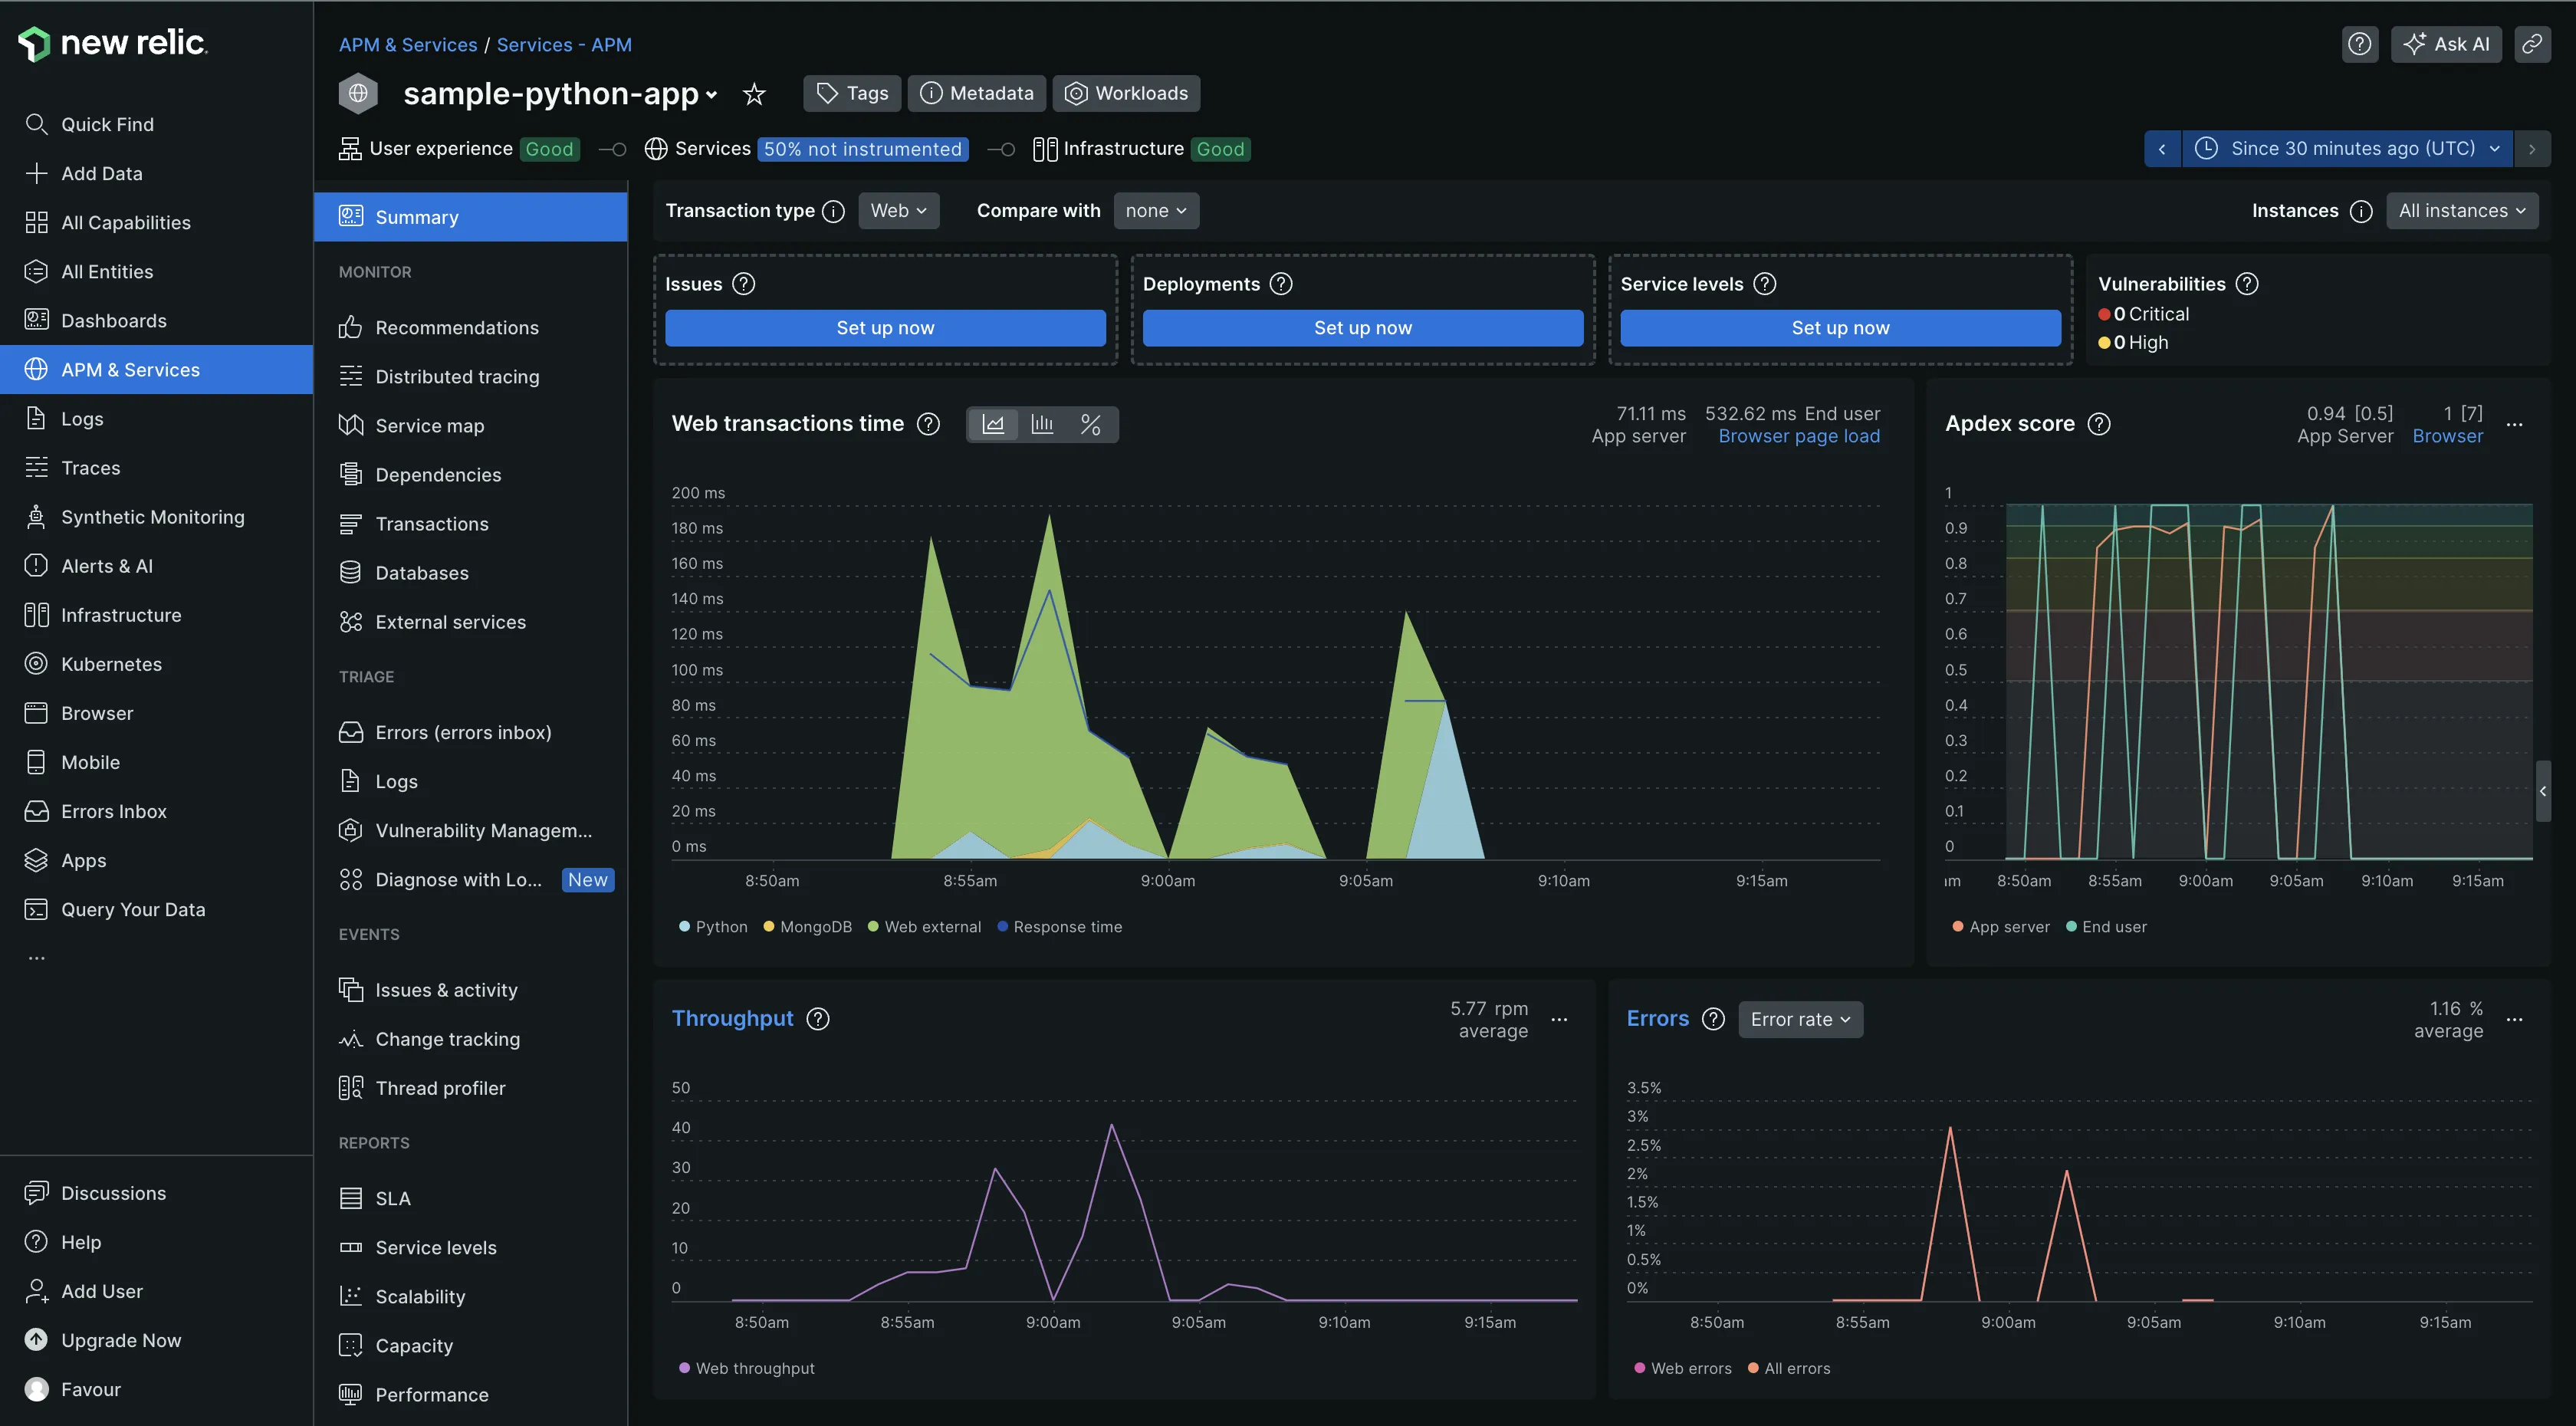
With New Relic, you can visualize inter-service relationships and dependencies within an application using service maps, end-to-end visibility of requests using flamegraphs, generate SLA reports, manage vulnerabilities, and more. New Relic provided me with a lot of information on my application’s performance.
Both tools have good APM capabilities. If you require deep insights into your application and its performance, New Relic is a better choice.
Log Management: Grafana for cost effectiveness, New Relic for better log insights
Grafana uses Loki from the Grafana stack for log management. Loki is a log aggregation tool designed to store and query logs from all your applications and infrastructure.
Loki indexes only the metadata (labels) of logs, compresses them into chunks and then stores them in object storage like S3 buckets. The compressed chunks, smaller index, and use of low-cost object storage, makes Loki less expensive to use.
Other features of Loki:
- Live tailing of logs as they come into the system
- Ingests logs without requiring any formatting requirements.
- You can build metrics and generate alerts from your log lines
Log management in New Relic didn’t require any setup at all, my application and system logs were automatically collected by the New Relic agent. I could immediately visualize and query them in the logs tab. Log query in New Relic is done using Lucene, an open-source search library, and the New Relic Query Language (NRQL). They both allow for instant query and analysis of log data.
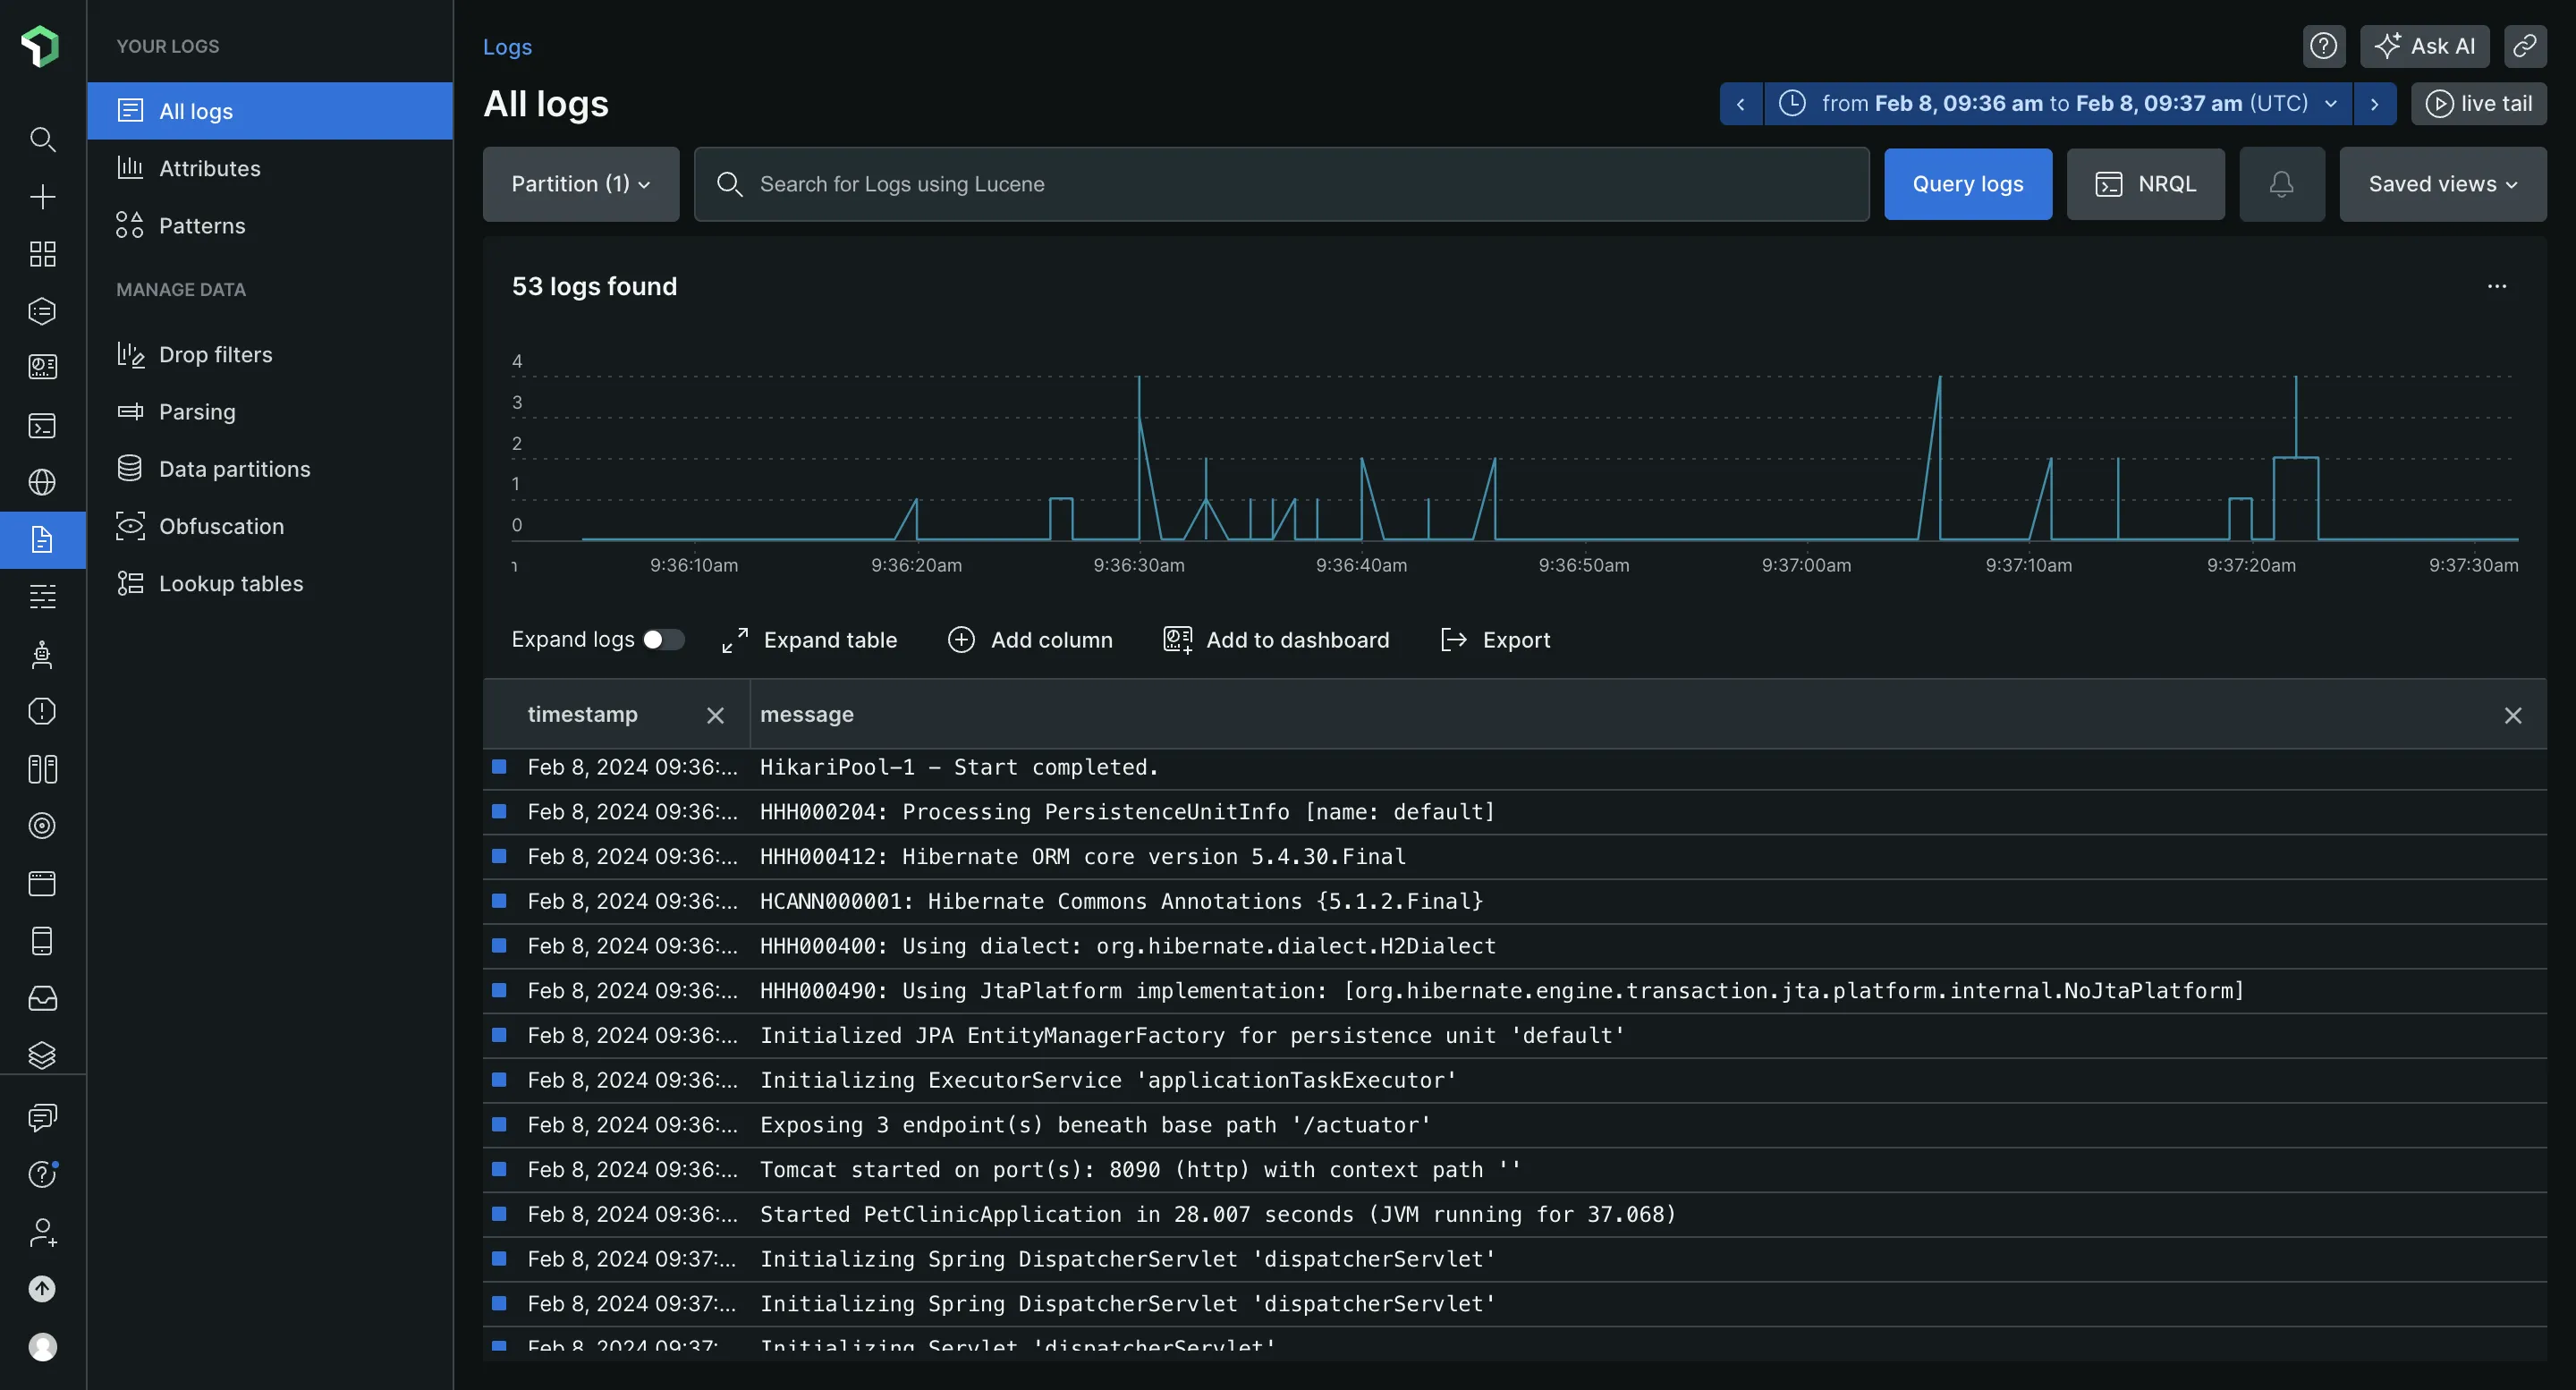
Other New Relic log management features include:
- Root cause analysis for troubleshooting
- Live archives for compliance
- Ingest logs from anywhere using New Relic and open-sourceforwarders.
- Dive deeper into log data by using our logs UI, and create custom charts, dashboards, and alerts.
If your focus is log aggregation, scalability, and cost-effectiveness, Grafana Loki is the better choice. If you prioritize a friendly GUI with more search capabilities to better understand your log data, choose New Relic.
Infrastructure Monitoring: New Relic
Grafana Cloud allows for infrastructure monitoring of AWS, Kubernetes, and Grafana integrations such as Linux machines, databases, applications, and more. It provides a managed Grafana instance, integration with various data sources, powerful visualization tools, and alerting capabilities. This allowed me to focus on monitoring my infrastructure without the complexities of managing the underlying infrastructure. I was also able to create customized dashboards to monitor specific metrics from my infrastructure.
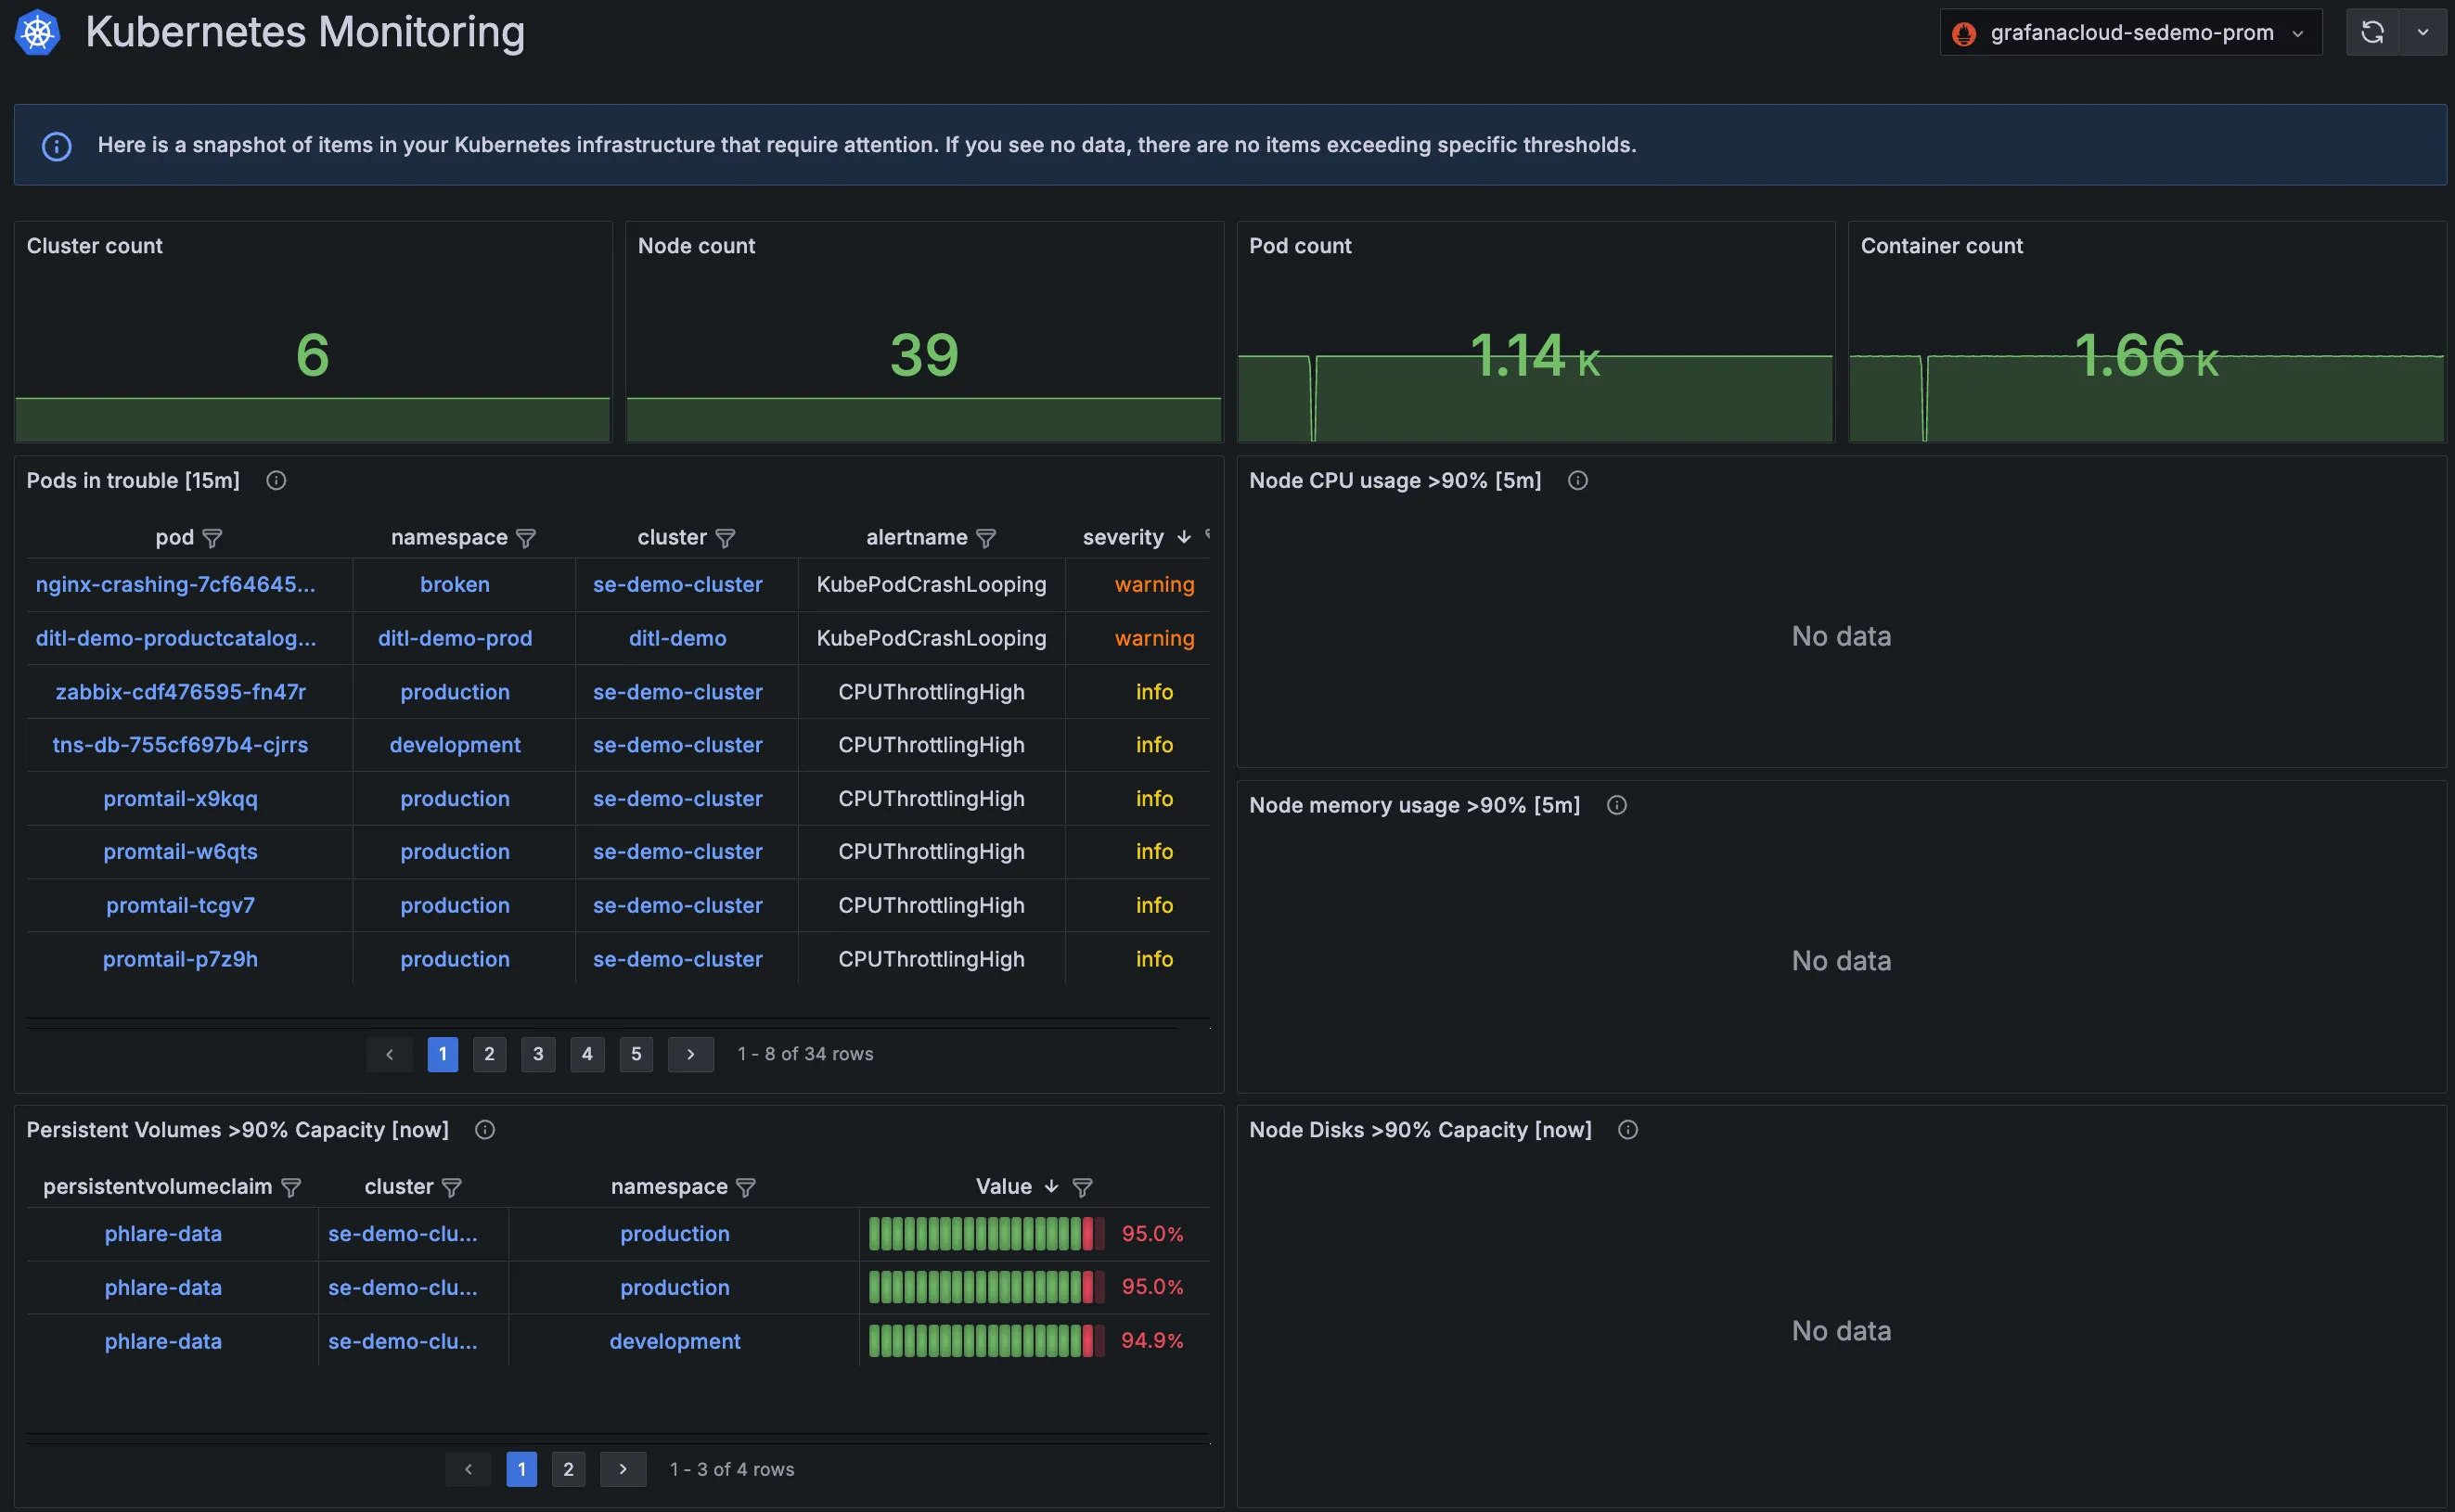
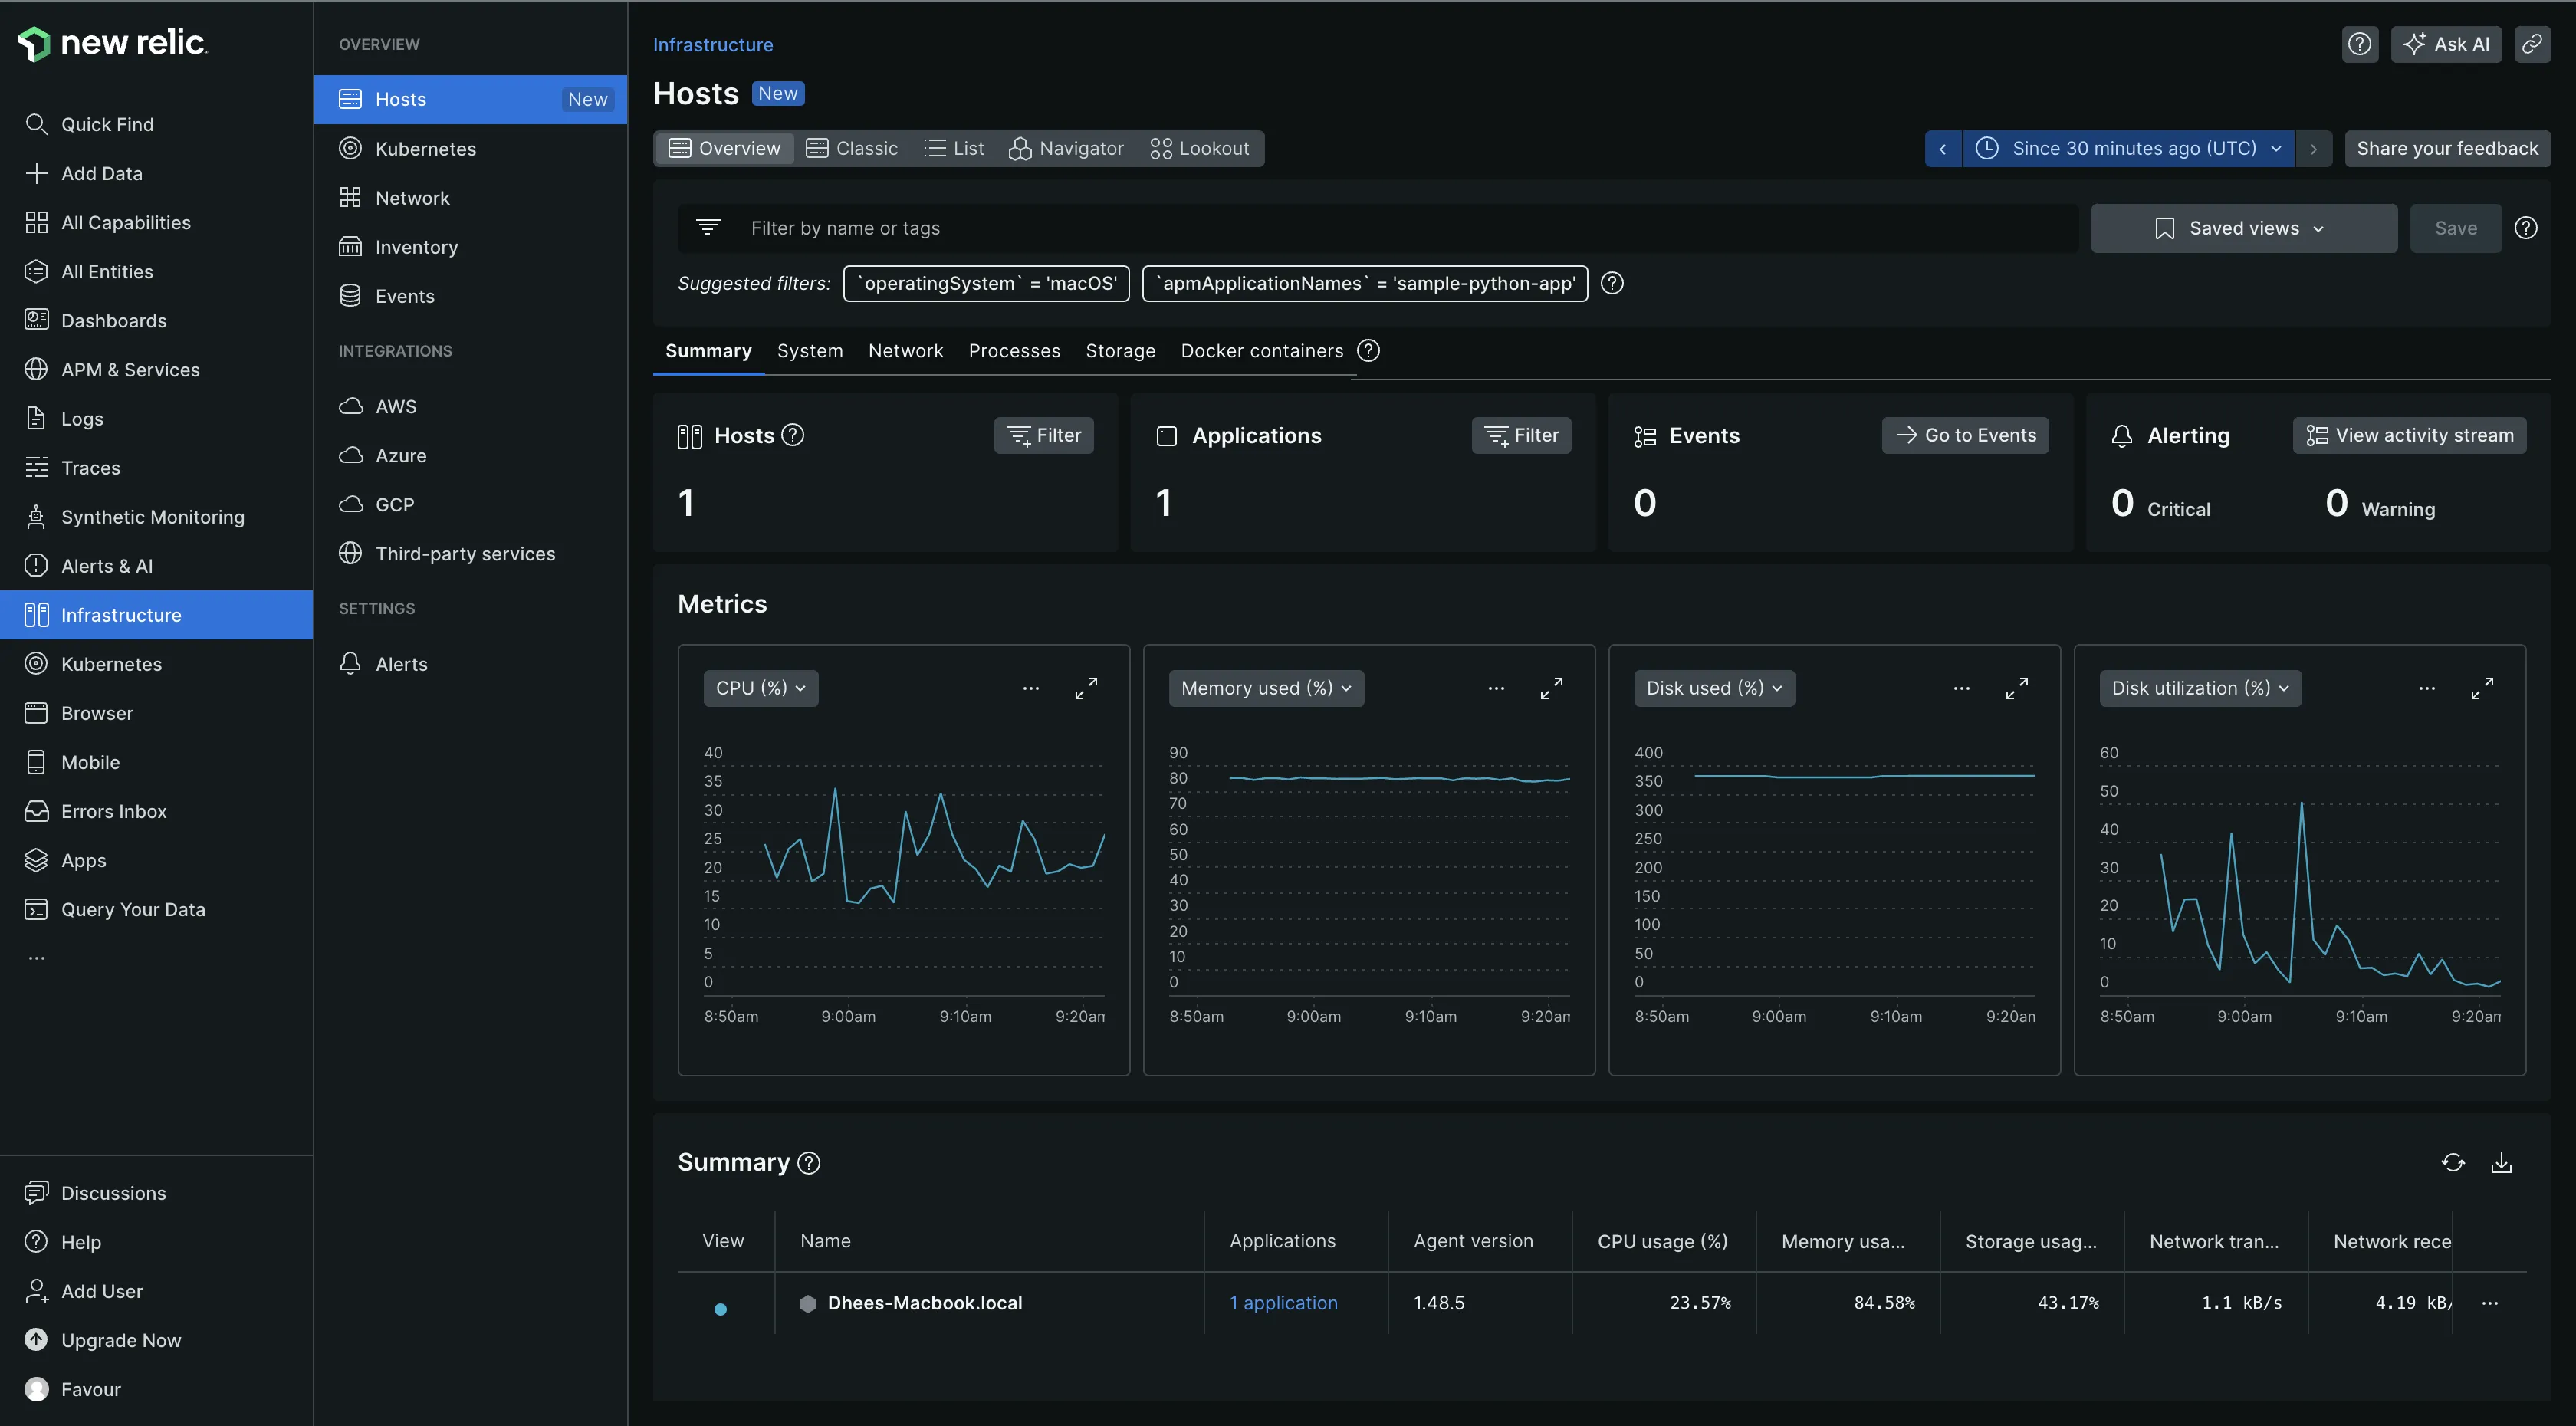
In New Relic, you can monitor different infrastructure types by deploying the infrastructure agent. The agent automatically collected and sent data from my host infrastructure and services running on it to the New Relic platform. It provided out-of-the-box dashboard for me to visualize my infrastructure data.
With New Relic infrastructure monitoring, you can:
- Query your data to drill down into your infrastructure events and build custom dashboards to share with your team.
- Address performance issues, regardless of the origin through APM data connection with infrastructure monitoring.
- Manage alert settings directly from the relevant infrastructure chart.
- You can also see log messages related to your errors and traces directly in your app's or host's UI.
When choosing between Grafana and New Relic for infrastructure monitoring, consider the costs. Both tools can be expensive but the cost can be less depending on what you want to monitor.
Visualization: Grafana
Grafana stands out for its exceptional visualization capabilities, offering a wide range of tools and features that enable users to create dynamic, interactive, and insightful dashboards. These capabilities are designed to help users quickly understand complex data, making it easier to identify trends, patterns, and anomalies.
Similarly, New Relic has robust visualization features that are equally impressive. These features are tailored to provide clear, comprehensive views of your application and infrastructure performance, allowing for effective monitoring and decision-making. Whether it's for real-time performance monitoring or in-depth analysis of historical data, New Relic's visualization tools are designed to enhance your understanding and control over your systems.
Both tools offer great visualization capabilities. If you need more customization or want to visualize data from multiple sources, choose Grafana. If your focus is on real-time monitoring and application performance optimization, choose New Relic.
Incident Response and Management: New Relic
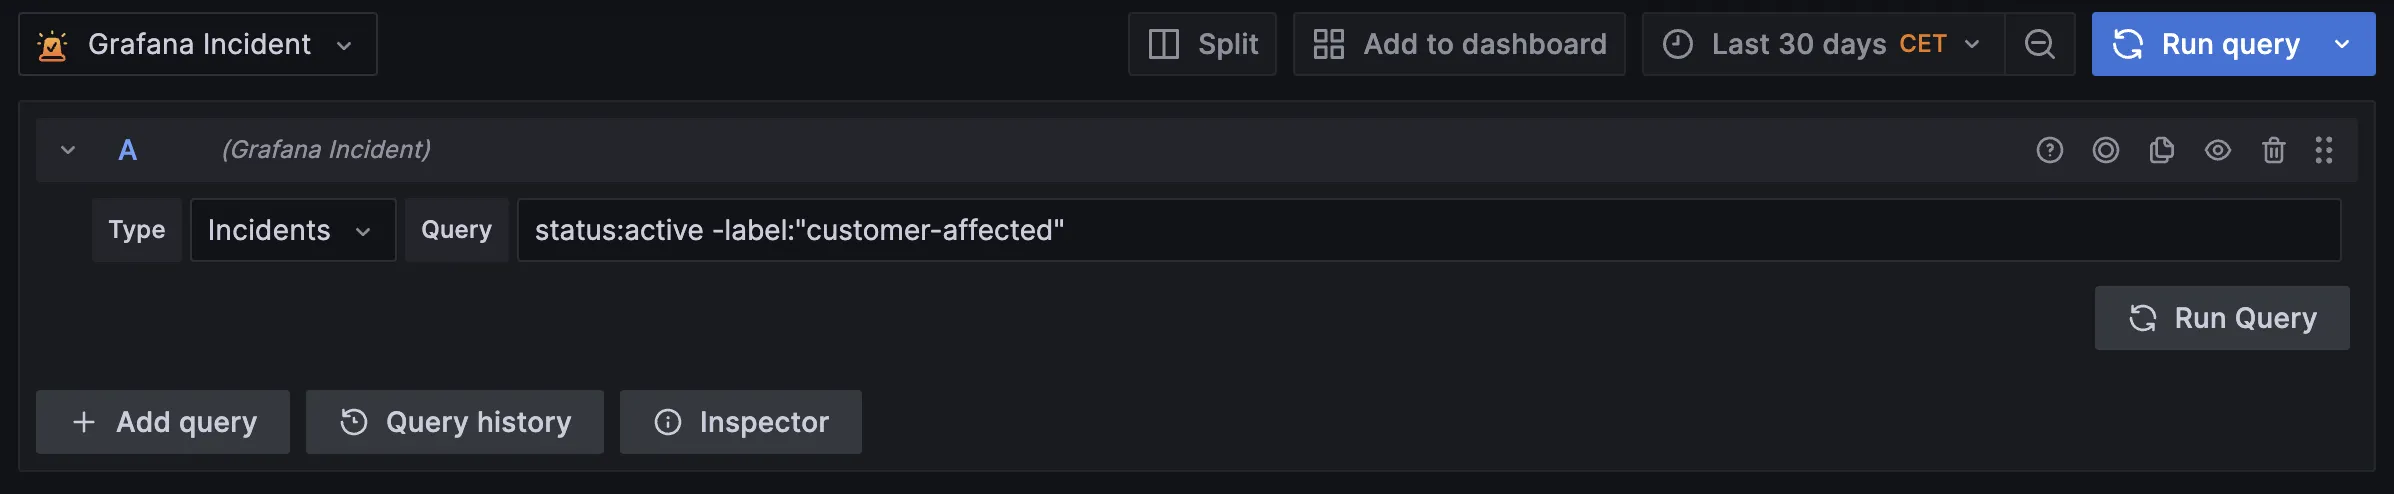
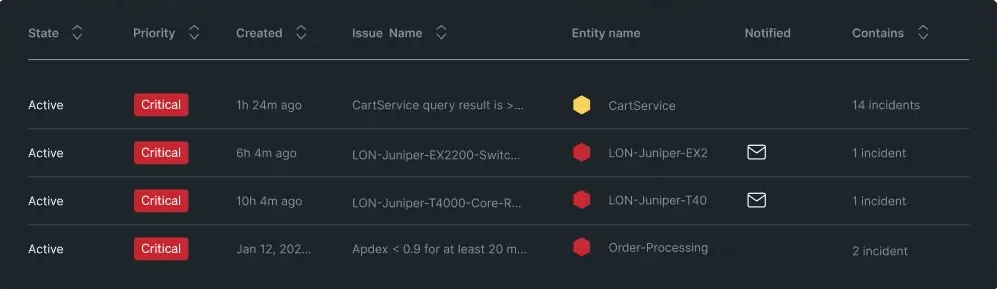
Grafana Cloud provides an Incident Response & Management (IRM) tool, that allows users to quickly detect, respond to, and learn from incidents directly within the Grafana Cloud environment. Grafana Incident helps users to continuously improve their processes for responding to and learning from incidents.
Some of the features IRM provides include:
- Quick detection of issues and changes in your production systems
- Easily escalate alerts to the right teams
- Automation of declaring, assigning tasks, and communicating for incidents of any severity
- Identification of actionable insights on incidents across services, teams, or geos.
- Query of incident data
New Relic provides an AIOps and Applied Intelligence tool for incident management. This feature integrates machine learning and advanced logic to minimize the impact of redundant alerts, allowing for a swift focus on alerts that indicate genuine issues. It can also correlate related incidents for quicker identification and resolution.
The platform supports real-time collaboration among teams through contextual notifications, ensuring that all relevant parties are informed and can contribute effectively. It provided me with detailed and in-depth information on root causes and the response history. This comes in handy for post-incident reports, providing valuable insights for future incident management strategies.
For better incident management using advanced technologies, providing more features and allowing collaboration with team mates for faster incident resolution, choose New Relic.
Application Security: New Relic
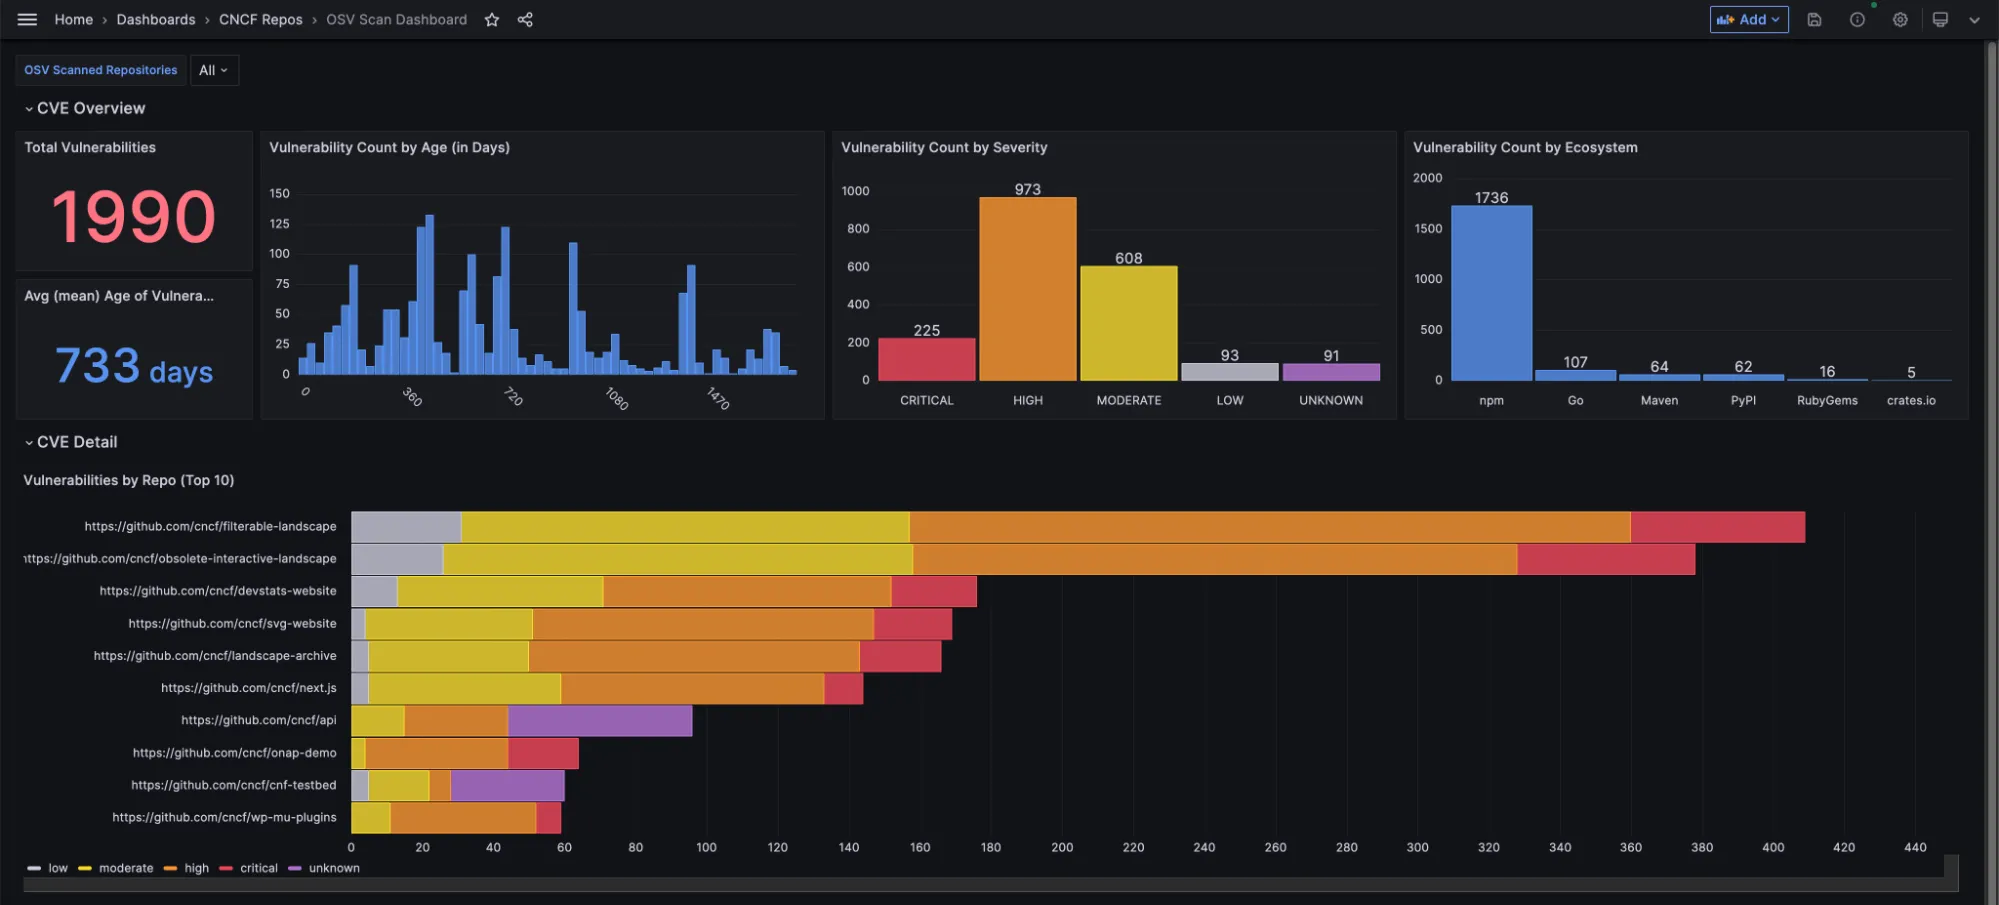
Grafana does not exactly have an inbuilt product or feature for application security but it does allow for integration with open-source tools like MergeStat and OSV-Scanner for scanning vulnerabilities in environments. You can also configure security hardening for additional security, to prevent vulnerabilities from being exploited by an attacker.
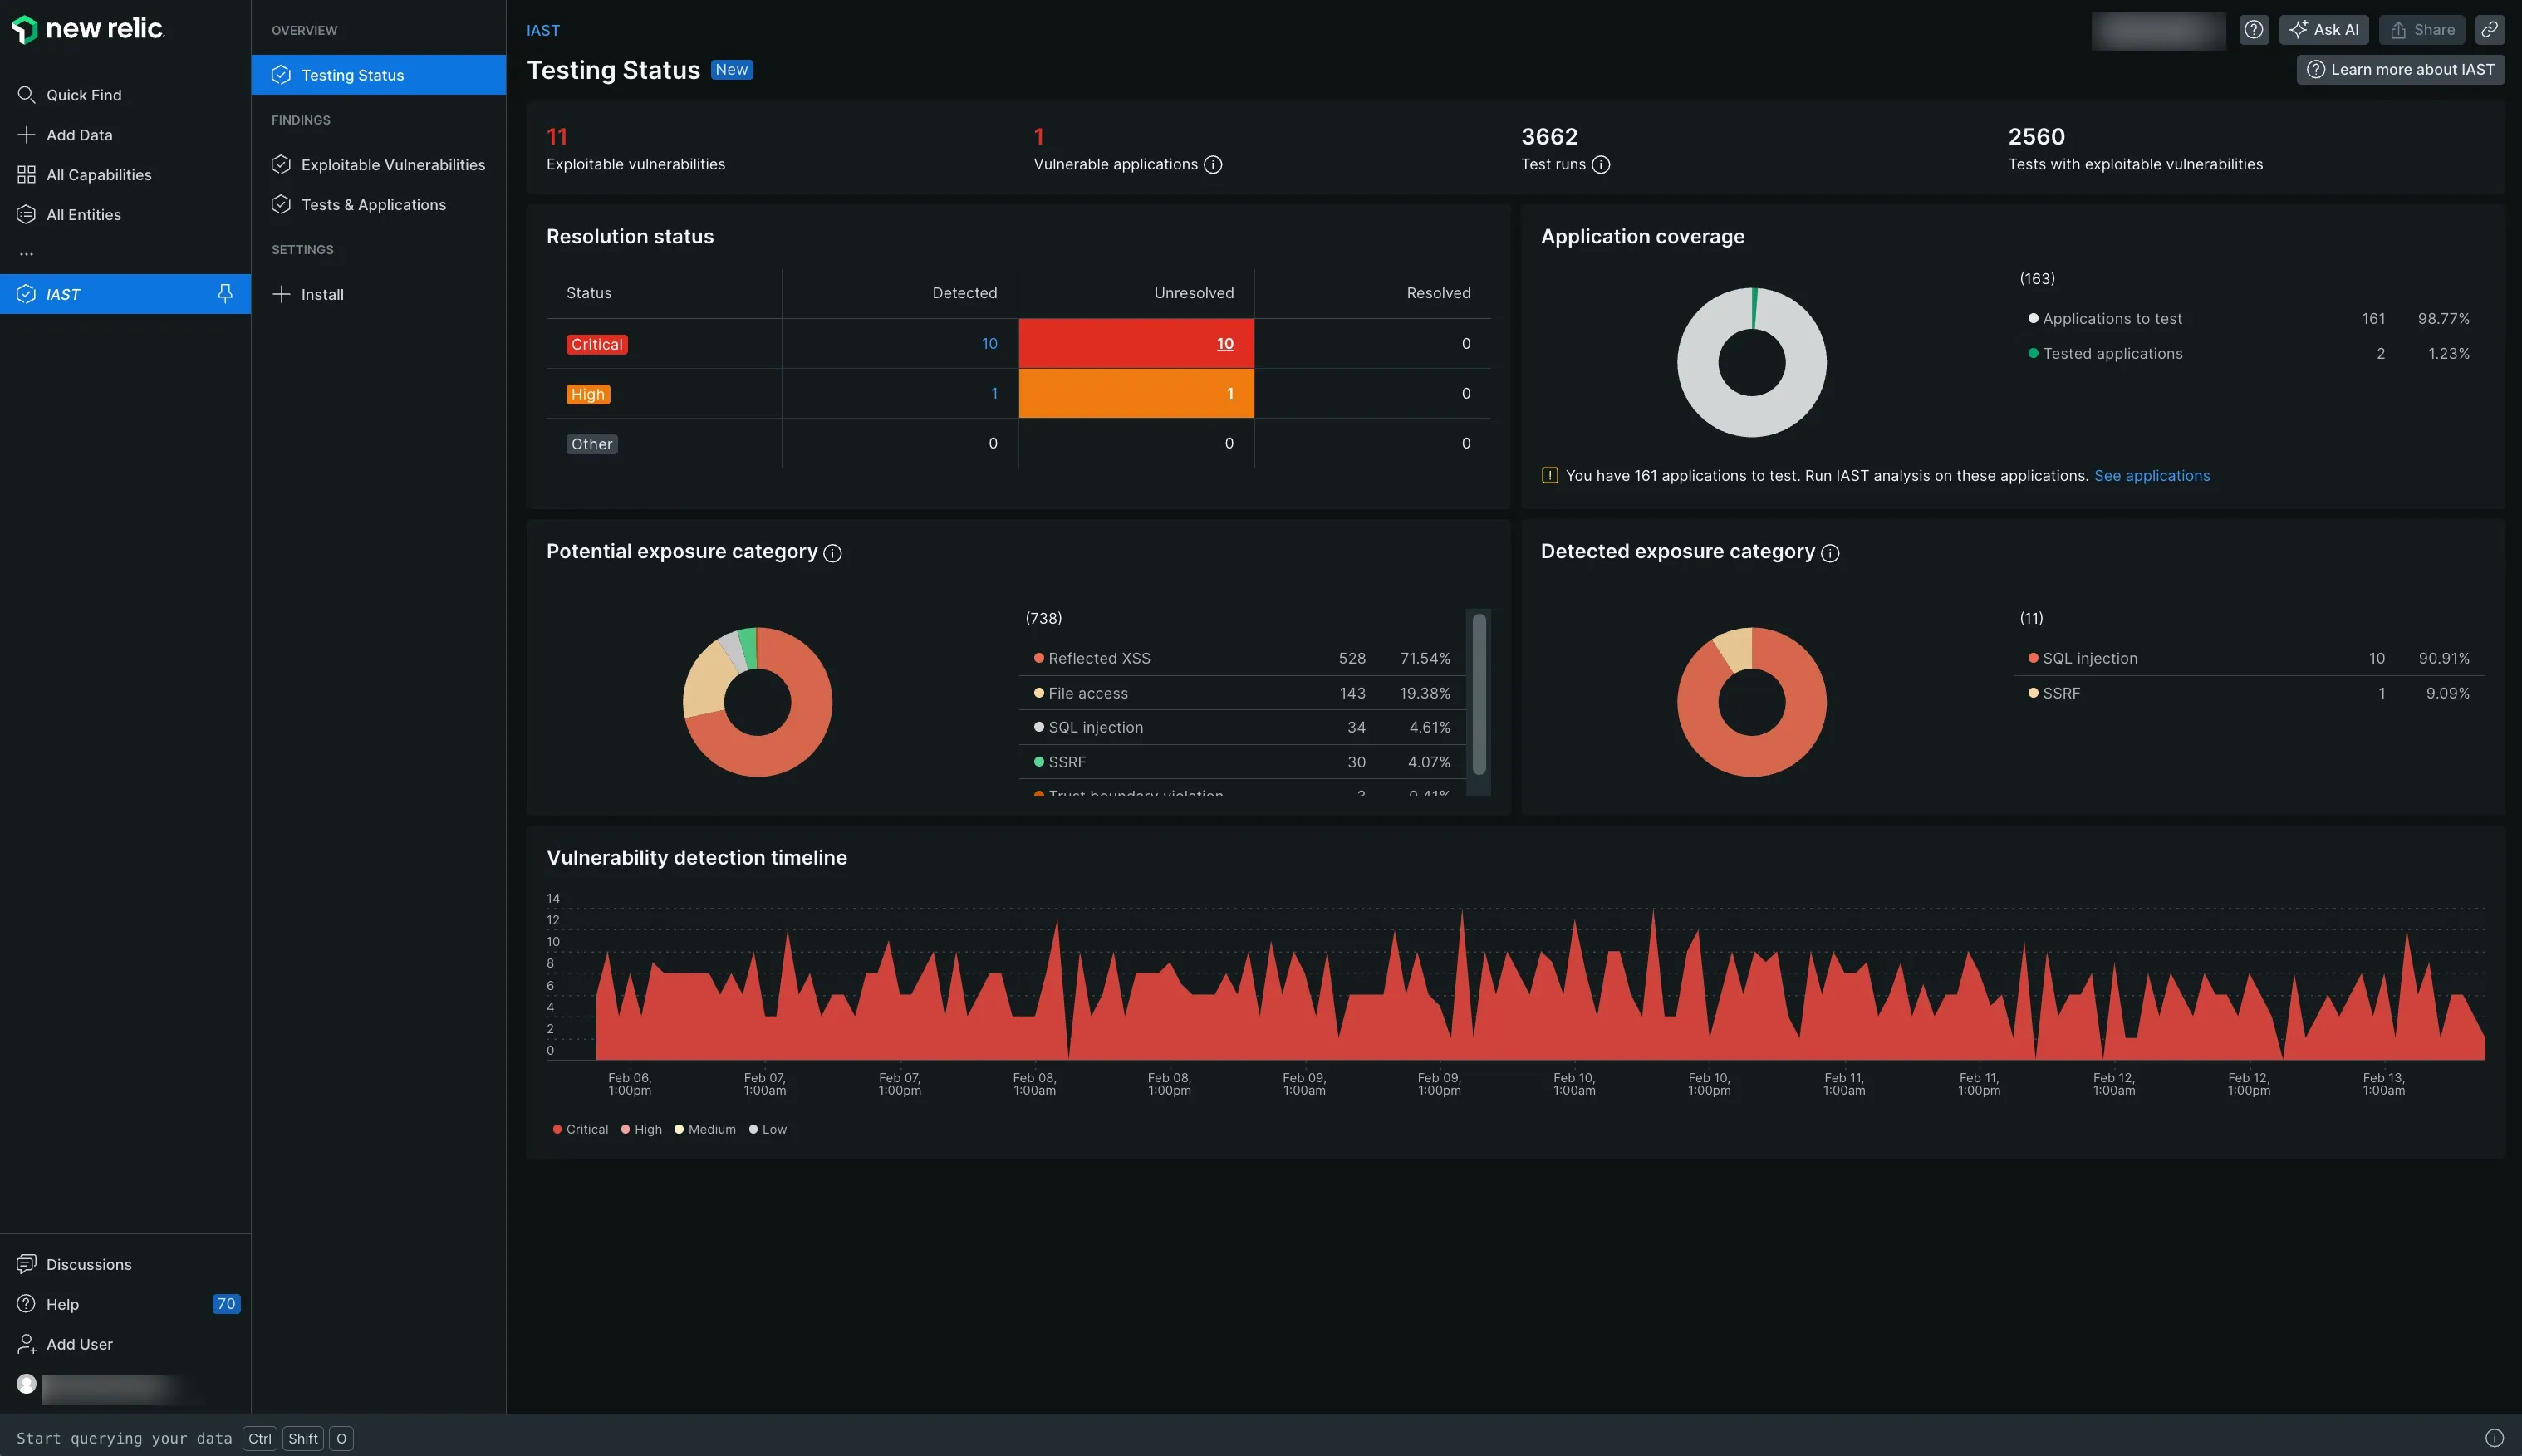
Application security in New Relic is carried out using the Interactive Application Security Testing (IAST) feature. IAST provided 360 visibility into the risks and vulnerabilities in my application. The built-in guardrails within IAST were instrumental in mitigating these security risks.
IAST can be incorporated into development processes as it allows for the identification and resolution of security issues without the need for separate, time-consuming security testing phases. This approach streamlines the development workflow, ensuring that security considerations are integrated seamlessly into the development lifecycle.
If you require a platform with in-built application security feature, New Relic is the clear choice. If you have an existing security solution you want to integrate with your monitoring platform, then choose Grafana.
Pricing: Grafana
Grafana being an open-source platform is free to use. Additionally, it offers both a cloud version and an enterprise version to cater to a wide range of user needs. The Grafana Cloud edition provides a free forever plan, and the enterprise version with a 14-day free trial.
New Relic’s pricing is based on two things: the amount of data ingested and user Seats. It also provides a free forever plan with 100GB of free data ingest each month. Post the 100GB, you need to pay $0.3/GB or $0.5/GB ingested based on your plan.
New Relic’s user seats can get expensive as it allows only 5 full platform users in its standard plan, and the cost of full platform users can be up to $549/user per month for enterprise plans.
Both tools offer a free and paid plan, but if you want a completely free self managed solution, choose Grafana open source version.
New Relic vs Grafana: Final Verdict
If you are wondering when to choose Grafana over New Relic or vice versa, we have provided a use-case-based guide to help you understand what each tool provides better than the other:
- If you want customizable dashboards and more visualization capabilities, choose Grafana.
- If you want application security without having to manage or integrate a different security tool, choose New Relic.
- If you want to deep insights into your log data, choose New Relic.
- If you want a cost effective log management solution, choose Grafana.
- If you want to use the entire platform without worrying too much about billing, then choose Grafana as it has an open source version and a free forever plan.
- If you want better APM capabilities, choose New Relic.
If you have more requirements that don’t fit into the use-case-based guide, you should consider a Grafana and New Relic alternative. A good Grafana and New Relic alternative platform you can consider using is SigNoz.
Advantages of using SigNoz over Grafana and New Relic
SigNoz is a full-stack open-source observability and monitoring platform that provides you with visibility into your application.
Here are a few reasons why you can consider SigNoz as an alternative to Grafana and New Relic:
- SigNoz is open-source: SigNoz is open-source, and unlike Grafana it has a single backend to manage logs , metrics, and traces. Grafana’s open-source version requires installation of the entire Grafana stack to be able to monitor your application and infrastructure. New Relic doesn’t have an open source version. SigNoz also has a cloud based version with free usage at start.
- All in one platform: SigNoz being full stack provides visibility into your logs, metrics and traces in a single pane of glass. There is no need for any other “stack” or integration with other tools for monitoring your application and infrastructure data.
- Built on OpenTelemetry: SigNoz is an OpenTelemetry native tool. OpenTelemetry is the emerging standard for collecting and managing telemetry data. Being built with OpenTelemetry from scratch, SigNoz frees you from vendor lock-in, allowing you to use any backend of your choice.
- Flexible log management: SigNoz’s log management solution provides a lot of flexibility. You can transform data with our logs pipeline, you get out of the box UI for log management, an advanced logs query builder, correlation of logs with other telemetry signals for troubleshooting and more.
Related comparisons: Kibana vs Grafana and Grafana vs Splunk. For more matchups, see Prometheus vs Grafana, OpenTelemetry vs Grafana, and Dynatrace vs New Relic.
Getting Started with SigNoz
SigNoz Cloud is the easiest way to run SigNoz. Sign up for a free account and get 30 days of unlimited access to all features.

You can also install and self-host SigNoz yourself since it is open-source. With 24,000+ GitHub stars, open-source SigNoz is loved by developers. Find the instructions to self-host SigNoz.
Further Reading:
