New Relic vs Sentry - In-depth Comparison Guide [2026]
New Relic and Sentry are monitoring tools but with different use cases. New Relic is tailored towards application performance and full stack observability of systems while Sentry specializes in identifying and reporting application errors.
In this post, I have compared New Relic and Sentry on important features like APM, error monitoring, pricing, etc.
New Relic vs Sentry: At a glance
New Relic is a comprehensive observability platform that provides monitoring and analytics solutions for modern software environments.
Sentry, on the other hand, is an application and error monitoring platform that provides developers with real-time notifications of errors, detailed error reports, and the ability to track and manage errors as they occur.
It helps to know where each tool started. Sentry began as developer-first error tracking and has since expanded into performance/APM, logs, session replay, and cron monitoring, while New Relic was built as a broad full-stack observability platform. Their feature sets now overlap in the middle, so for most teams this is a real either/or decision: which one becomes your primary platform, even if you keep the other for a narrower job.
Here’s a quick overview of the overall platform features and functionality of New Relic and Sentry.
| Features | New Relic | Sentry |
|---|---|---|
| APM | ✅ | ✅ |
| Infrastructure Monitoring | ✅ | ❌ |
| Session Replay | ✅ | ✅ |
| Profiling | ❌ | ✅ |
| Open-Source version | ❌ | ✅ |
| Application Security | ✅ | ❌ |
| Log management | ✅ | 🟡 |
| Alerting | ✅ | ✅ |
| OpenTelemetry Support | 🟡 | 🟡 |
| Error Monitoring | ✅ | ✅ |
| Incident Management | ✅ | ❌ |
| Cloud SIEM | ❌ | ❌ |
| Real User Monitoring | ✅ | ❌ |
| Cron Monitoring | 🟡 | ✅ |
| Free trial | ✅ (Free forever) | 🟡 (14-days) |
✅ - Available
❌ - Not Available
🟡 - Limited
Error Monitoring: Sentry for detailed insights into application errors
New Relic
New Relic provides an “Errors Inbox” feature that detects and triages errors within applications. It provides a centralized platform for viewing, managing, and collaborating on errors, reducing the noise from irrelevant alerts and allowing developers to focus on critical issues.
I was able to view errors from my application directly in the Errors Inbox UI. This came out of the box and did not require any additional configuration besides my APM and infrastructure monitoring setup.
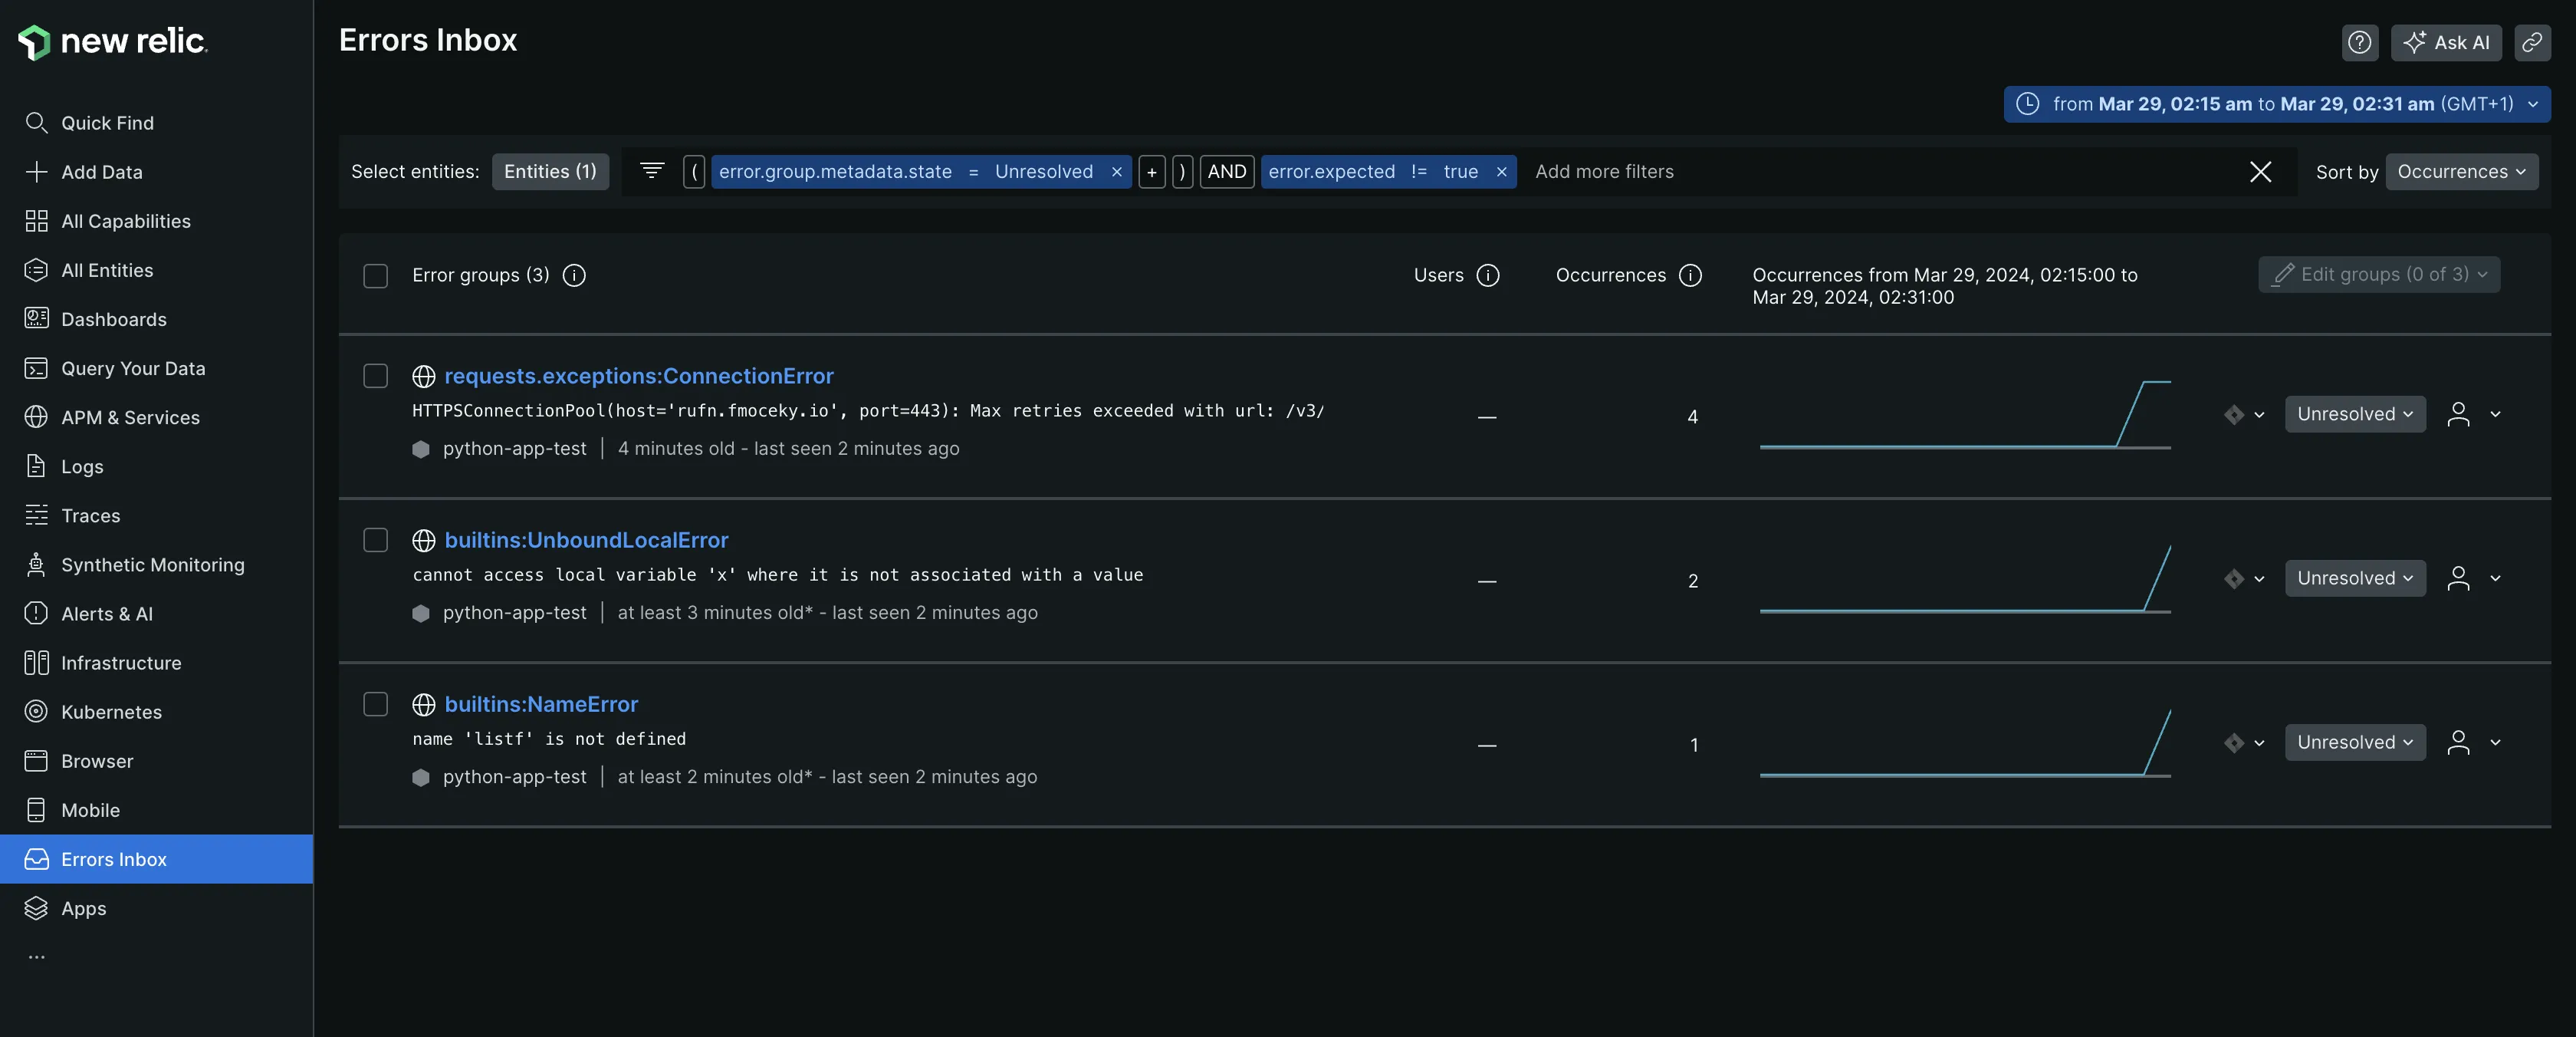
The Errors Inbox is closely integrated with New Relic’s APM. It leverages data from APM to pinpoint errors specific to individual applications. In the Triage tab, errors are categorized based on the count, error rate, and groups, and under the Group errors tab, you can filter different attributes and group errors to help narrow down what you are looking for.
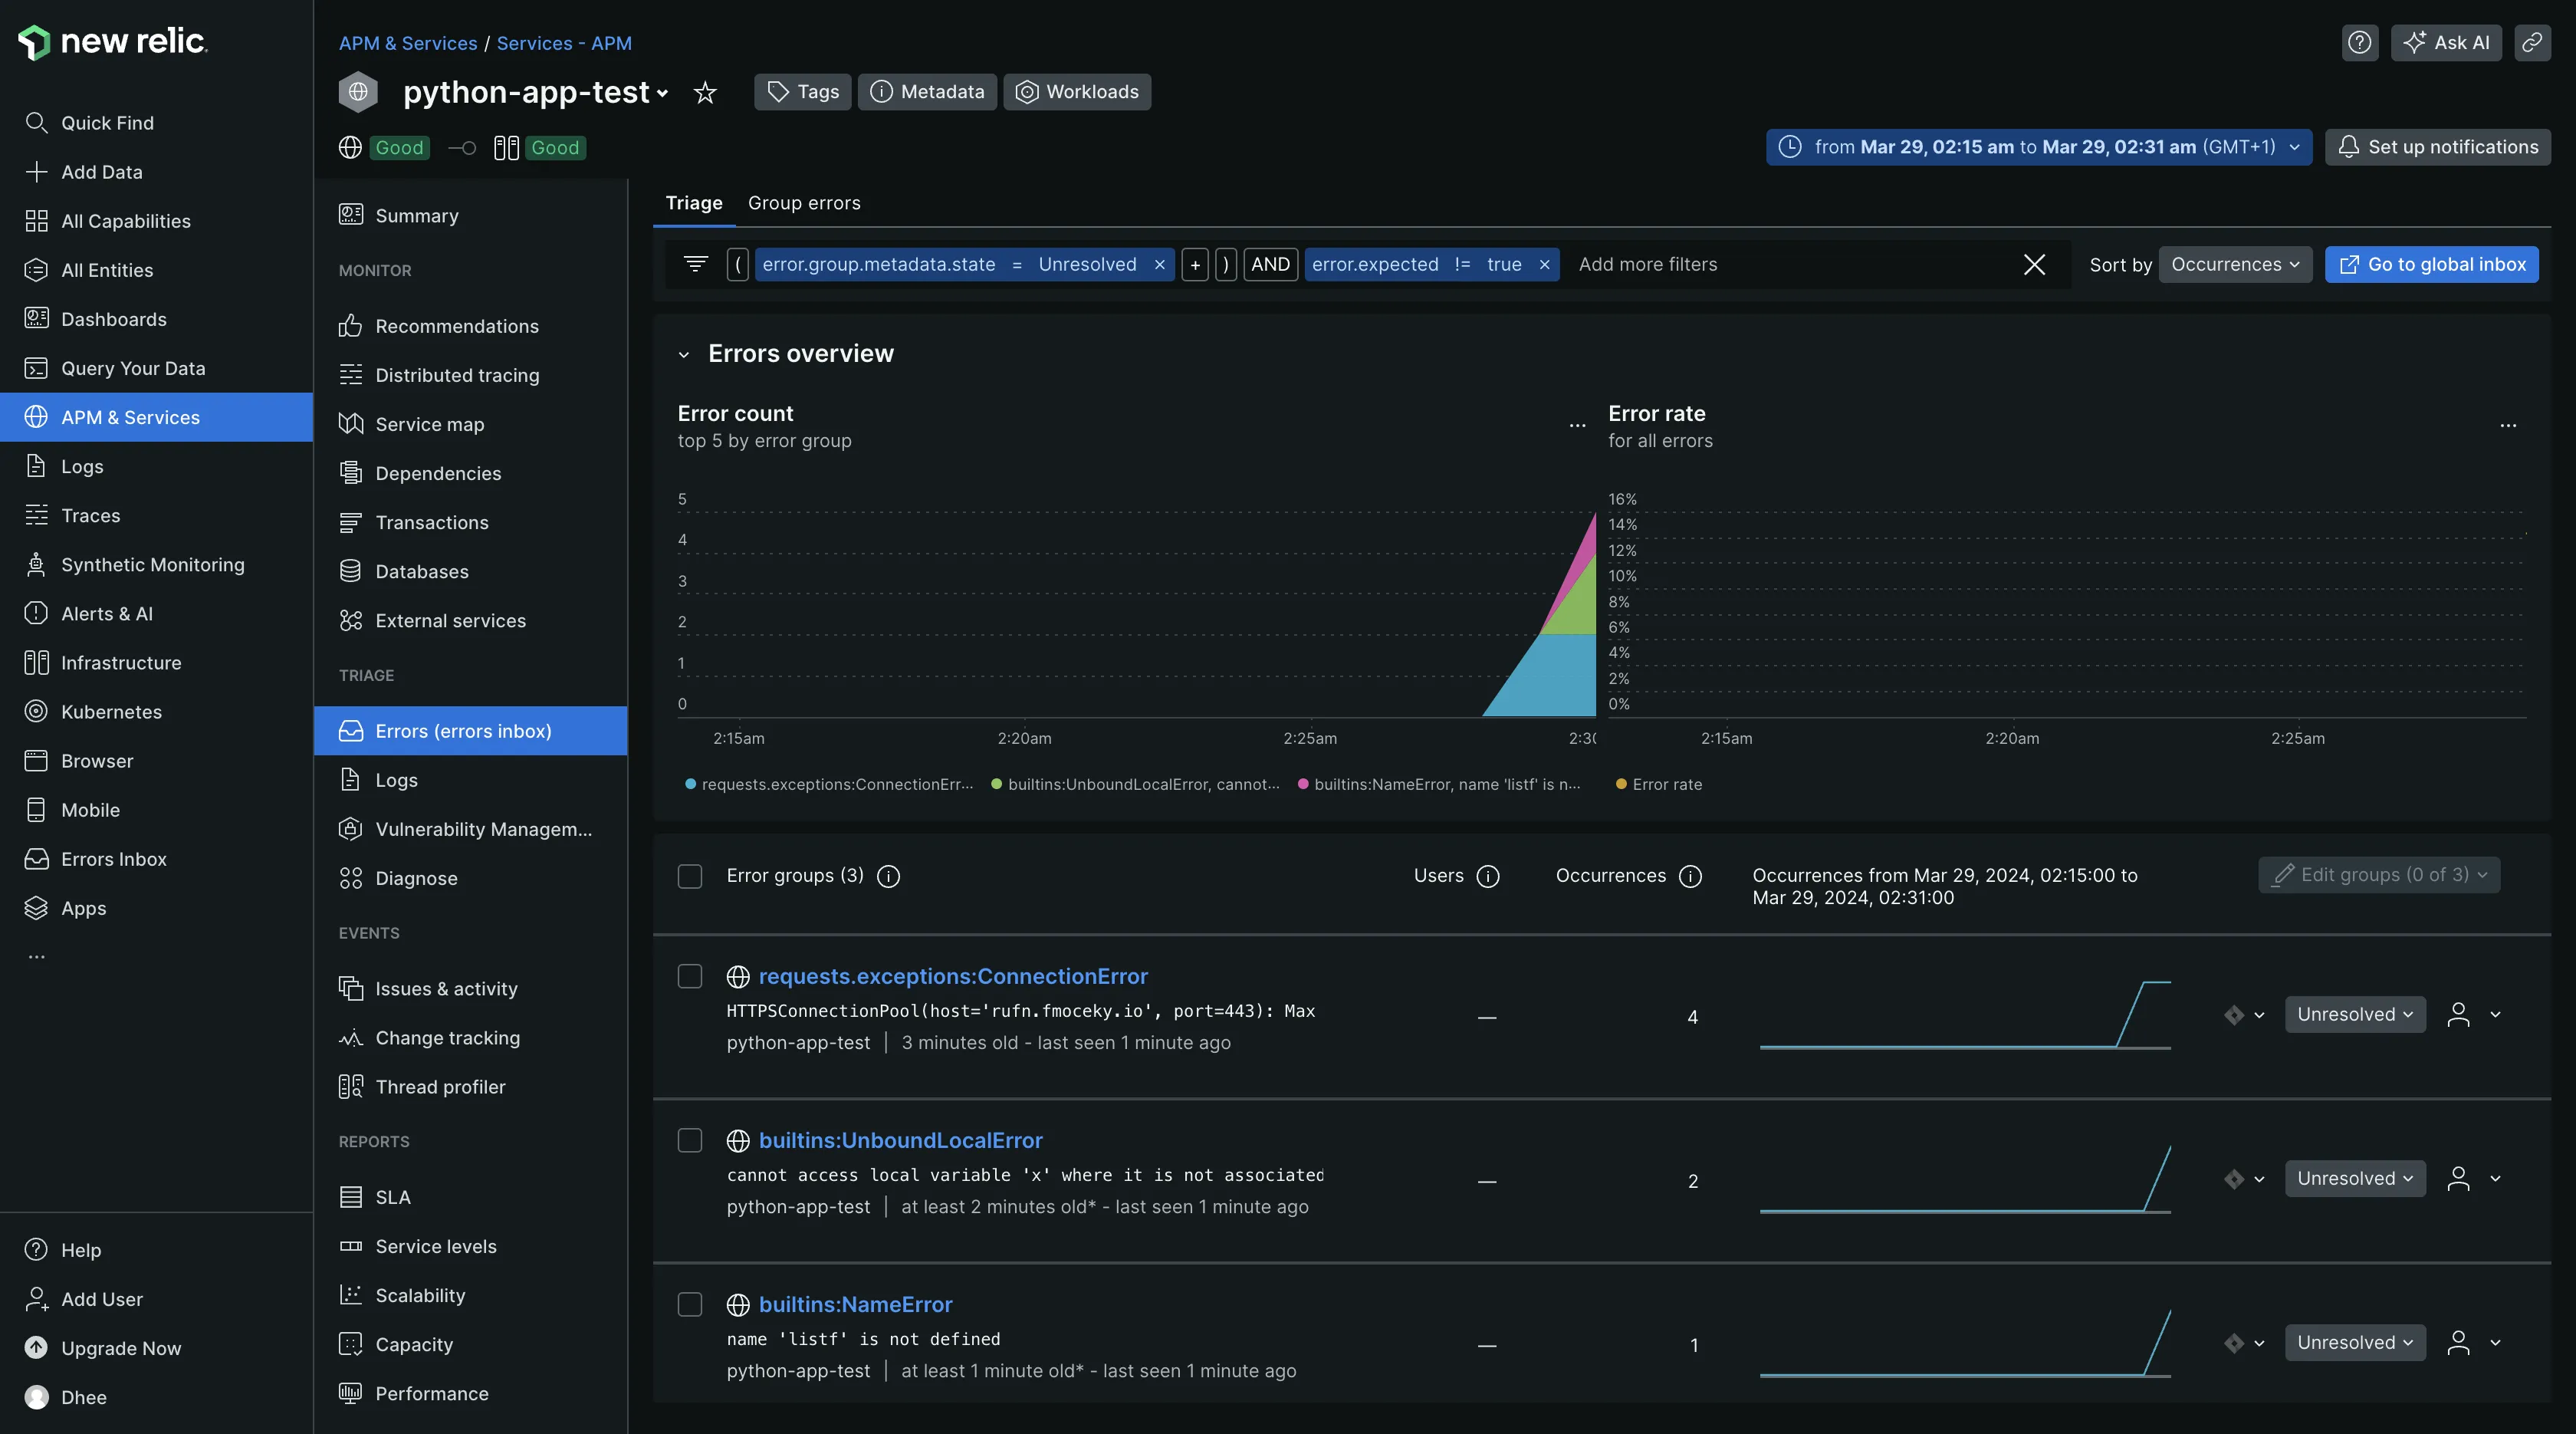
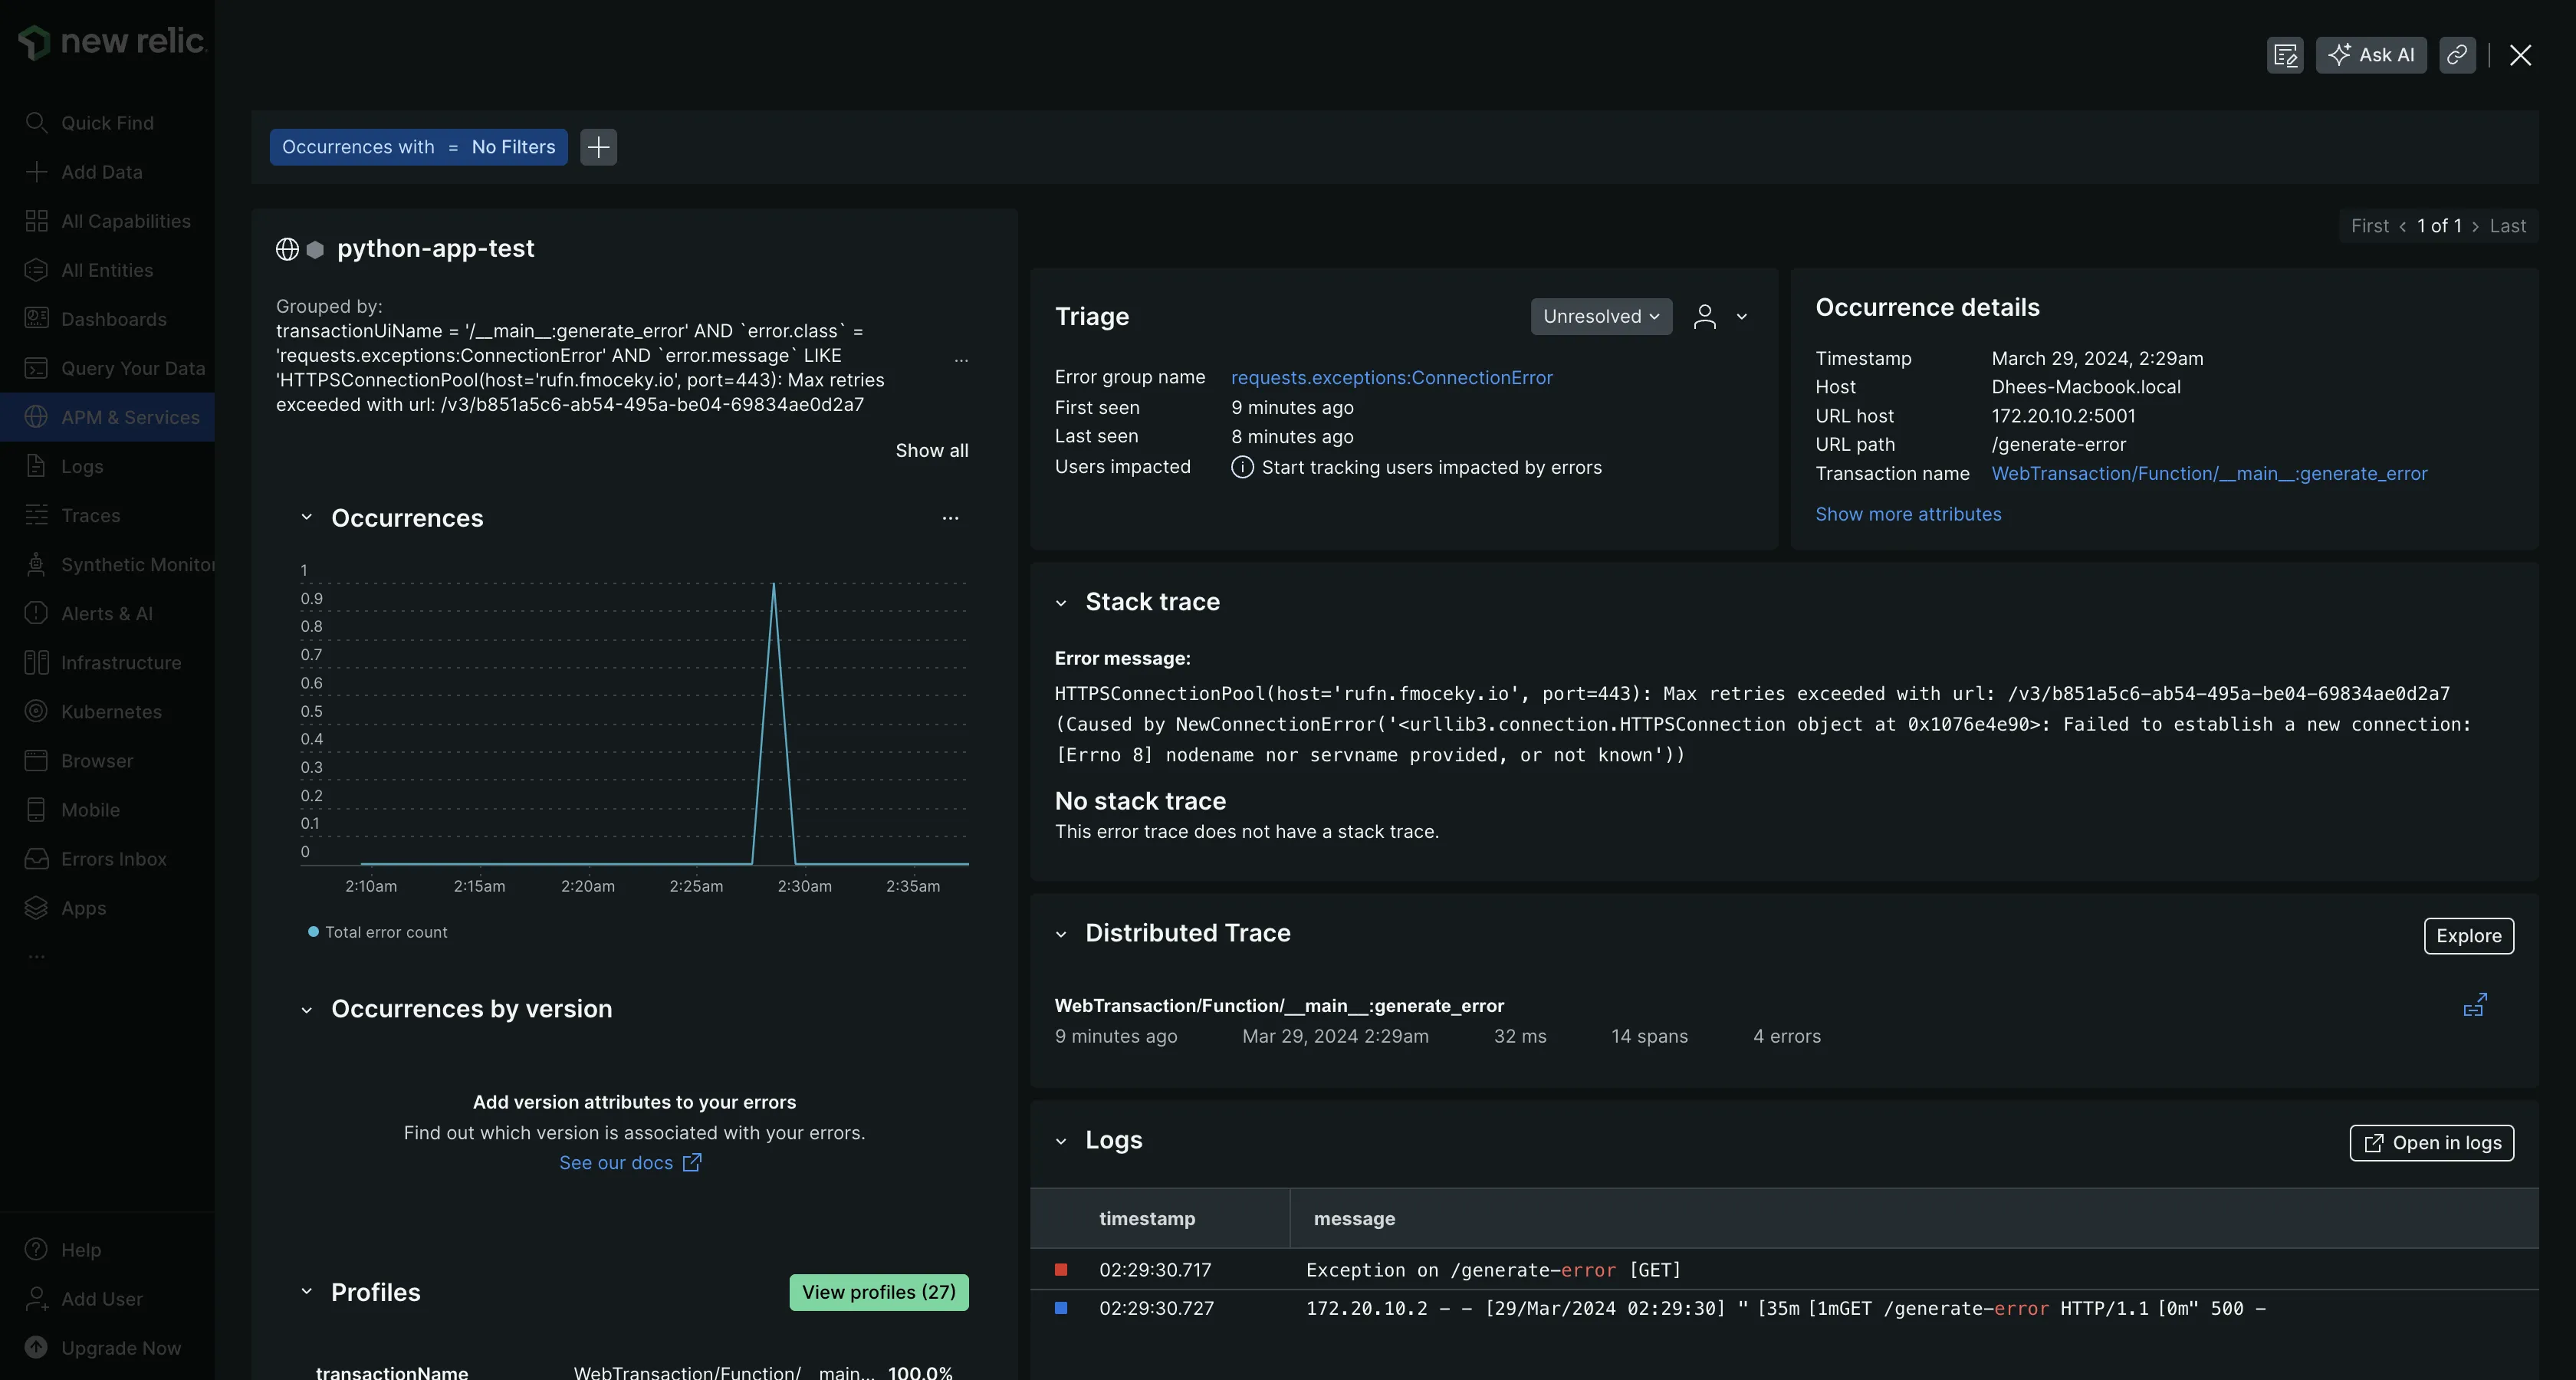
The Error Groups provide comprehensive insights into error details such as timestamp, host, users impacted, associated URL, logs, error messages, and more. I found the details to be incredibly useful and helpful in troubleshooting my application.
Sentry
Error monitoring in Sentry requires integrating Sentry with your application. This involves installing the SDK for that application and configuring Sentry’s SDK as well. It was a straightforward and seamless process for me. This allows Sentry to automatically capture errors and exceptions that occur within my application. These errors are displayed in the Issues UI in real-time.
The Issues UI provides information on error types, their frequency, and the environments in which they occur. It allows for filtering and searching based on various criteria such as error level, release version, and timestamp.
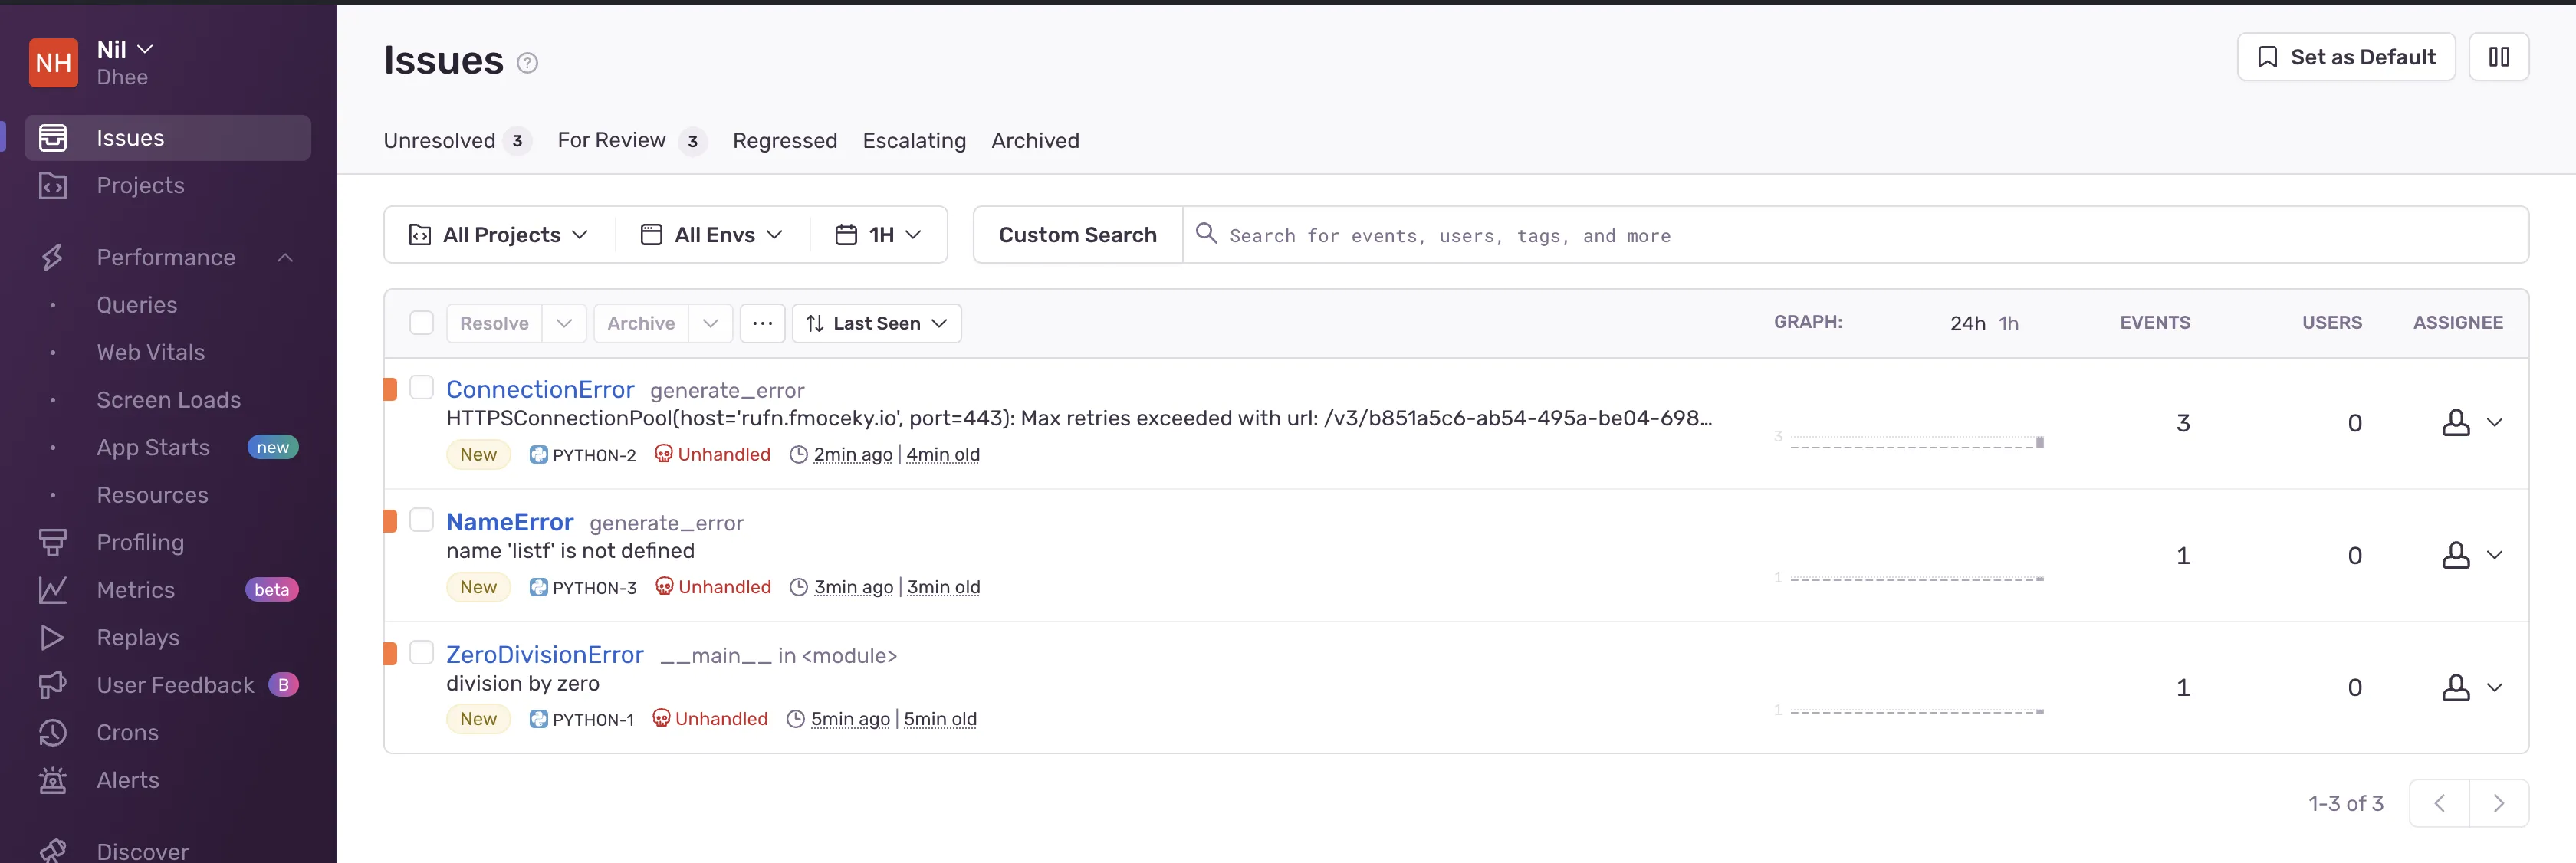
Inspecting these issues provided me with more information about the source it generated from, the error message, as well as the impact it has on my users.
Additionally, you can correlate these issues with the relevant traces to gain a deeper understanding of the underlying causes and potential performance bottlenecks.
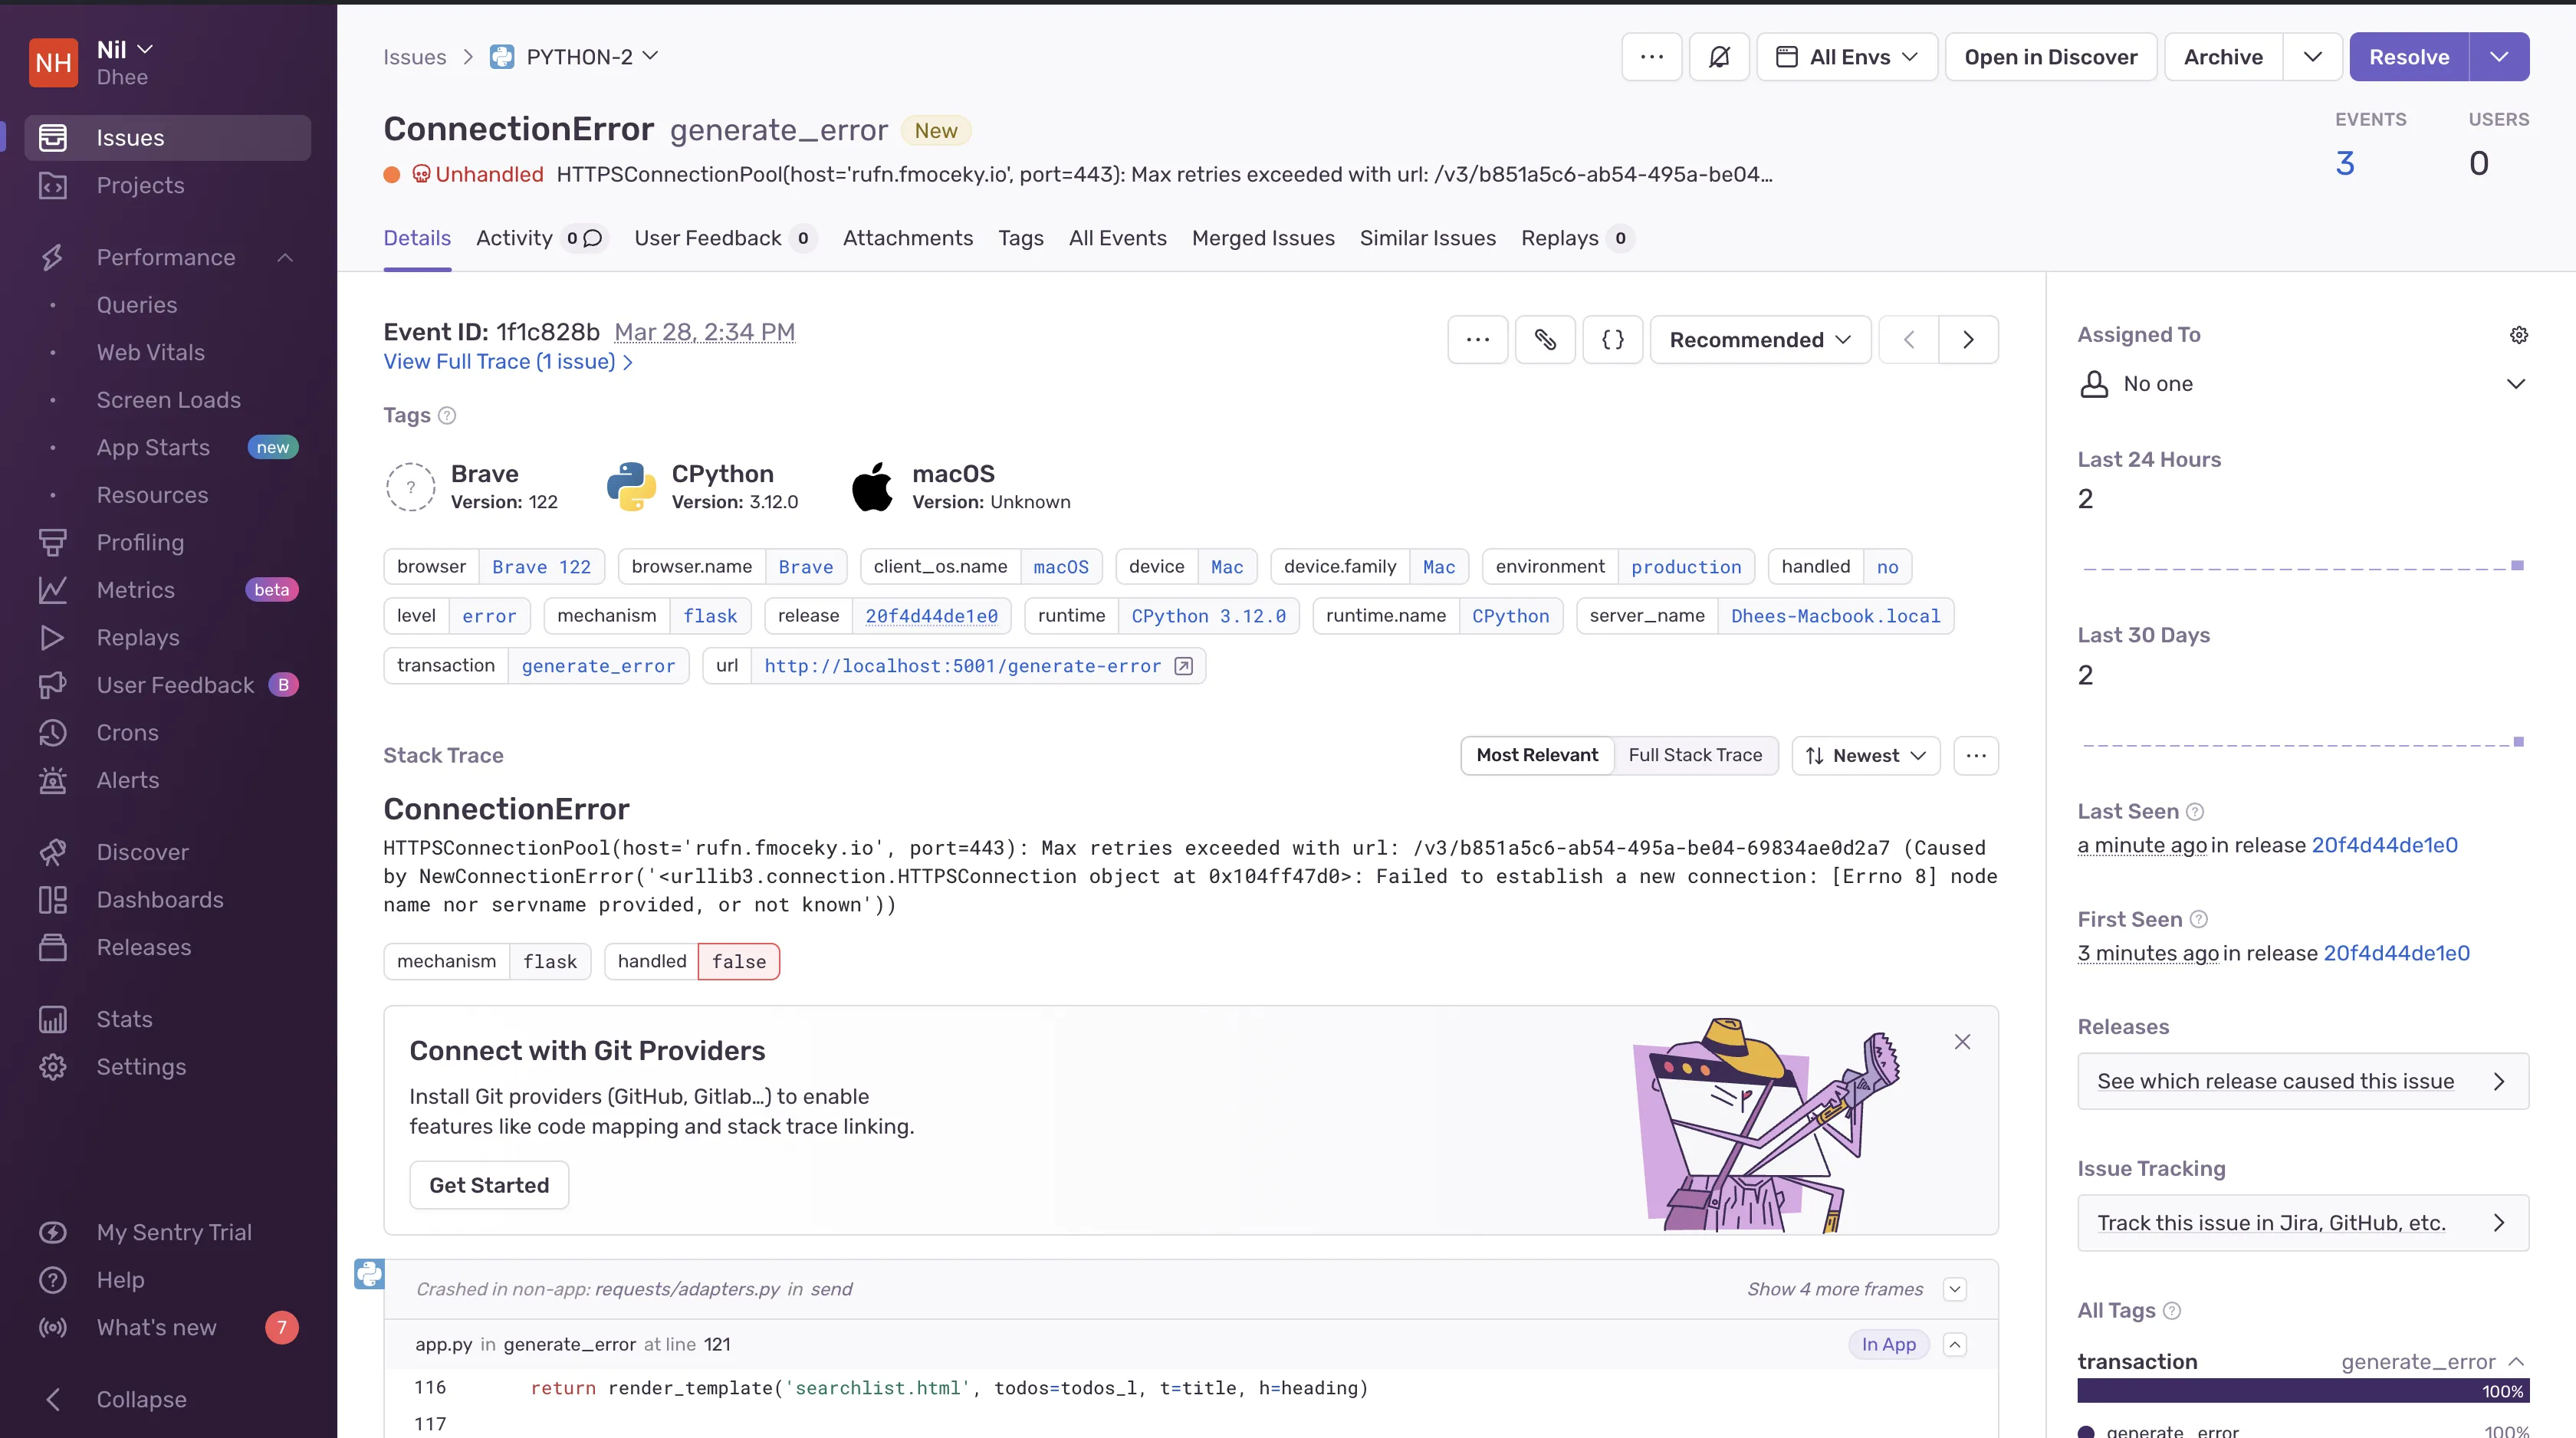
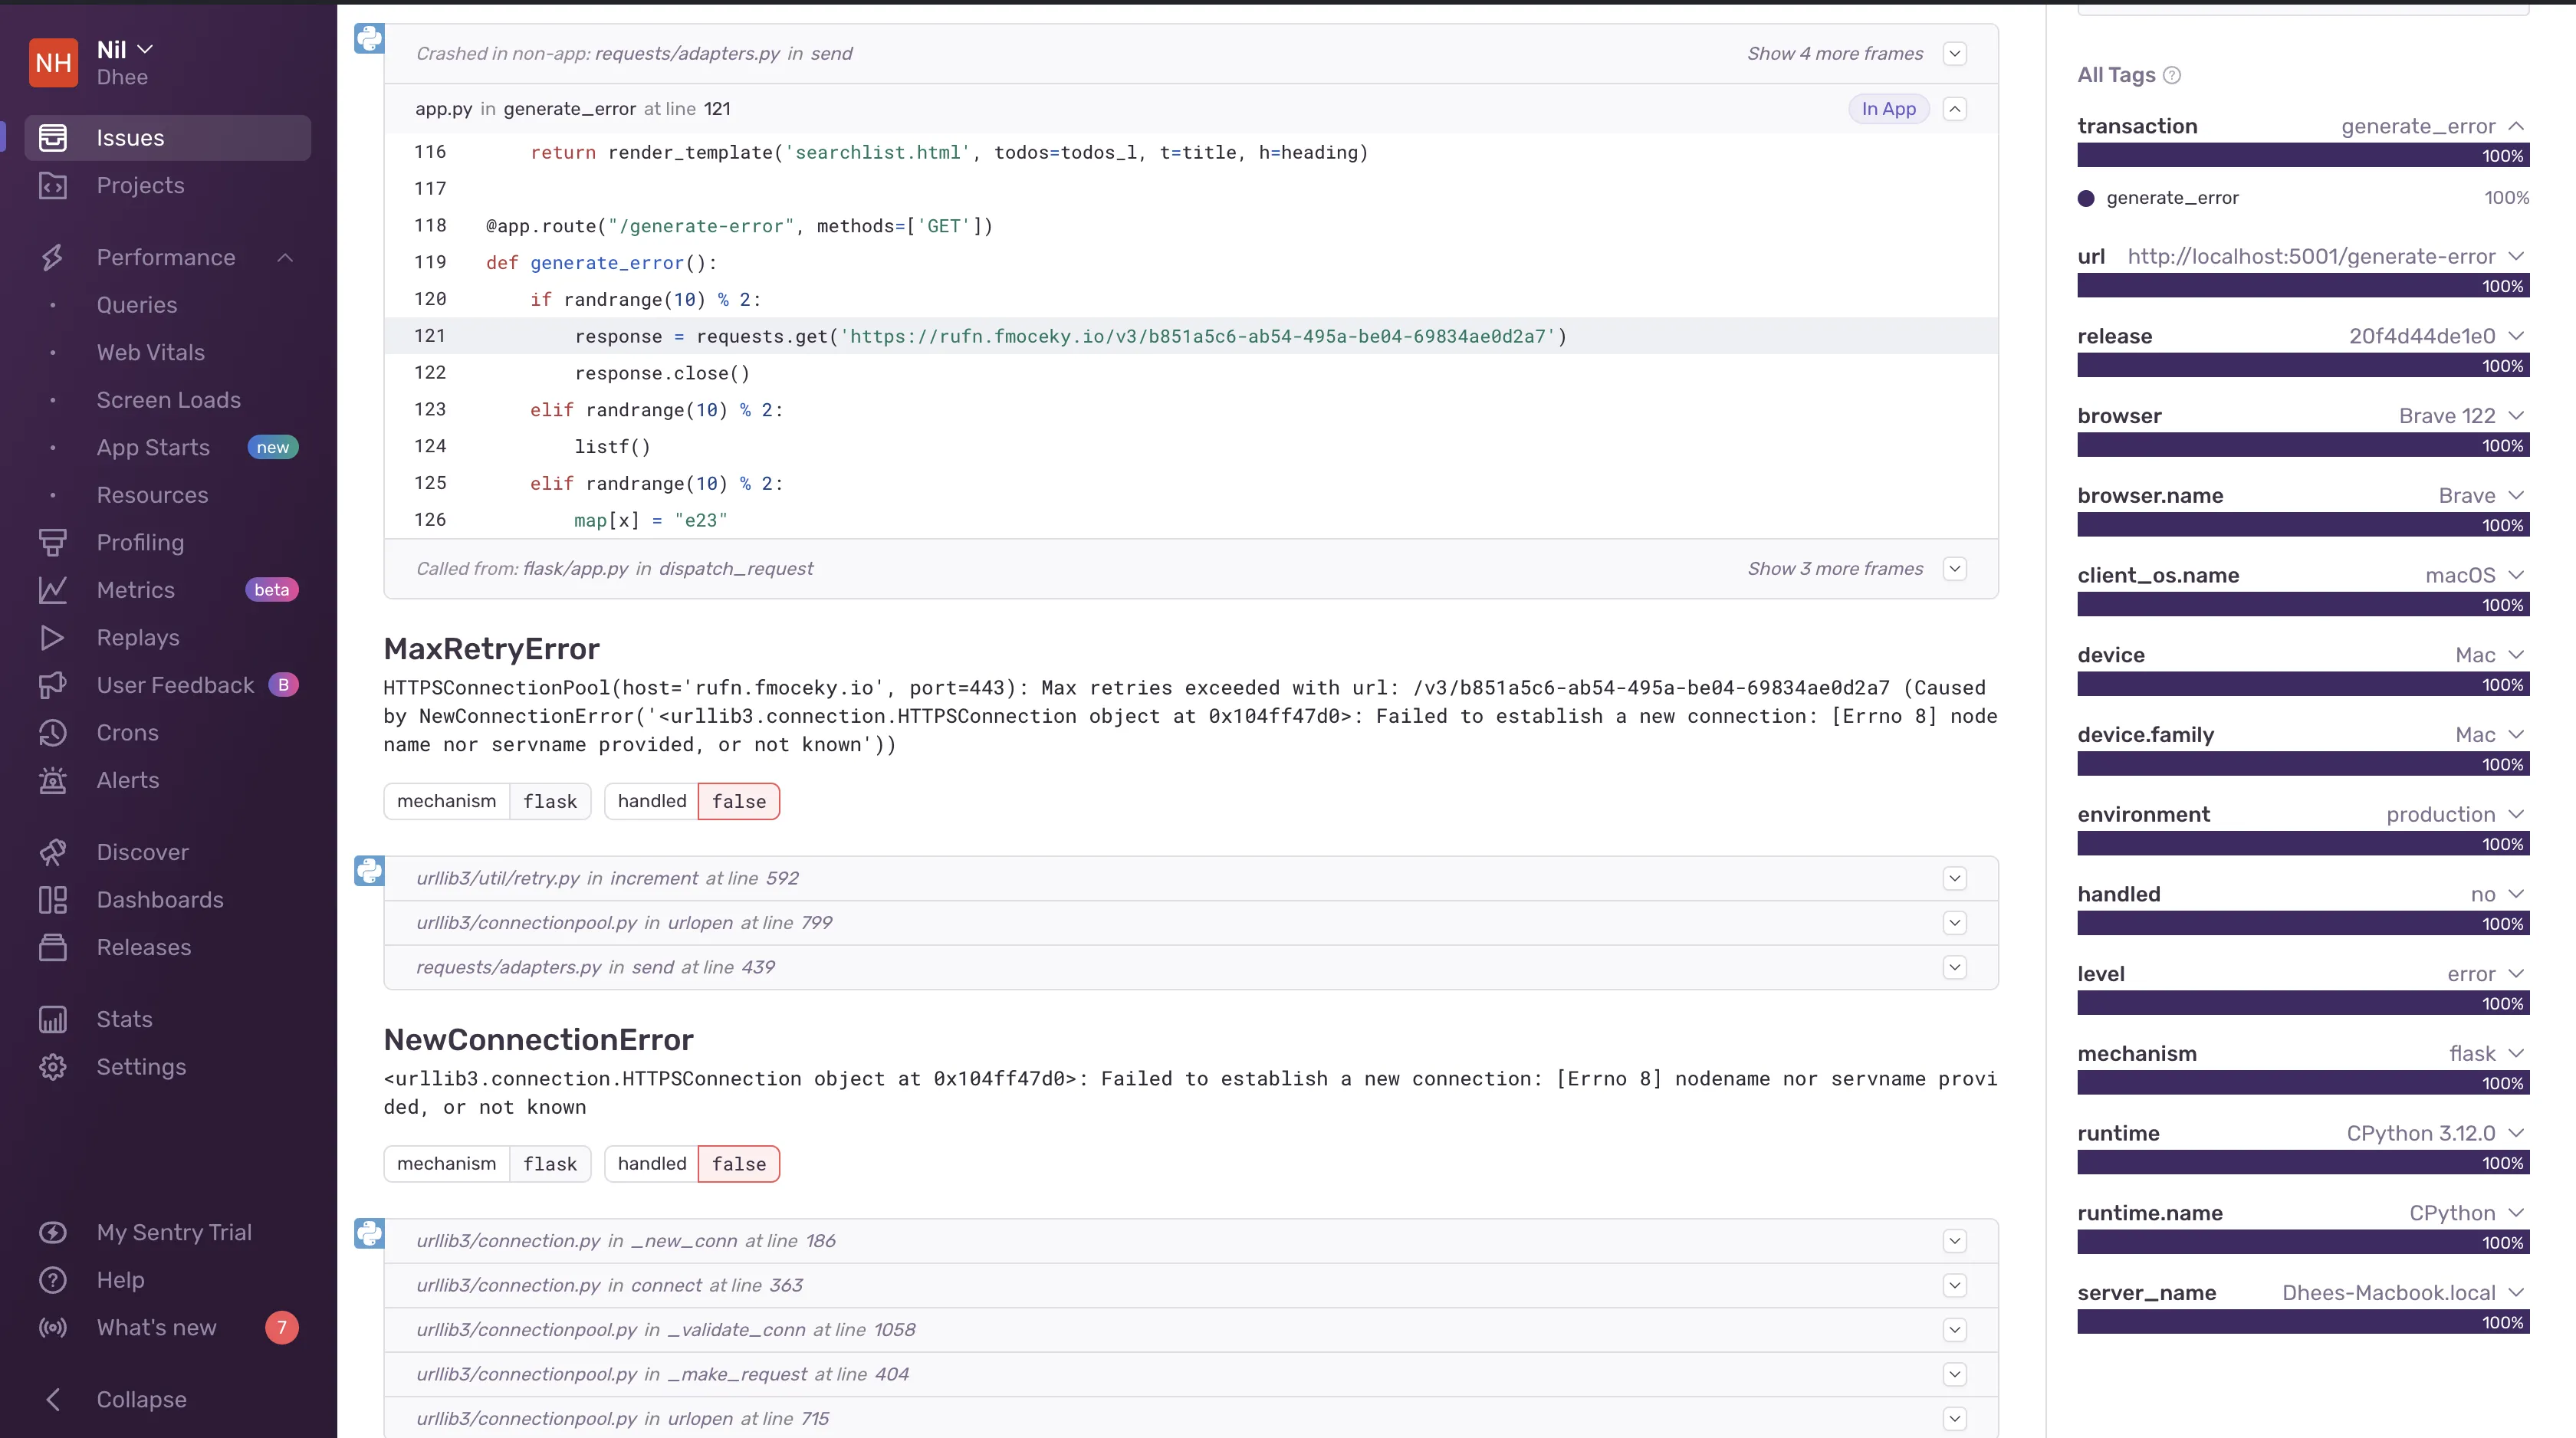
It also offers code-level observability by pinpointing the exact location of the issue within your code. Sentry fetches the code context, providing not only the line that is causing the error but also the surrounding lines of code for better context and understanding.
Both tools have really good error monitoring capabilities but I found that Sentry provides more granular and detailed error information compared to New Relic.
Migrate from New Relic - Save up to 67% on your New Relic bill
Tired of New Relic's user-based pricing? Even for teams of 10-15 devs, New Relic's pricing for user seats can be a significant portion of your monthly bill.
APM: New Relic for deep APM visibility
New Relic
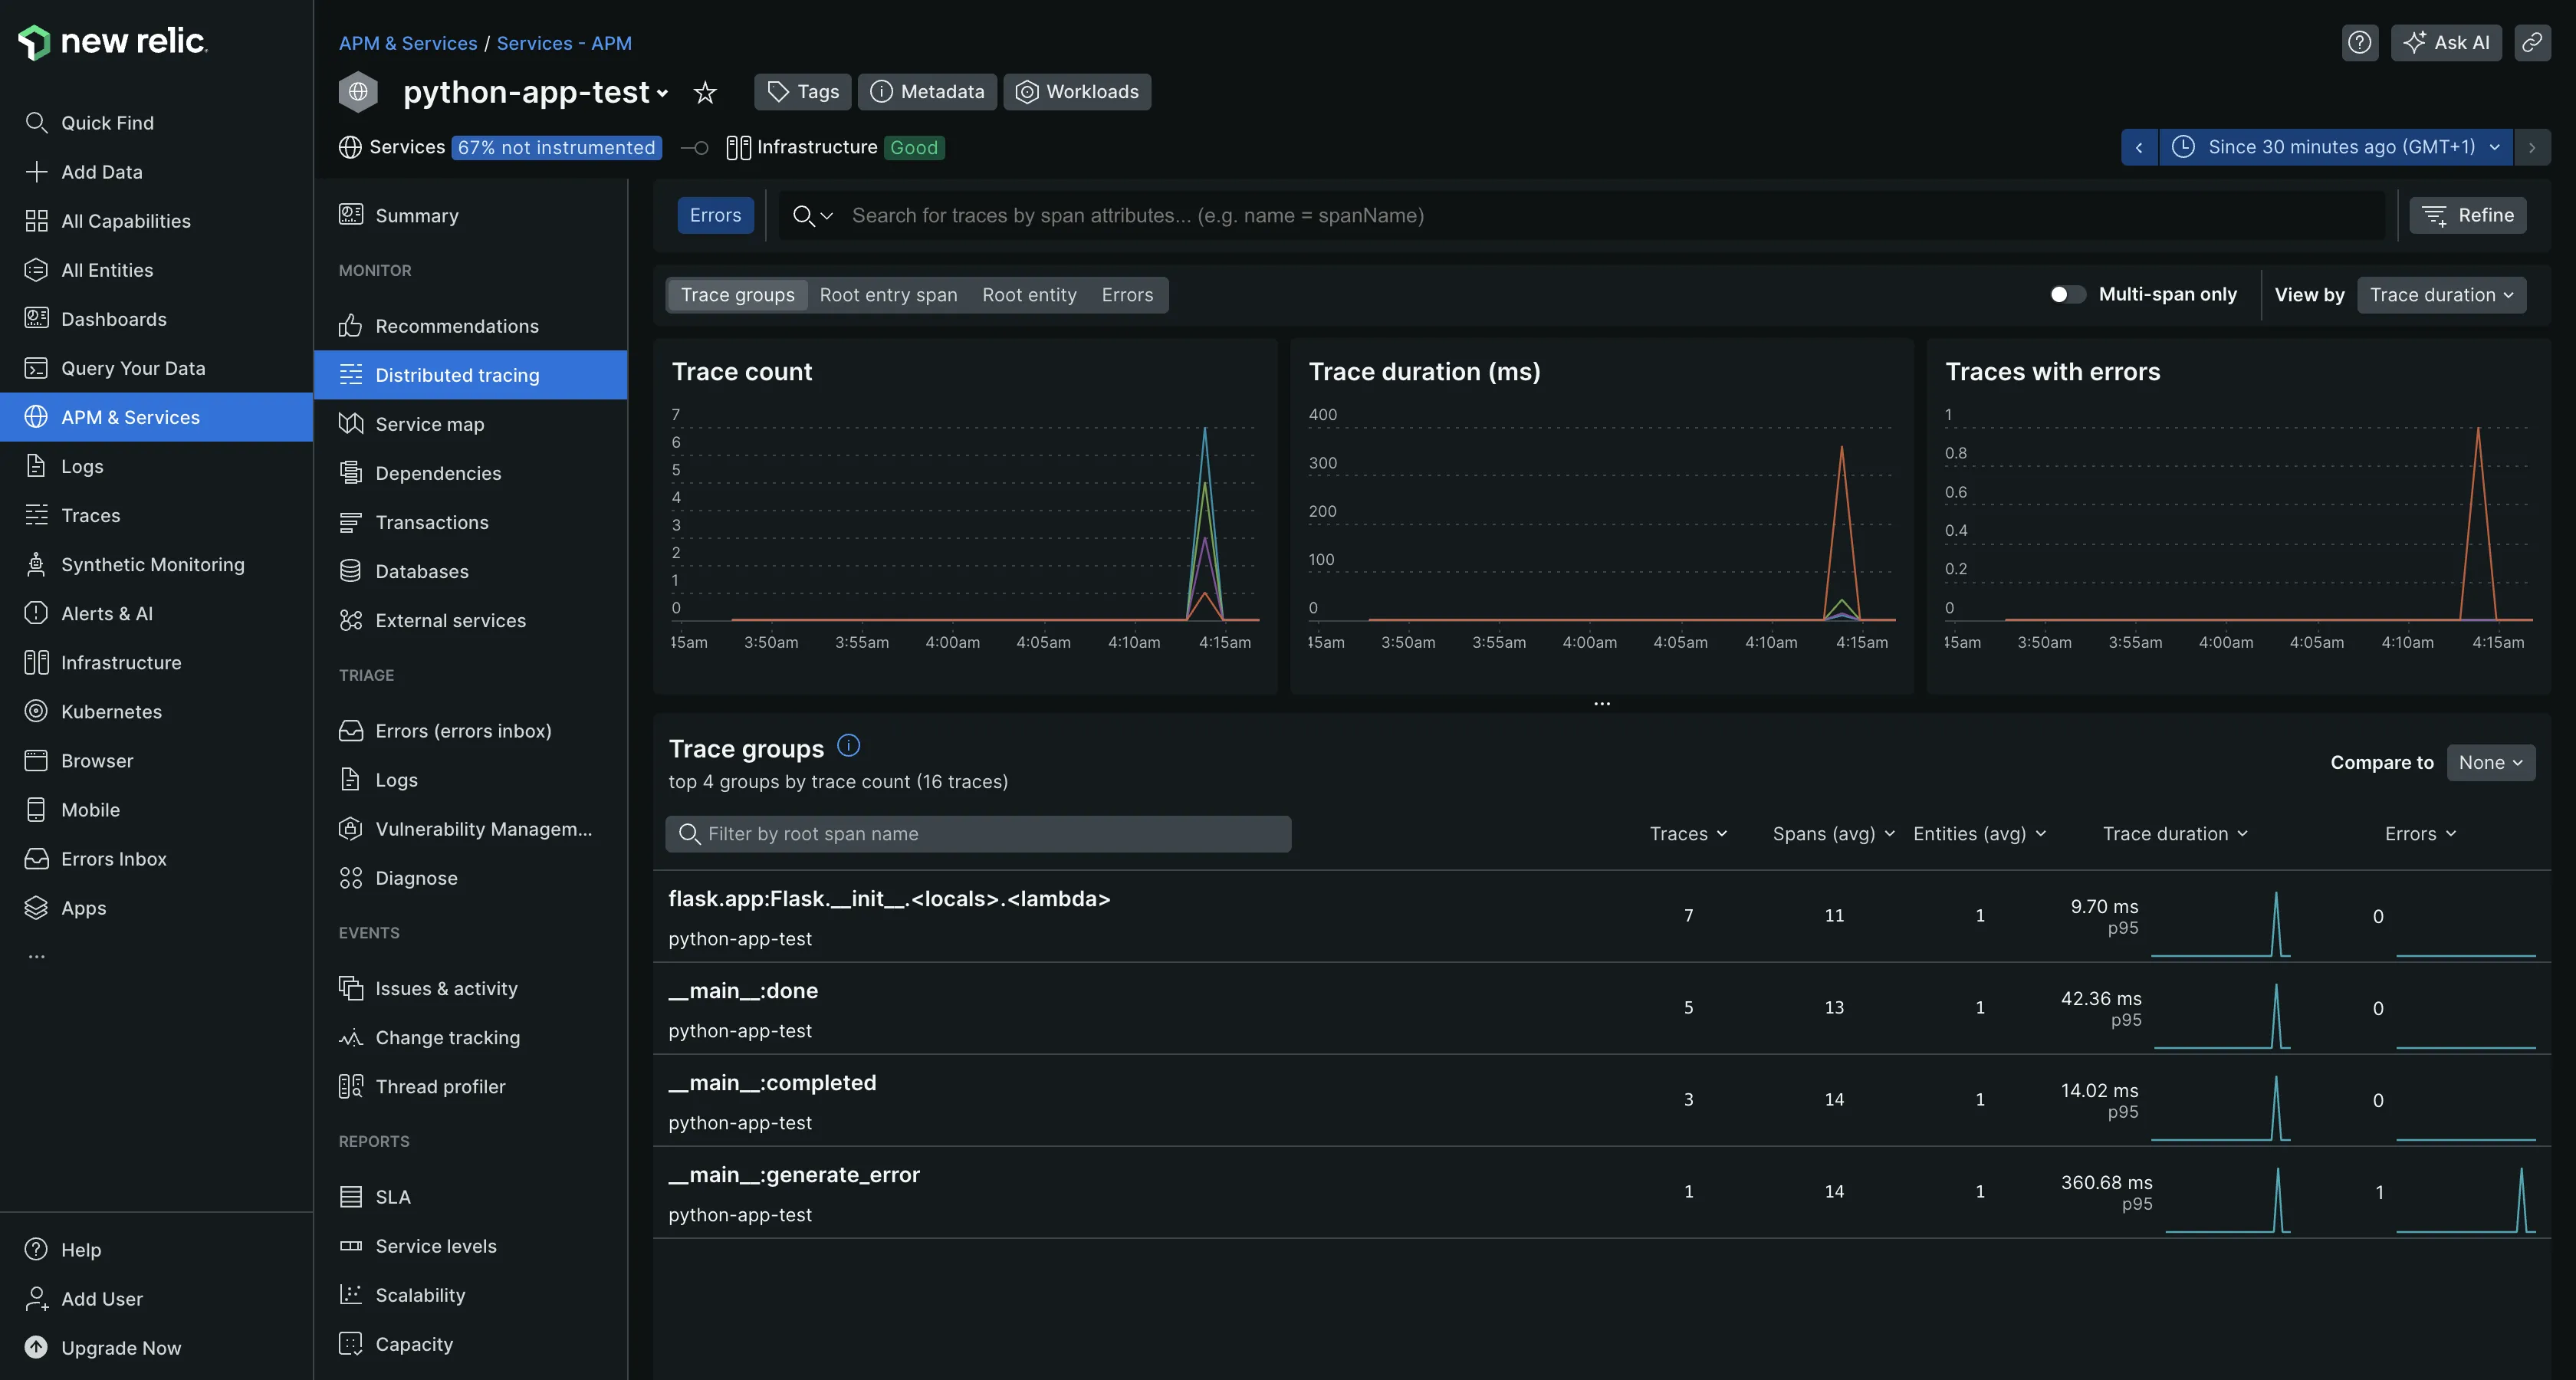
New Relic’s APM feature provides a unified monitoring service for all your applications and microservices. It provides deep visibility into various aspects of application performance, including response times, throughput, tracing, errors, and dependencies.
Setting up APM involves installing the appropriate agent for your application. In my case, I installed the Python agent. Once the agent is integrated into your application and it's up and running, New Relic seamlessly collects performance data from your application for monitoring.
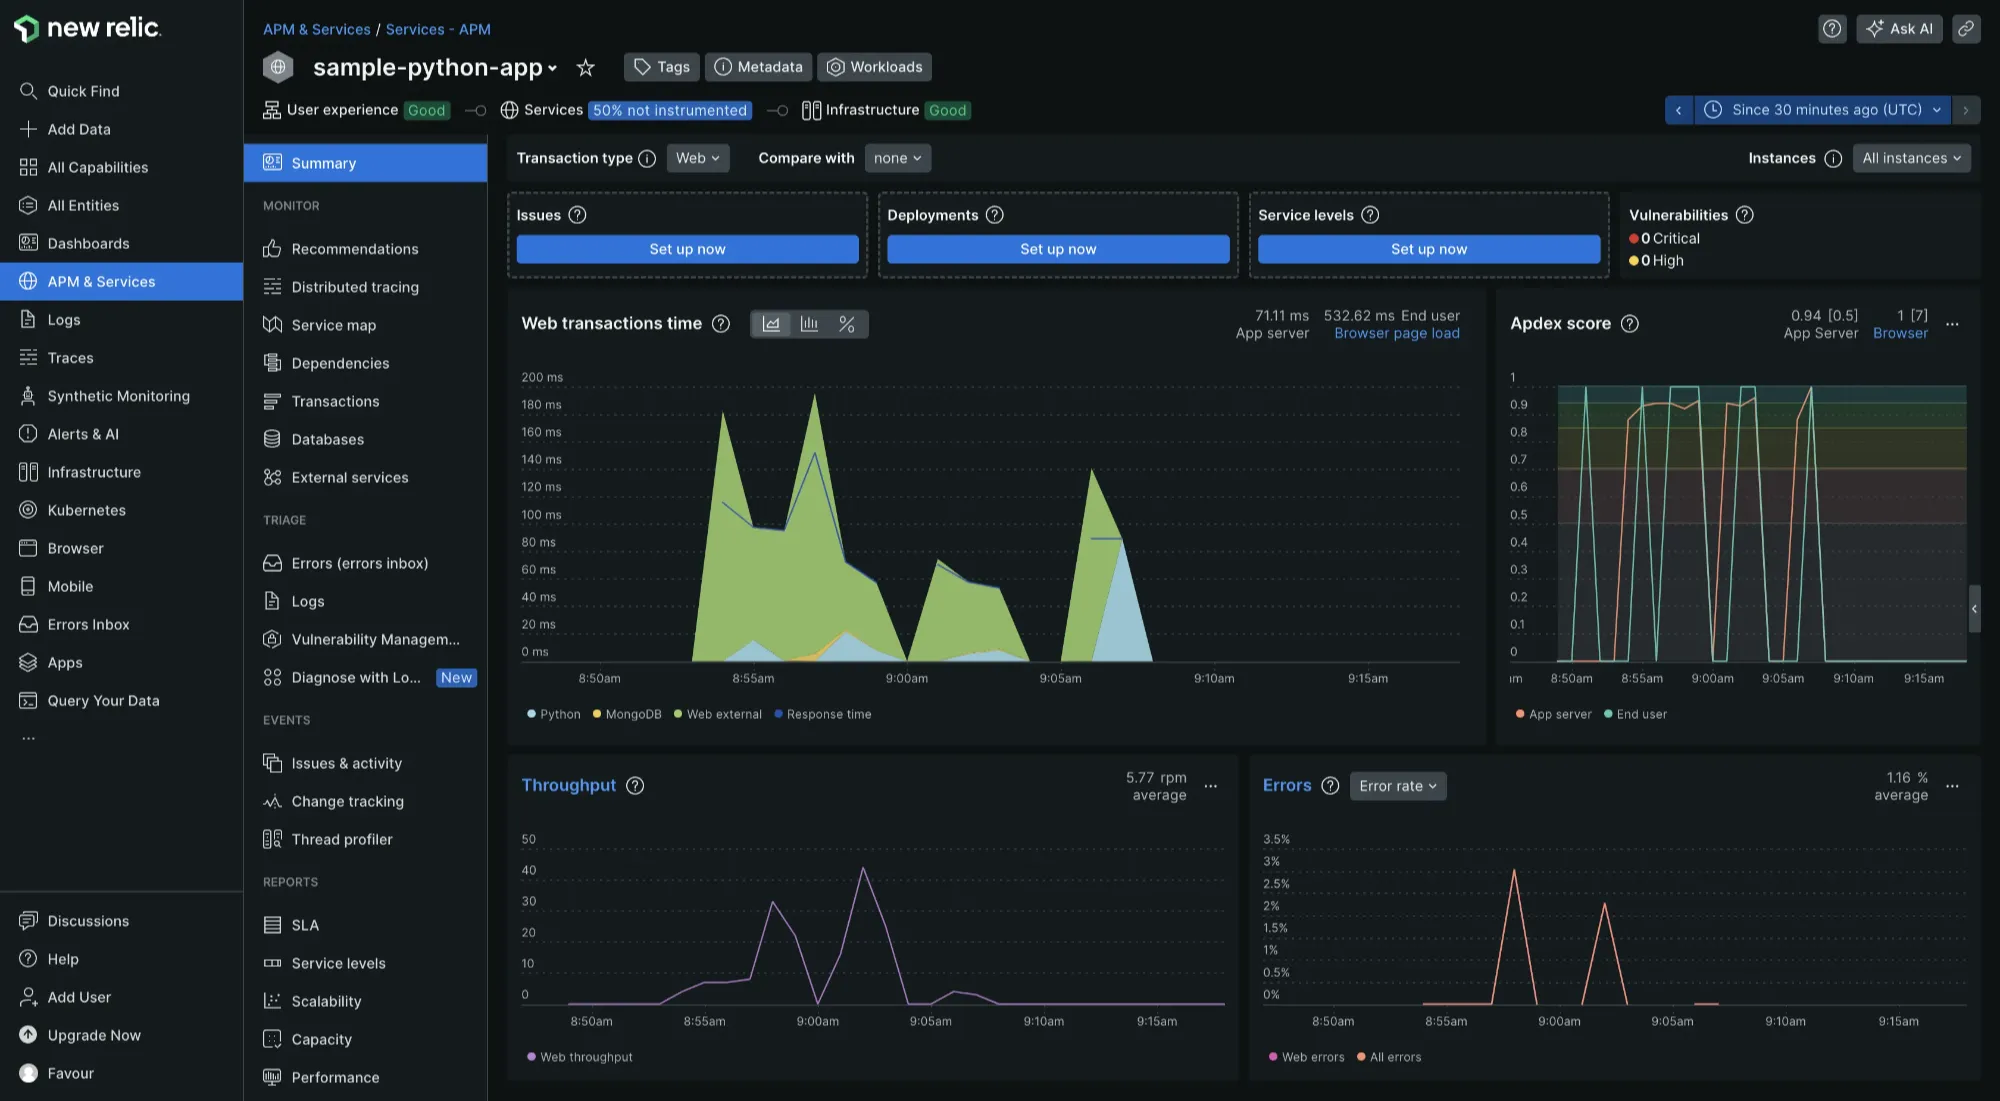
New Relic's APM is equipped with pre-configured dashboards and visualizations that helped me quickly understand my application performance without any customization. It also includes features like service maps, issues & activities tracking, service levels monitoring, SLA reports, vulnerability management, and more. These advanced capabilities provide a comprehensive view of the application environment, enabling users to optimize performance and ensure reliability effectively.
Sentry APM
Sentry tracks application performance by measuring metrics like throughput and latency within applications. The Performance UI provided an overview of the metrics and transactions it was tracking against my application. Because I configured my application for performance monitoring when integrating Sentry with my application, Sentry was able to detect common performance problems my application had and grouped them into issues for better management and resolution.
The “View Trends” page also helped me assess if my application's performance was improving or deteriorating over time and identify potential bottlenecks or issues that may be affecting user experience.
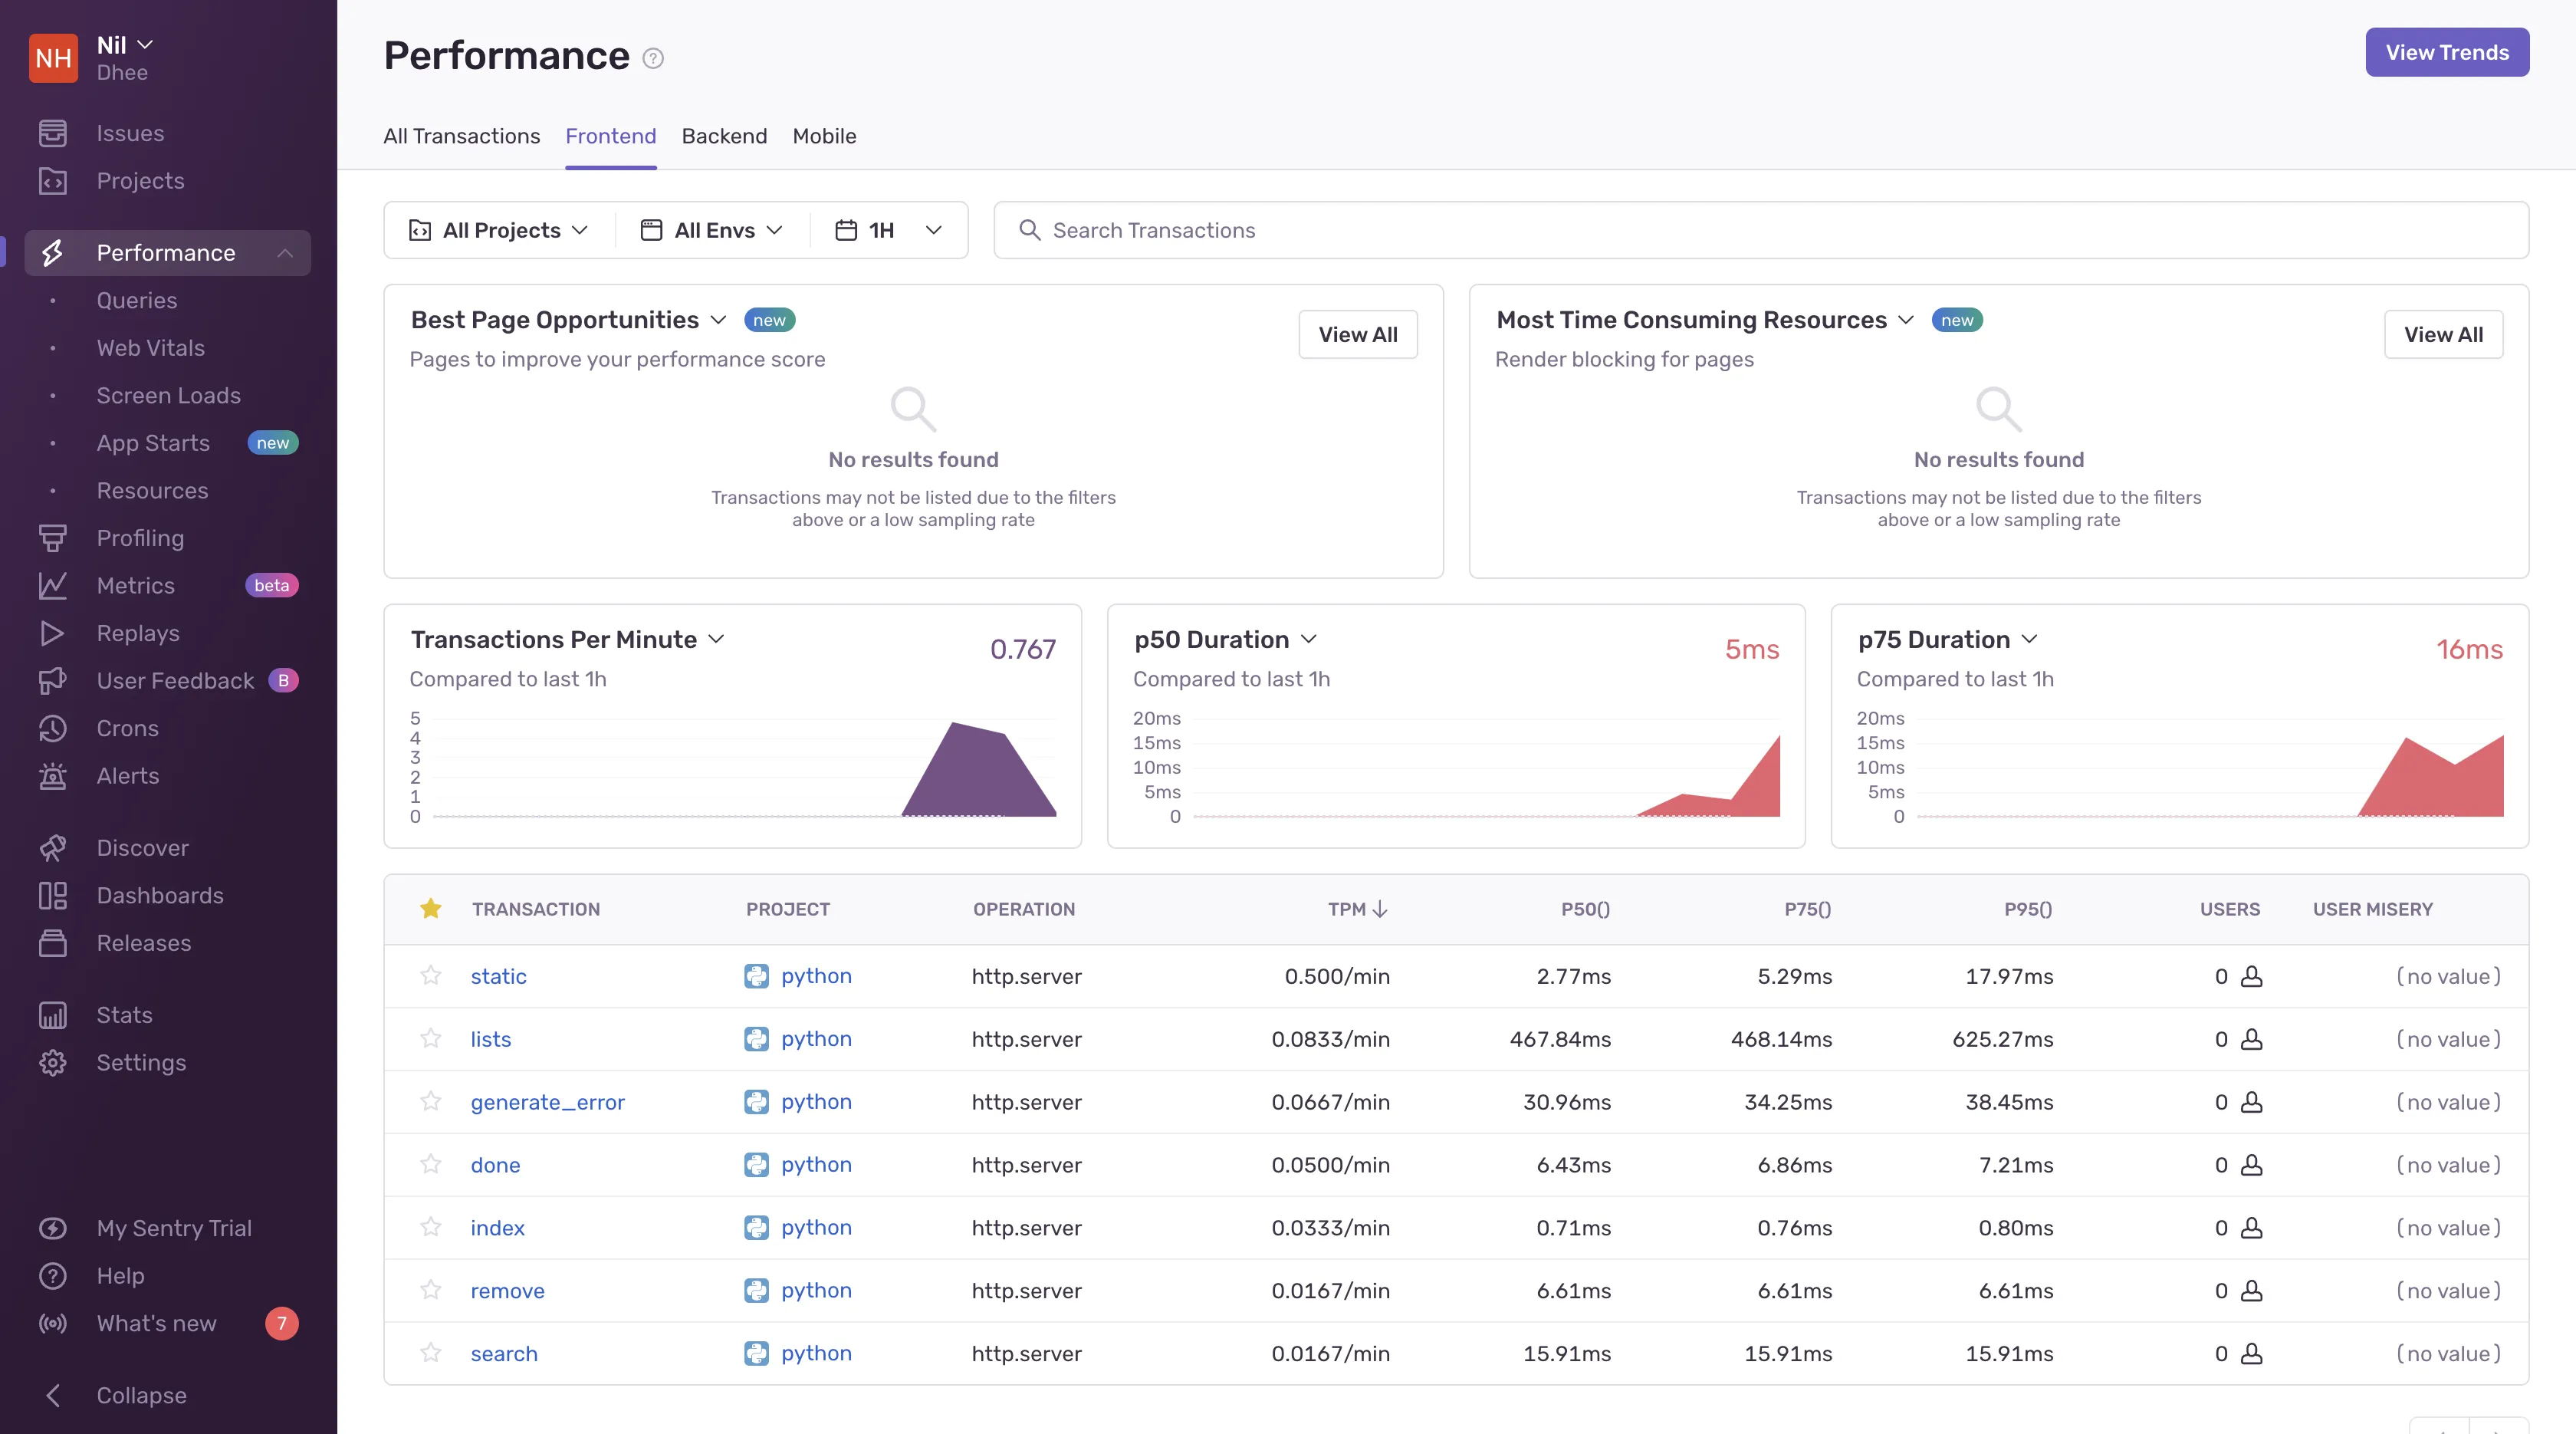
Sentry's APM capabilities are less extensive compared to New Relic, which offers comprehensive insights into application performance.
Log Management: New Relic for enhanced log management capabilities
New Relic
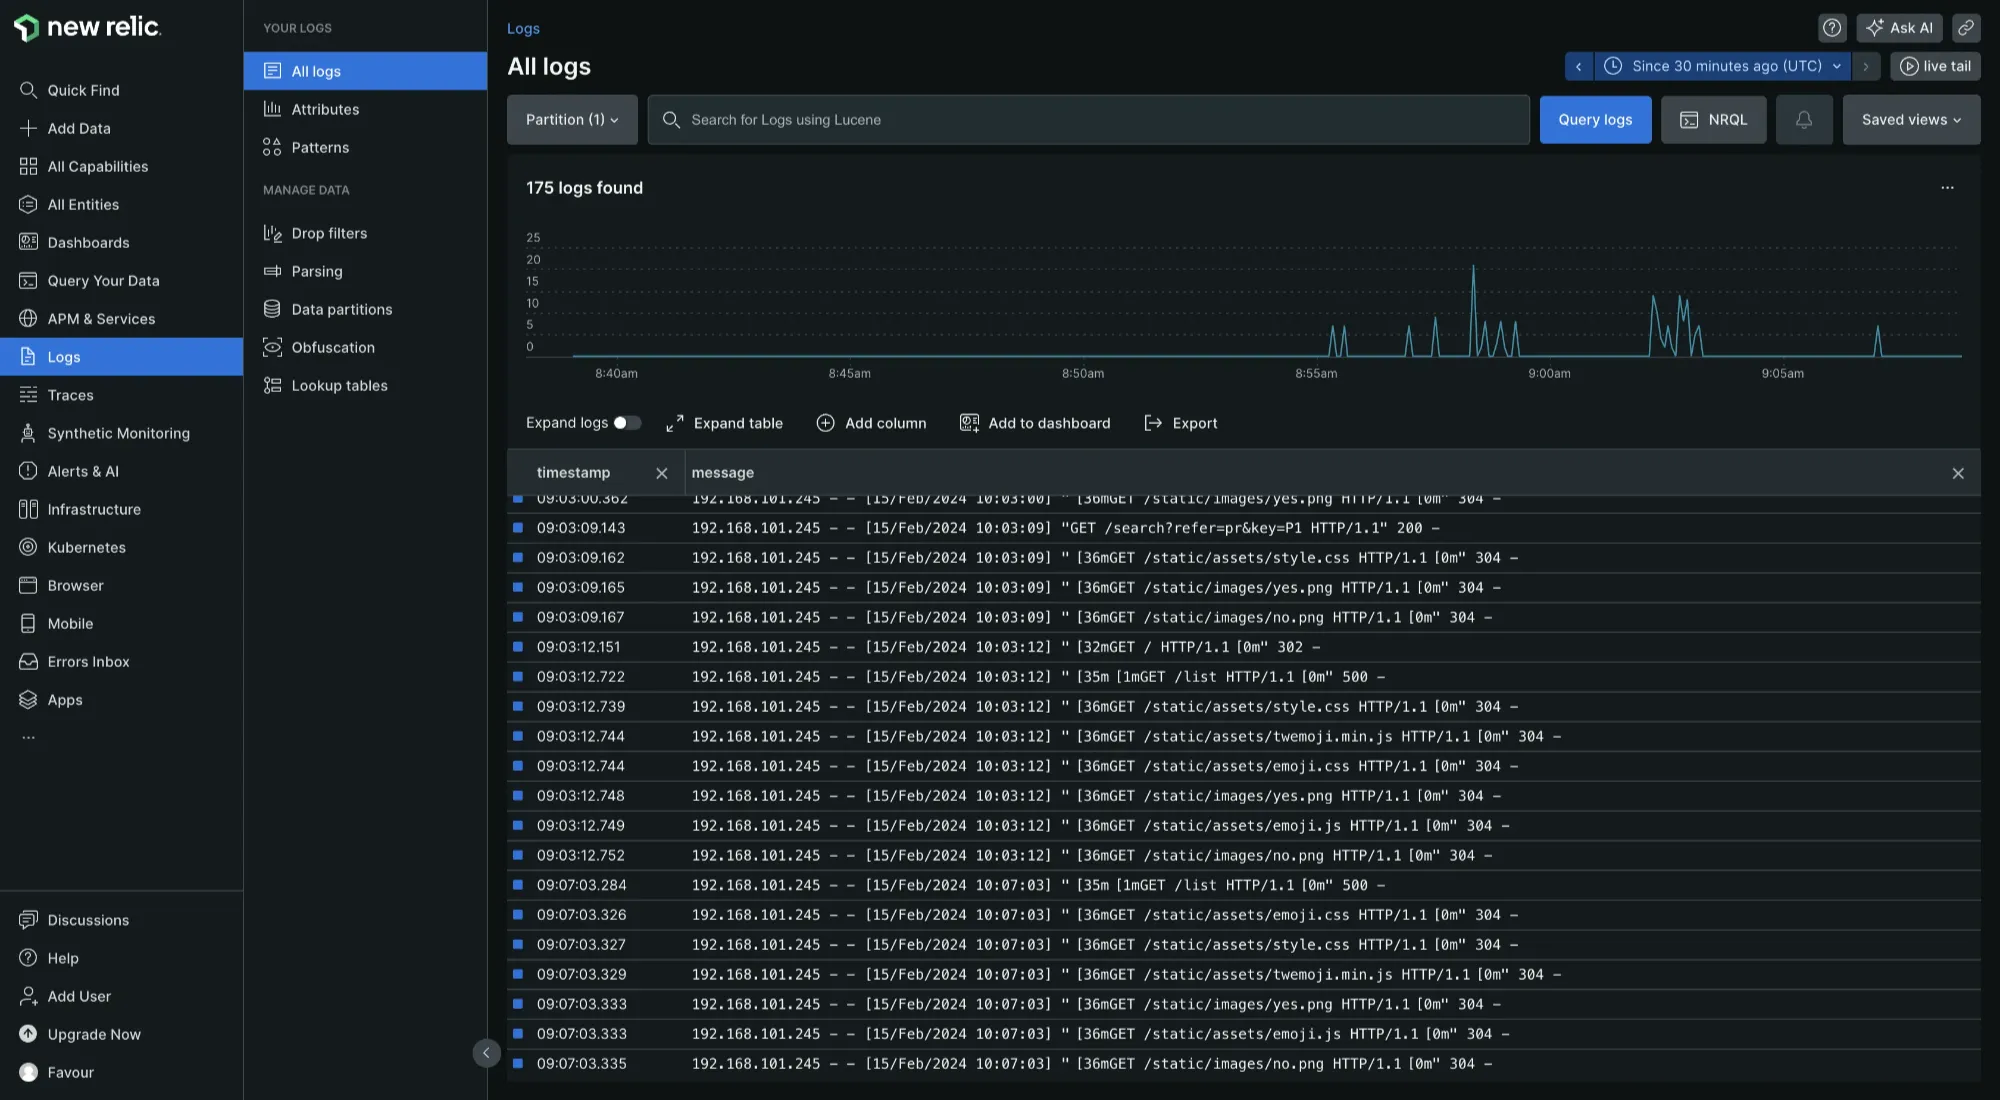
New Relic log management automatically ingests logs from your applications and host infrastructure in a single place (the Logs UI) without requiring manual configuration.
New Relic's log management platform is designed to help you uncover insights from your logs. It enables you to search for patterns and trends within your log data, which is crucial for identifying anomalies and potential issues that could impact your application's performance and reliability. I was able to run queries against my logs using the New Relic Query language (NRQL) and Lucene (an open-source search engine library) to get the exact log information that I needed. It also allows parsing of logs, making your log messages easier to query, search, and chart.
Sentry
While logging provides a trail of events, including errors and informational messages, Sentry's core functionality revolves around capturing actionable errors and crashes in your applications.
Sentry's approach to log management involves capturing events and storing them in a way that is optimized for error tracking and debugging. Sentry works alongside your existing logging infrastructure and integrates directly with it. It does not replace the need for traditional logs but complements them by providing detailed context for debugging.
New Relic does log management better than Sentry by offering enhanced log management capabilities.
Pricing: New Relic for its free forever plan
New Relic
New Relic's pricing model is based on two factors: the volume of data ingested and the number of user seats. It offers a free forever plan that includes 100GB of data ingestion per month, after which additional data ingestion incurs charges at either $0.3/GB or $0.5/GB, depending on the plan. The cost of user seats can become significant for organizations with many users.
Sentry
Sentry operates on a pricing model structured around user seats and monthly rates, featuring various tiers, with the developer tier available at a starting price of $0 per month (free trial). The team and business tiers are priced at $20 and $80 monthly while the enterprise tier requires contacting the Sentry team.
Both tools can be cost-effective and also expensive to use. New Relic’s free forever plan makes it a cost-effective solution as well as Sentry’s open-source self-hosted version. Comparing both from a managed service point of view, New Relic is less expensive. Generally, decisions for pricing should be made based on the use case.
Choosing Between New Relic and Sentry
Choosing between New Relic and Sentry ultimately depends on your specific monitoring and observability needs.
Here’s a use-case-based guide to help you:
- If you want full visibility into your application performance, choose New Relic.
- if you want to track errors in your applications, choose Sentry.
- If you want a better correlation between your telemetry signals, choose New Relic.
- If you want more control, flexibility, and insights into your infrastructure, application, and services, choose New Relic.
- If your use case is real-user monitoring, then choose New Relic.
If you are still not satisfied with both tools, there are a ton of good options in the market. A really good contender to both New Relic and Sentry you can check out is SigNoz. If you want to look more broadly, the New Relic alternatives and Sentry alternatives guides cover more options, and the Datadog vs Sentry comparison pits Sentry against another full observability suite.
SigNoz: A Better Alternative to New Relic and Sentry
SigNoz is a full-stack open-source tool that provides comprehensive application performance monitoring capabilities across your entire stack. It provides logs, metrics, and traces under a single pane of glass, and lets you correlate metrics and traces easily with a single click.
Compared to New Relic and Sentry, SigNoz is more cost-effective. Unlike these platforms, SigNoz does not charge based on user seats, which can become costly for large organizations. Instead, it employs a transparent and predictable pricing model, allowing you to pay only for what you use.
Getting Started with SigNoz
SigNoz Cloud is the easiest way to run SigNoz. Sign up for a free account and get 30 days of unlimited access to all features.

You can also install and self-host SigNoz yourself since it is open-source. With 24,000+ GitHub stars, open-source SigNoz is loved by developers. Find the instructions to self-host SigNoz.
Frequently Asked Questions
Q: What is the major difference between New Relic and Sentry?
A: New Relic primarily focuses on comprehensive application performance monitoring (APM) and provides insights into the overall health and performance of applications, infrastructure, and user experiences. On the other hand, Sentry specializes in error tracking and exception monitoring, offering detailed insights into individual errors and exceptions within applications, along with user-reported issues.
Q: How does Sentry handle error monitoring in contrast to other platforms?
A: Sentry offers real-time error tracking, crash reporting, performance monitoring, and user feedback, with flexible customization options and insights into errors and performance issues, making it a comprehensive tool.
Related Content
** For other New Relic head-to-heads, see New Relic vs AppDynamics, Datadog vs New Relic, and OpenTelemetry vs New Relic.**
