New Relic vs DataDog - Features, Pricing, and Performance Compared (2026)
New Relic vs DataDog: Both tools are popular for application and infrastructure monitoring, offering a wide range of features. This post compares New Relic and DataDog on key aspects like APM, log management, and OpenTelemetry support.
Datadog vs New Relic: Overview
New Relic and Datadog represent two leading approaches to observability platforms. Datadog started as an infrastructure monitoring tool and expanded into a full-stack solution, while New Relic pioneered application performance monitoring and evolved into a comprehensive observability suite.
For application monitoring, both Datadog and New Relic offer similar core features. The difference lies in the actual user experience and specialized capabilities. My research found that Datadog gives you more granular controls and has stronger security features like Cloud SIEM, while New Relic feels simpler to start with and offers a more application-centric approach.
Here's a quick overview of the overall platform features and functionality of DataDog and New Relic:
| Feature | DataDog | New Relic |
|---|---|---|
| APM | ✅ Available | ✅ Available |
| Log Management | ✅ Available | ✅ Available |
| Infrastructure Monitoring | ✅ Available | ✅ Available |
| Network Monitoring | ✅ Available | ✅ Available |
| Security Monitoring | ✅ Comprehensive | 🟡 Limited (in preview) |
| Synthetic Monitoring | ✅ Available | ✅ Available |
| Real User Monitoring | ✅ Available (with session replay) | ✅ Available |
| Kubernetes Monitoring | ✅ Strong (dedicated Cluster Agent) | ✅ Strong (one-step observability) |
| OpenTelemetry Support | 🟡 Limited | 🟡 Limited |
| Free Tier | 🟡 Limited | ✅ Available (100GB free data per month) |
| Integrations | ✅ 800+ | ✅ 780+ |
These differences highlight the strengths and weaknesses of DataDog and New Relic, helping you choose the right observability platform for 2026 based on your specific needs.
For a deeper dive into the specific features and performance of New Relic vs DataDog, let's explore the detailed comparison in the sections below.
APM: Datadog for More Control, New Relic for Simplicity
I instrumented a sample Java application and sent data to both DataDog and New Relic for APM. The steps are almost the same in both DataDog and New Relic, with New Relic having a few extra steps. Both New Relic and DataDog require you to install their agent as well as a programming language-specific agent, which, in my case, was a Java agent.
DataDog APM
In DataDog, I had a hard time figuring out whether my setup was complete or not, and I found the onboarding flow of New Relic much better.
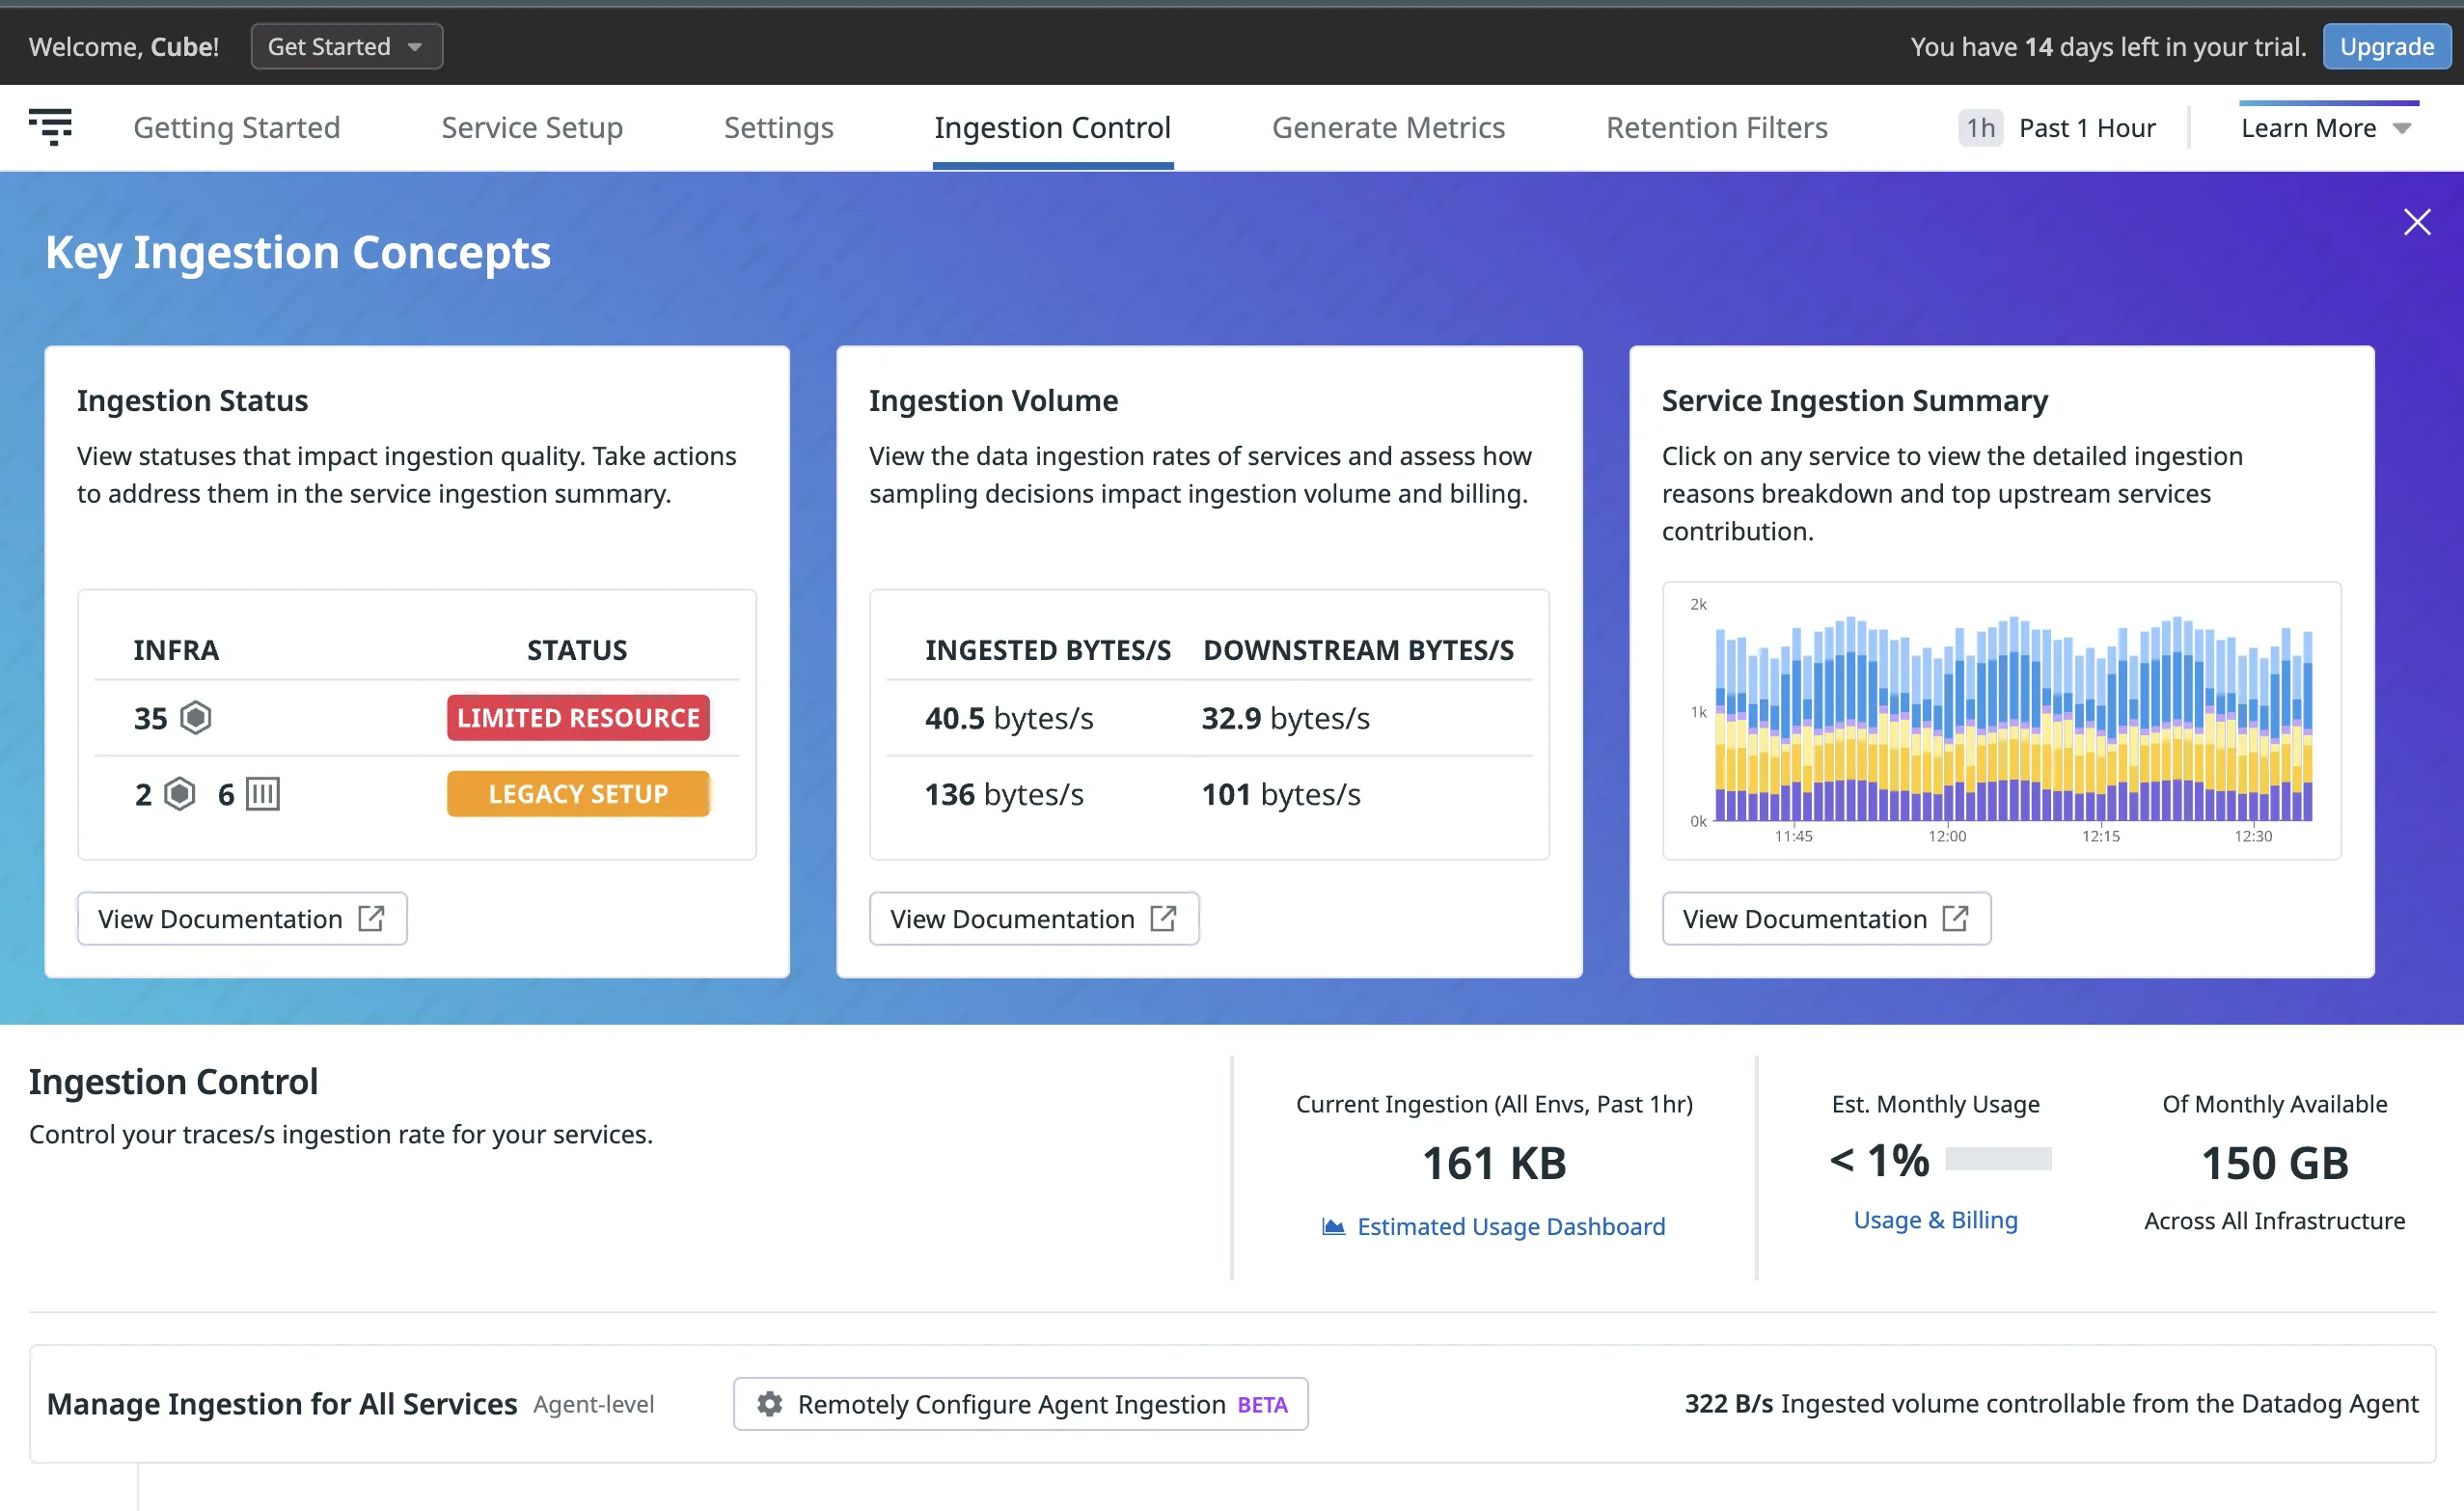
The good thing about DataDog is it gives you a lot of control. You can set up things like collecting custom metrics (which might be expensive), sampling rate, and telemetry correlation between traces and logs right from the beginning.
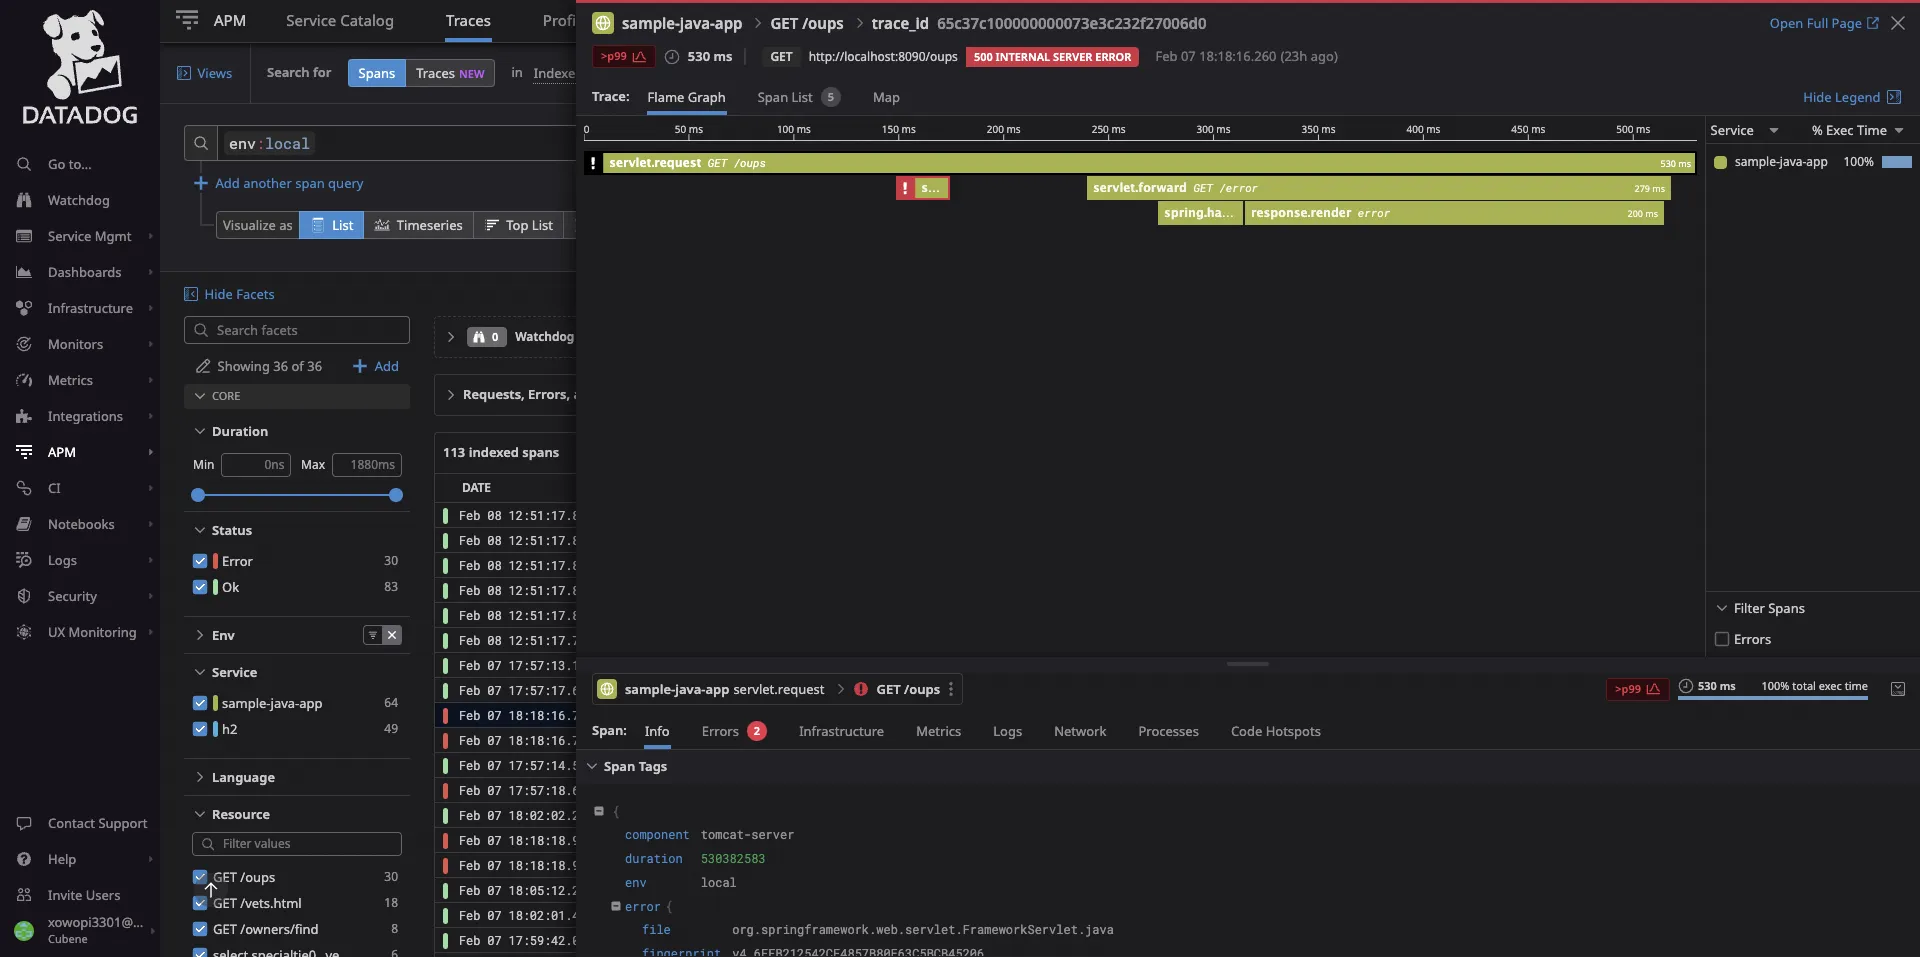
Once the setup is done, you can see your list of spans and corresponding flamegraphs for your traces. DataDog does a good job of correlating different types of signals. You can relate info from infrastructure, metrics, network, etc., right from trace data if you have those products enabled.
Some of the key features of DataDog APM include:
- ✅ Distributed tracing to track requests from user sessions to services and databases.
- ✅ Correlation of distributed traces to infrastructure and network metrics.
- ✅ Ingest 100% of traces from the last 15 minutes with retention of error and high latency traces.
- ✅ Code-level performance inspection and breakdown of slow requests.
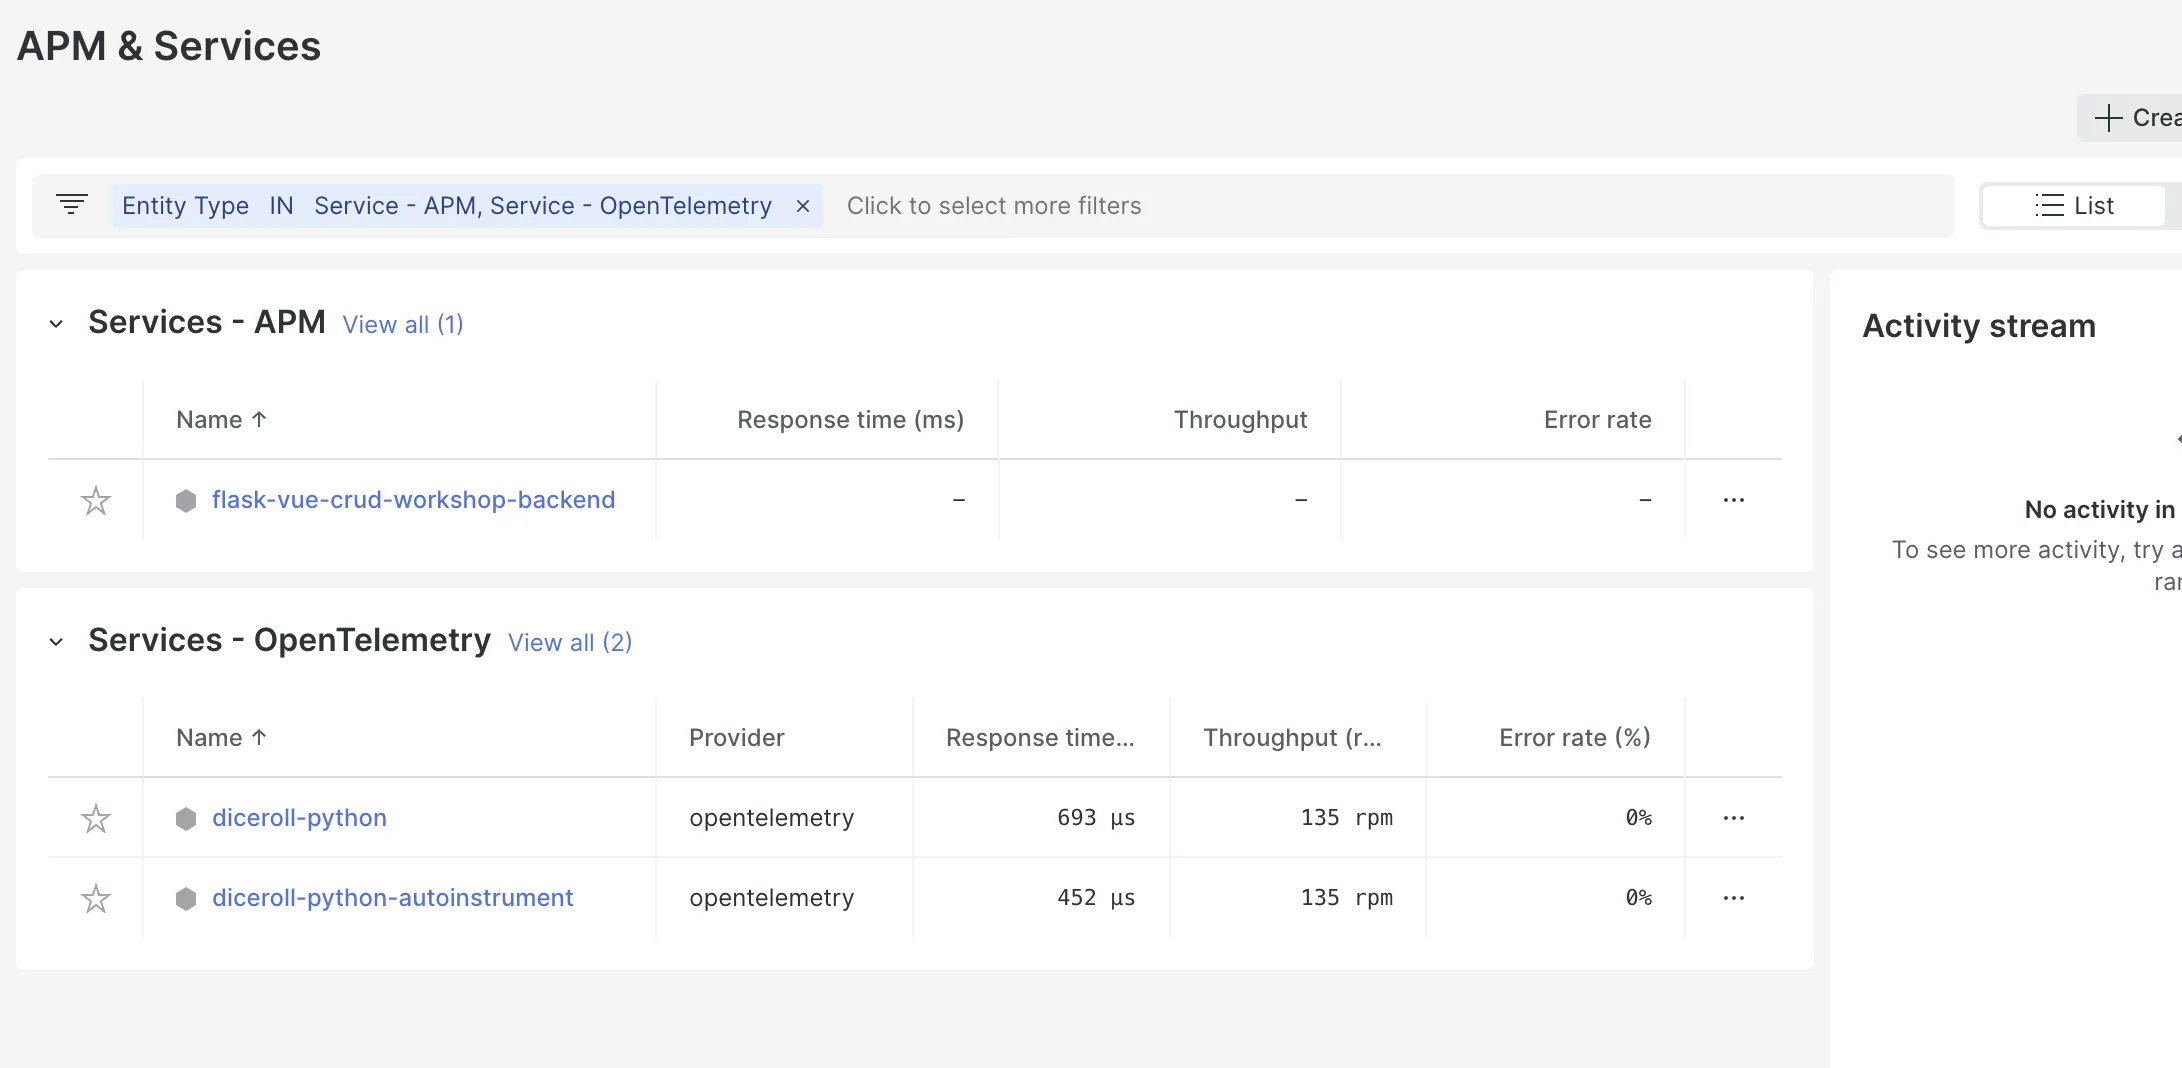
New Relic APM
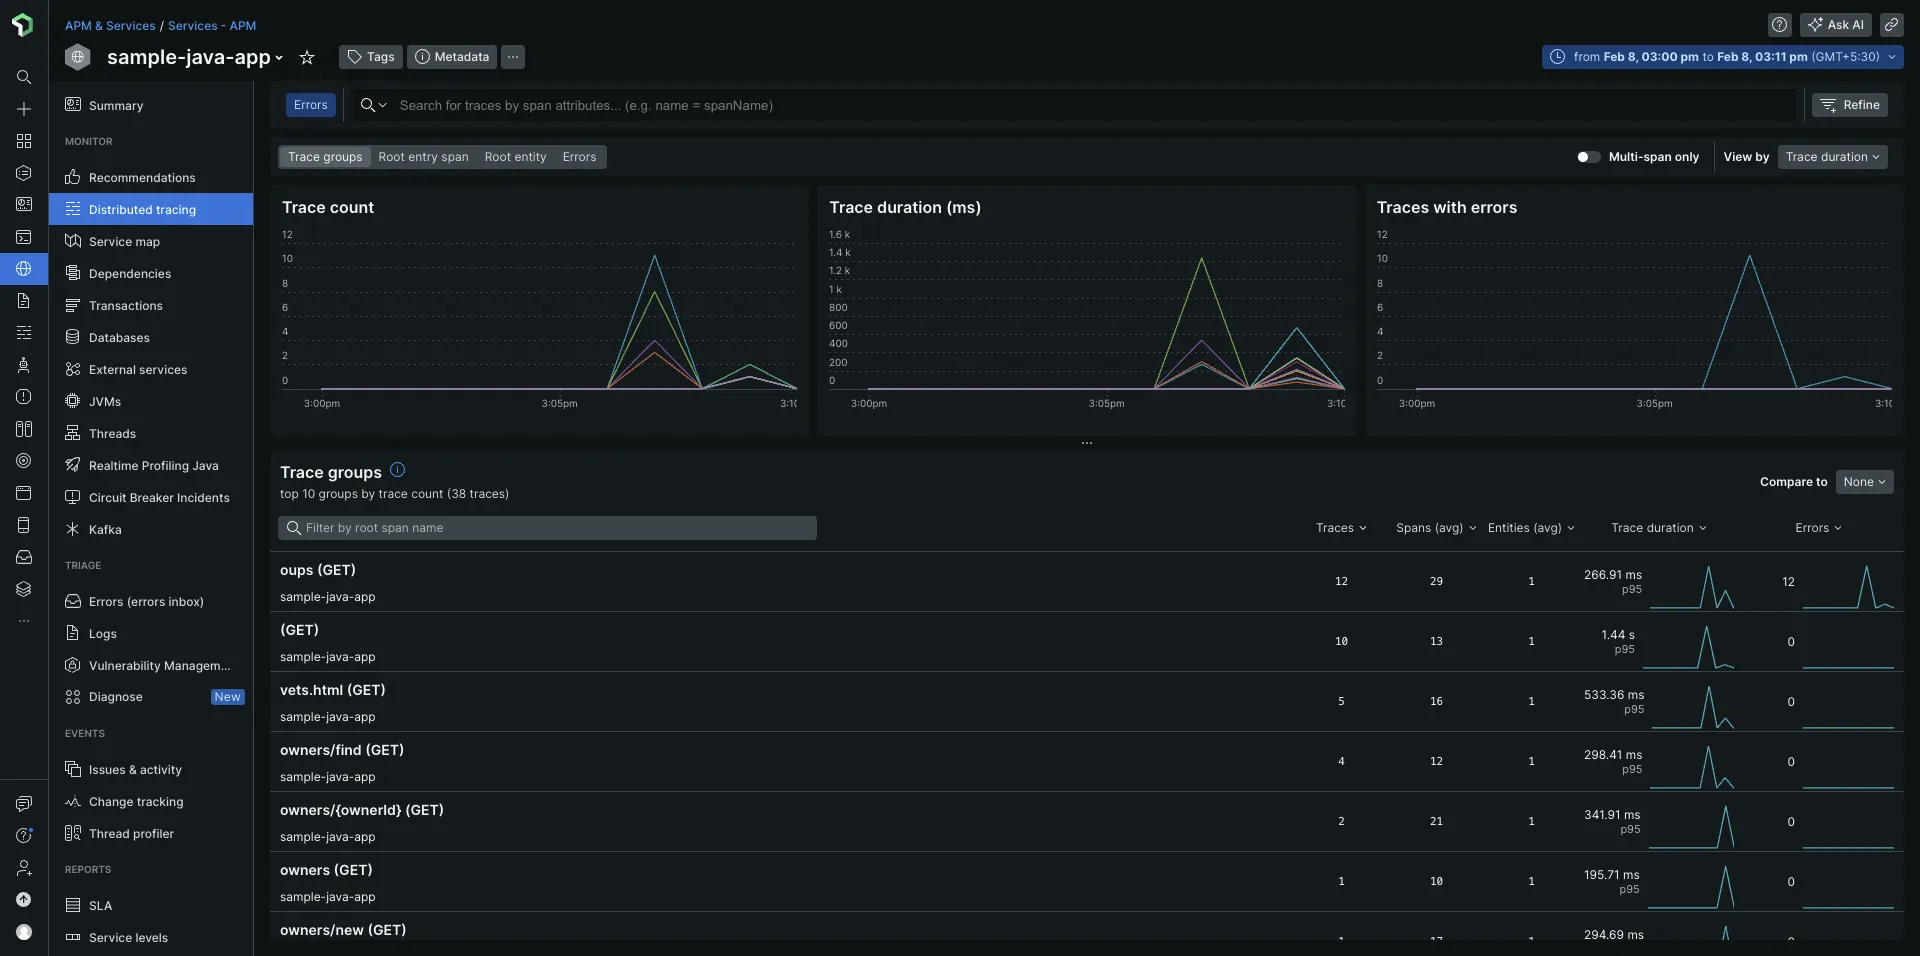
New Relic's traces page shows trace groups instead of a list of spans, which feels like a cleaner representation, and you can filter by root spans, which comes in handy in case of large trace groups.
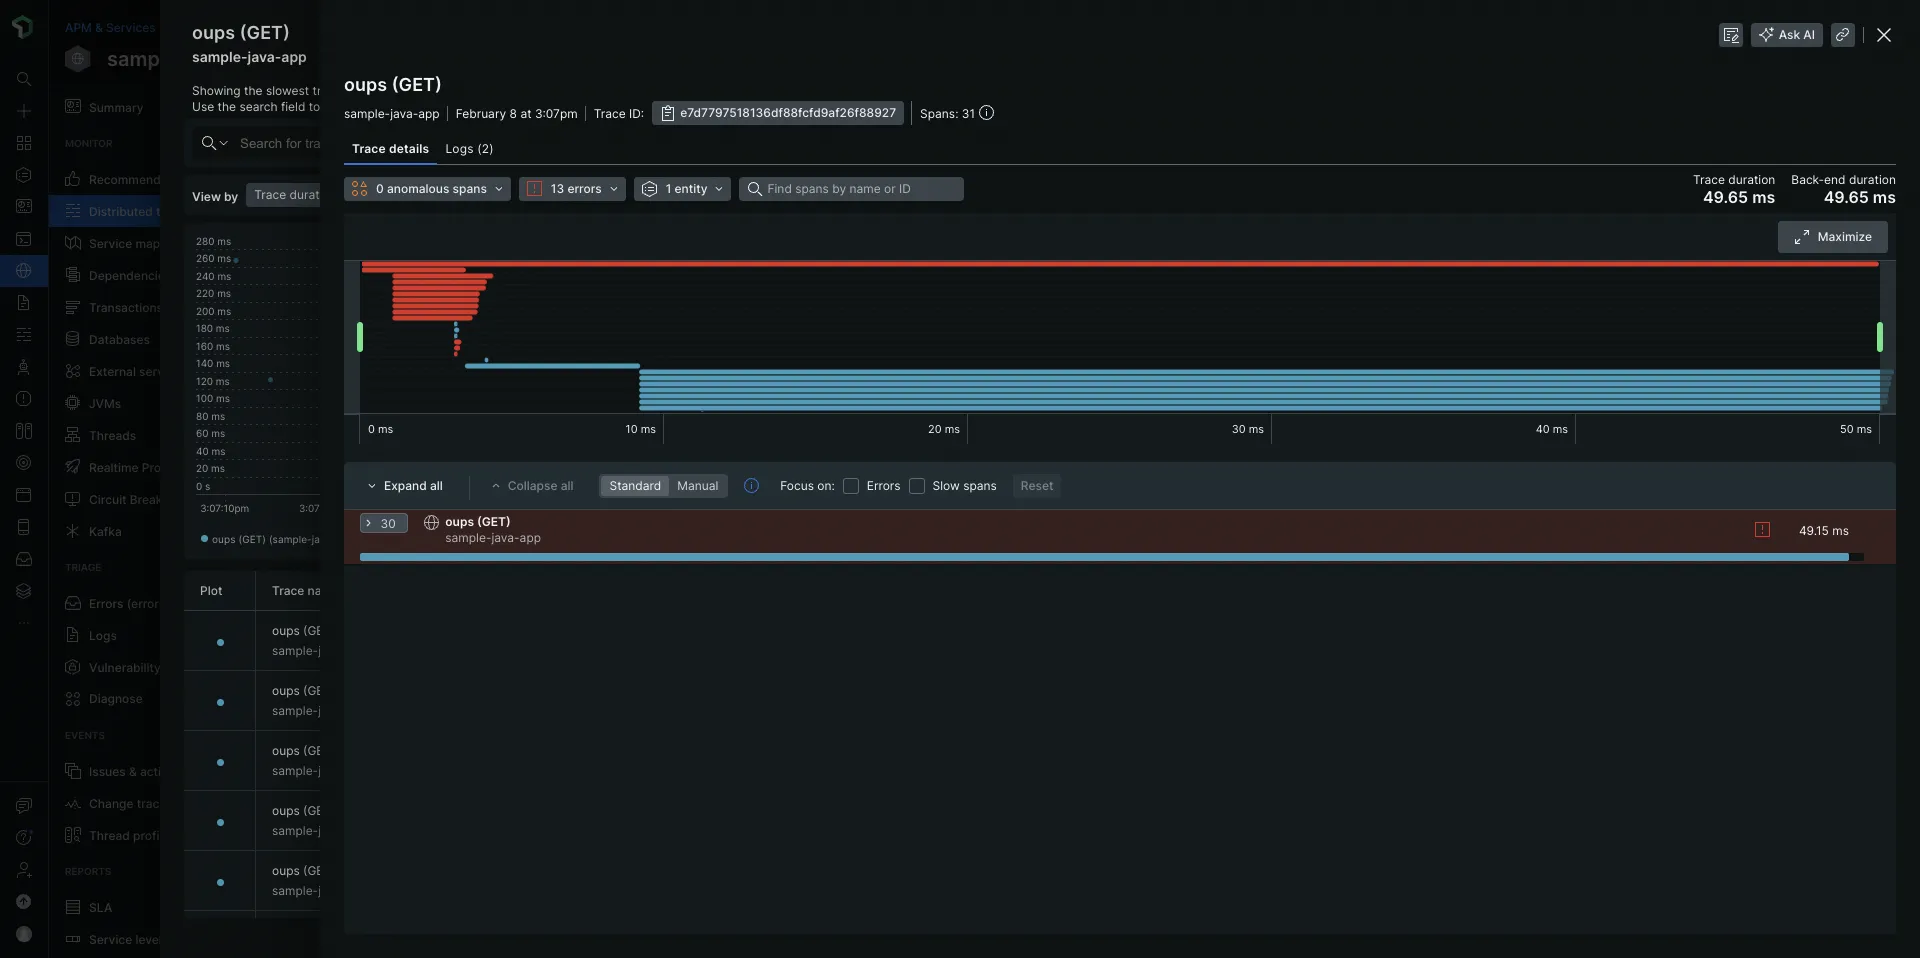
You can get flamegraphs for your traces in New Relic, too. Compared to DataDog, New Relic has fewer options for correlation. But it is interesting to note that New Relic shows many more spans for the same call in my Java application.
Some of the key features of New Relic APM include:
- ✅ Auto-instrumentation of eight programming languages: Java, .Net, Node.js, PHP, Python, Ruby, Go, and C/C++
- ✅ Distributed tracing and sampling options for a wide range of technology stacks
- ✅ Correlation of tracing data with other aspects of application infrastructure and user monitoring
- ✅ Fully managed cloud-native experience with on-demand scalability
Verdict: New Relic vs DataDog
Overall, if you need a simpler experience, then choose New Relic's APM. But if you need more control over what things you can do with your data, then choose DataDog's APM.
Let's dive deeper into the specific features and performance of New Relic vs DataDog in the next sections.
Log Management: DataDog for More Filters, New Relic for Quick-Start
New Relic Log Management
New Relic automatically collected logs from my Java application and displayed them in the logs tab. It allows you to search logs using Lucene, an open-source search library, and query log data using NRQL, a SQL-like query language developed by New Relic.
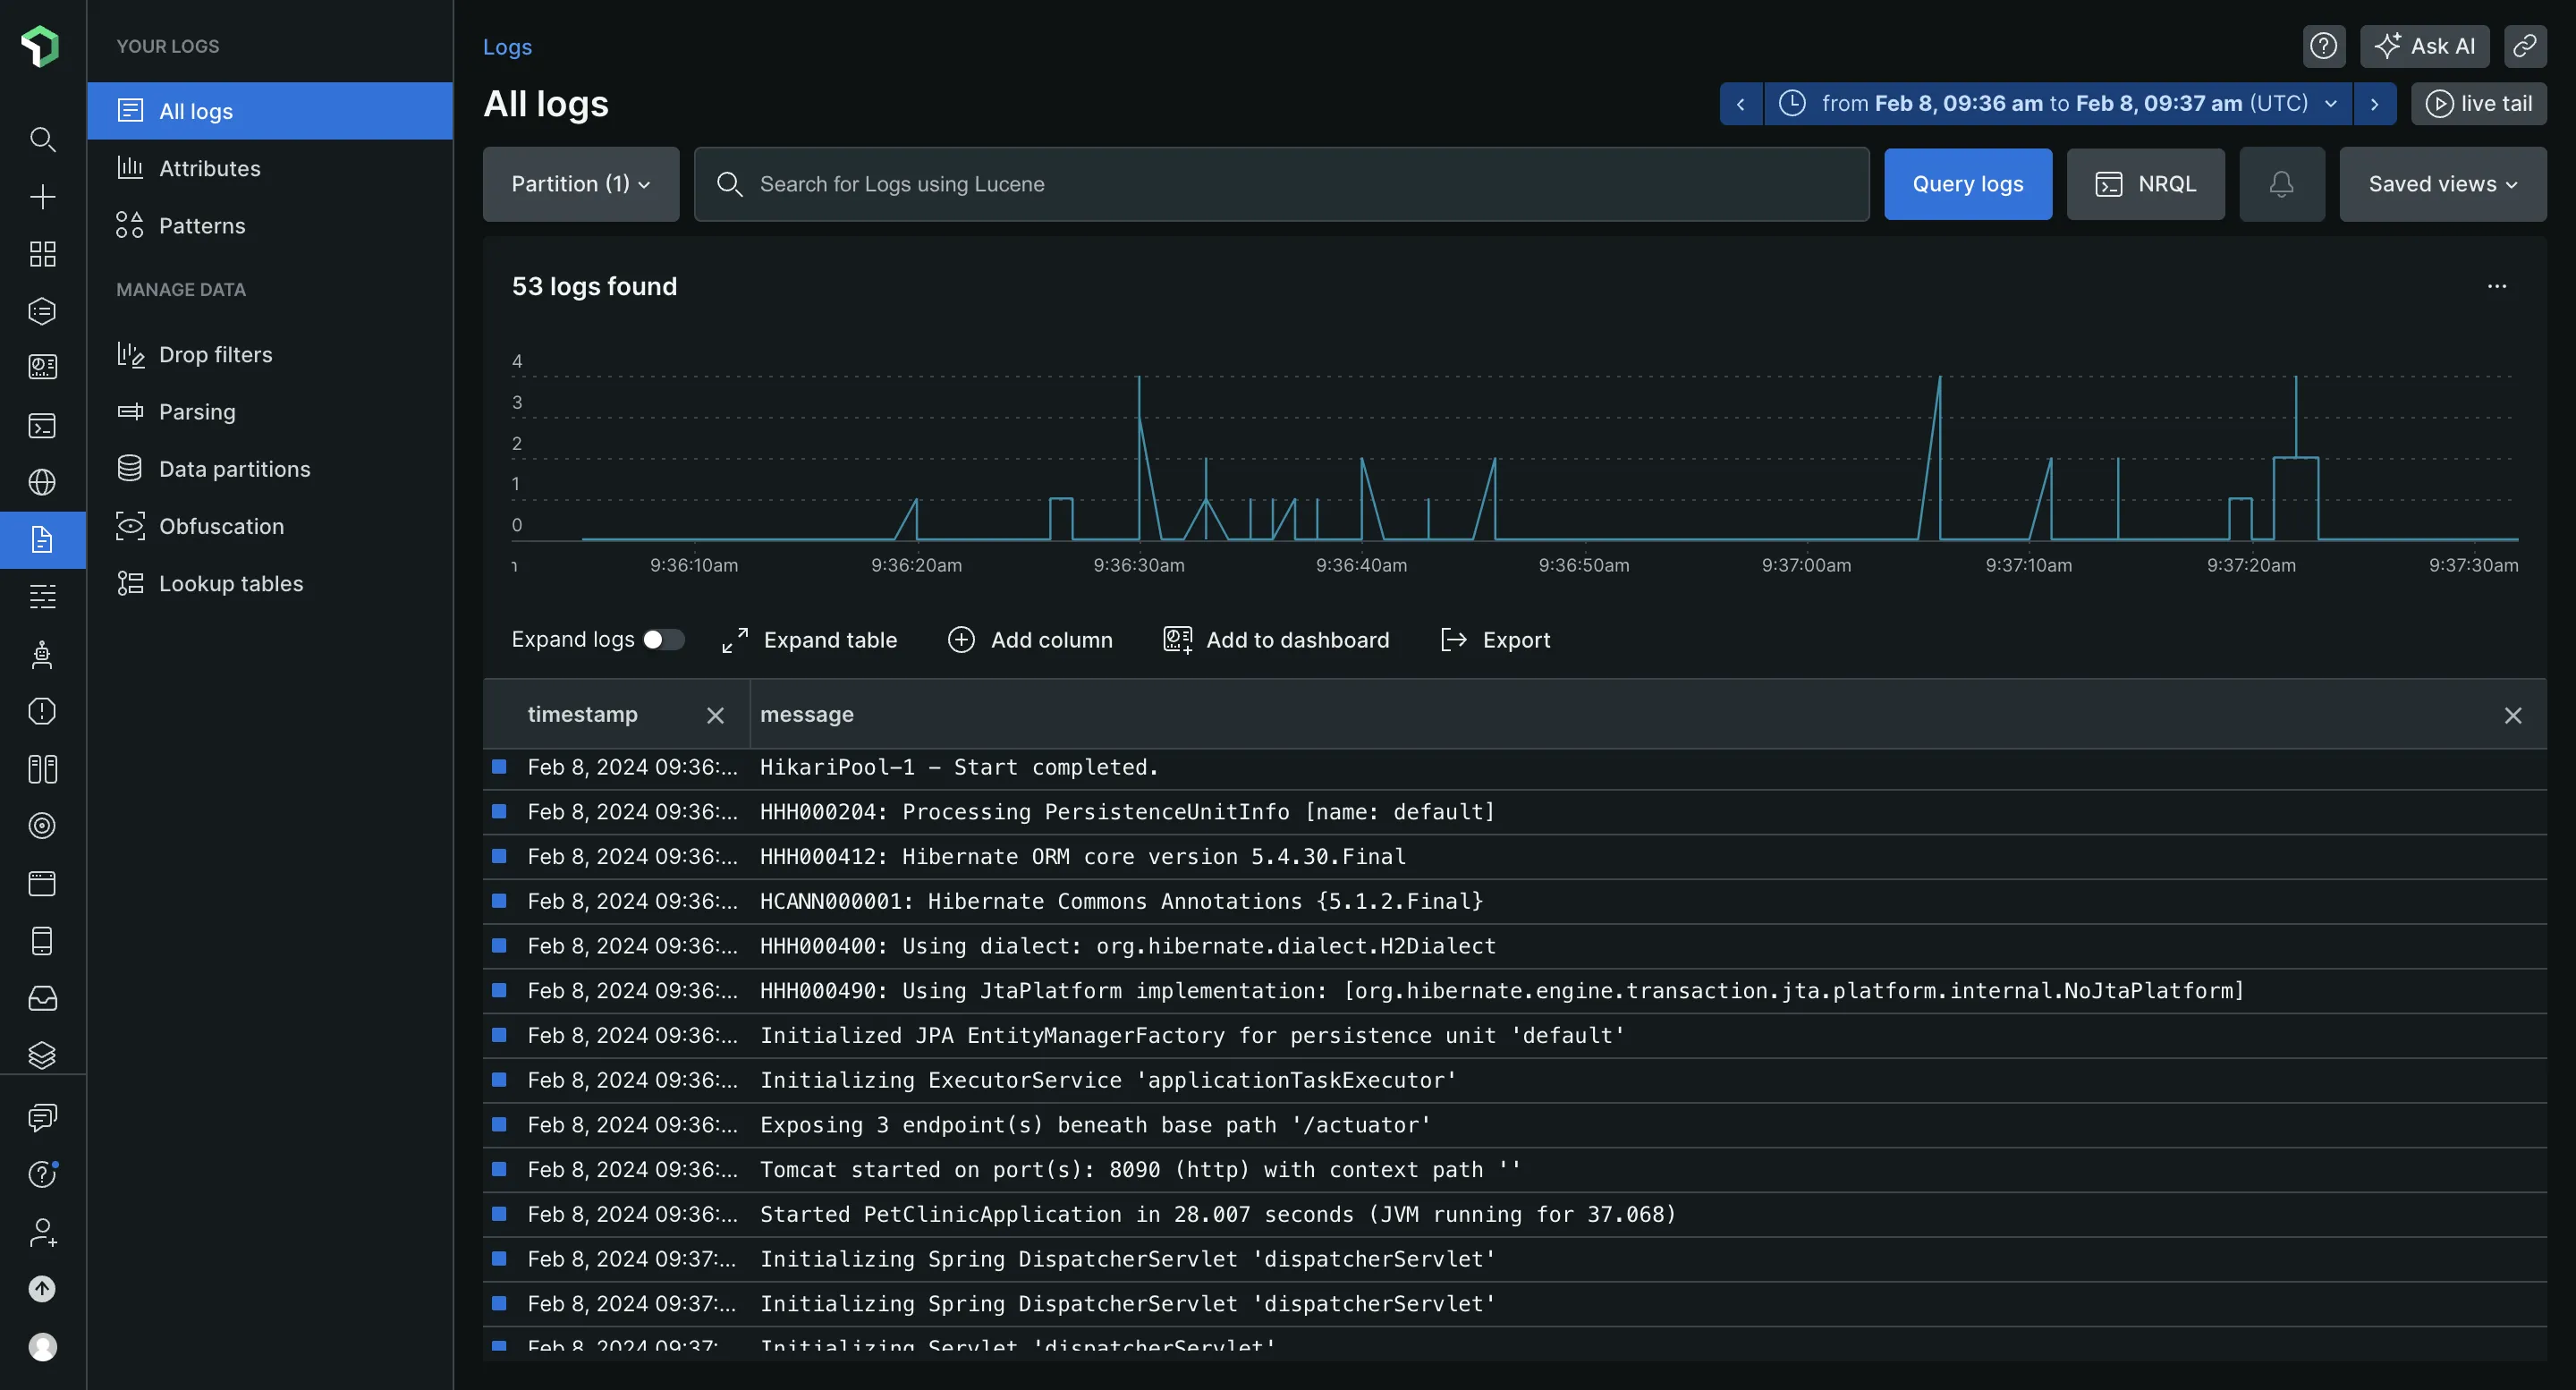
Key features of New Relic's log management:
- Automatically extracts attributes from logs.
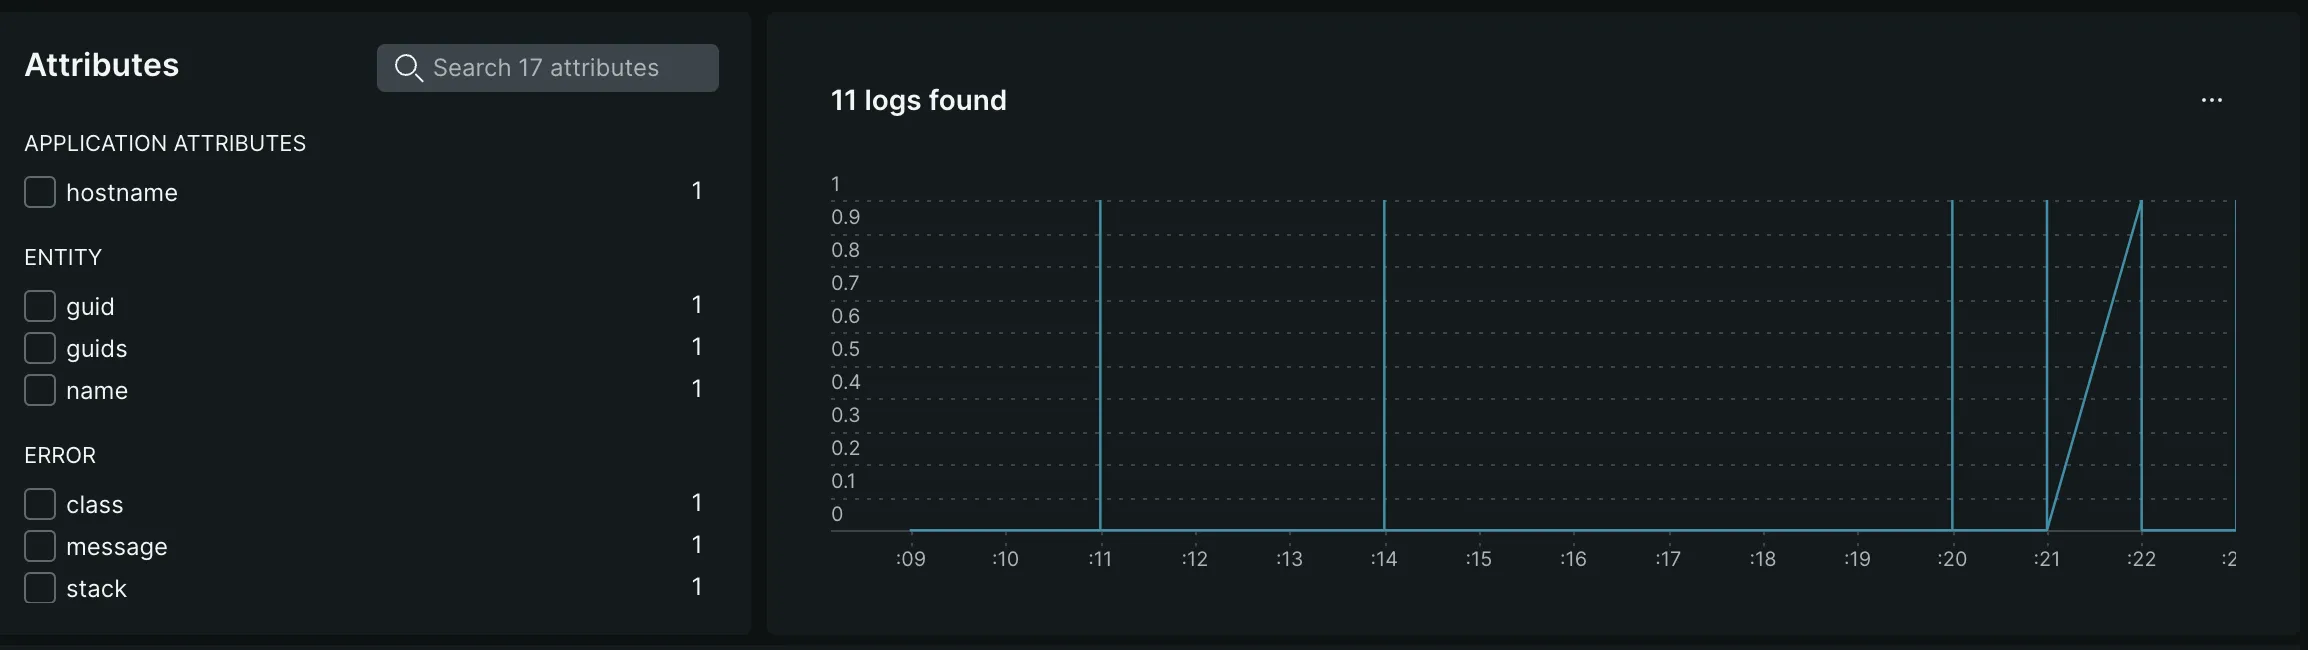
Attributes filtered from Java application logs in New Relic - Provides a feature called patterns for log data discoverability, though it didn't detect any pattern in my Java application logs.
- Tools to manage log data by optimizing storage with dropping filters.
DataDog Log Management
For DataDog, automatic log collection is disabled by default and needs to be enabled in the agent's config file, along with activating a Java integration for application logs collection.
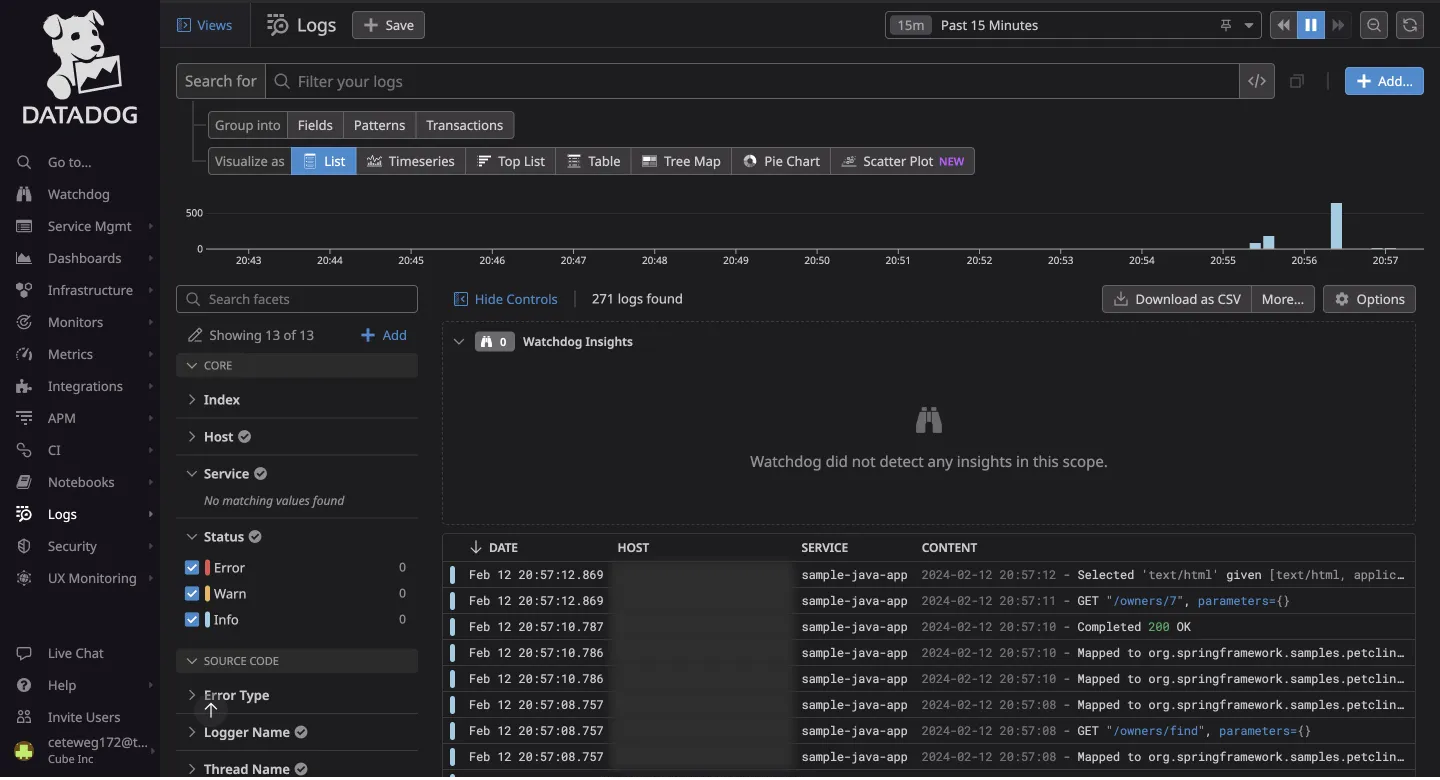
Both DataDog and New Relic offer log pattern detection, but DataDog identified patterns in my logs, while New Relic did not. DataDog provides more options to filter and visualize log data and allows the use of cloud storage for logs, useful for long-term storage.
Setting up log collection in DataDog took more time compared to New Relic, but DataDog offers more visualization options.
Verdict: New Relic vs DataDog
If you need a log management solution that's quick to set up, New Relic is the better choice with its automatic log collection and easy setup. However, if you require more control over filtering and visualizing logs, DataDog's log management provides more advanced options.
Cut Your Observability Spend by 80%—Here's How
Switch from Datadog seamlessly with our automated migration tool, comparable features and up to 80% cost savings.
Infrastructure Monitoring: Tie, Decide Based on Cost
Host monitoring in both DataDog and New Relic is good, and choosing one over the other can be a matter of personal choice. I personally like the color theme of New Relic and the representation of things like disk usage in a table.
DataDog Infrastructure Monitoring
What's interesting about DataDog is that it showed me a glimpse of the JVM metrics dashboard while clicking on my host. DataDog has done a really good job at correlating different types of information collected from your application and host.
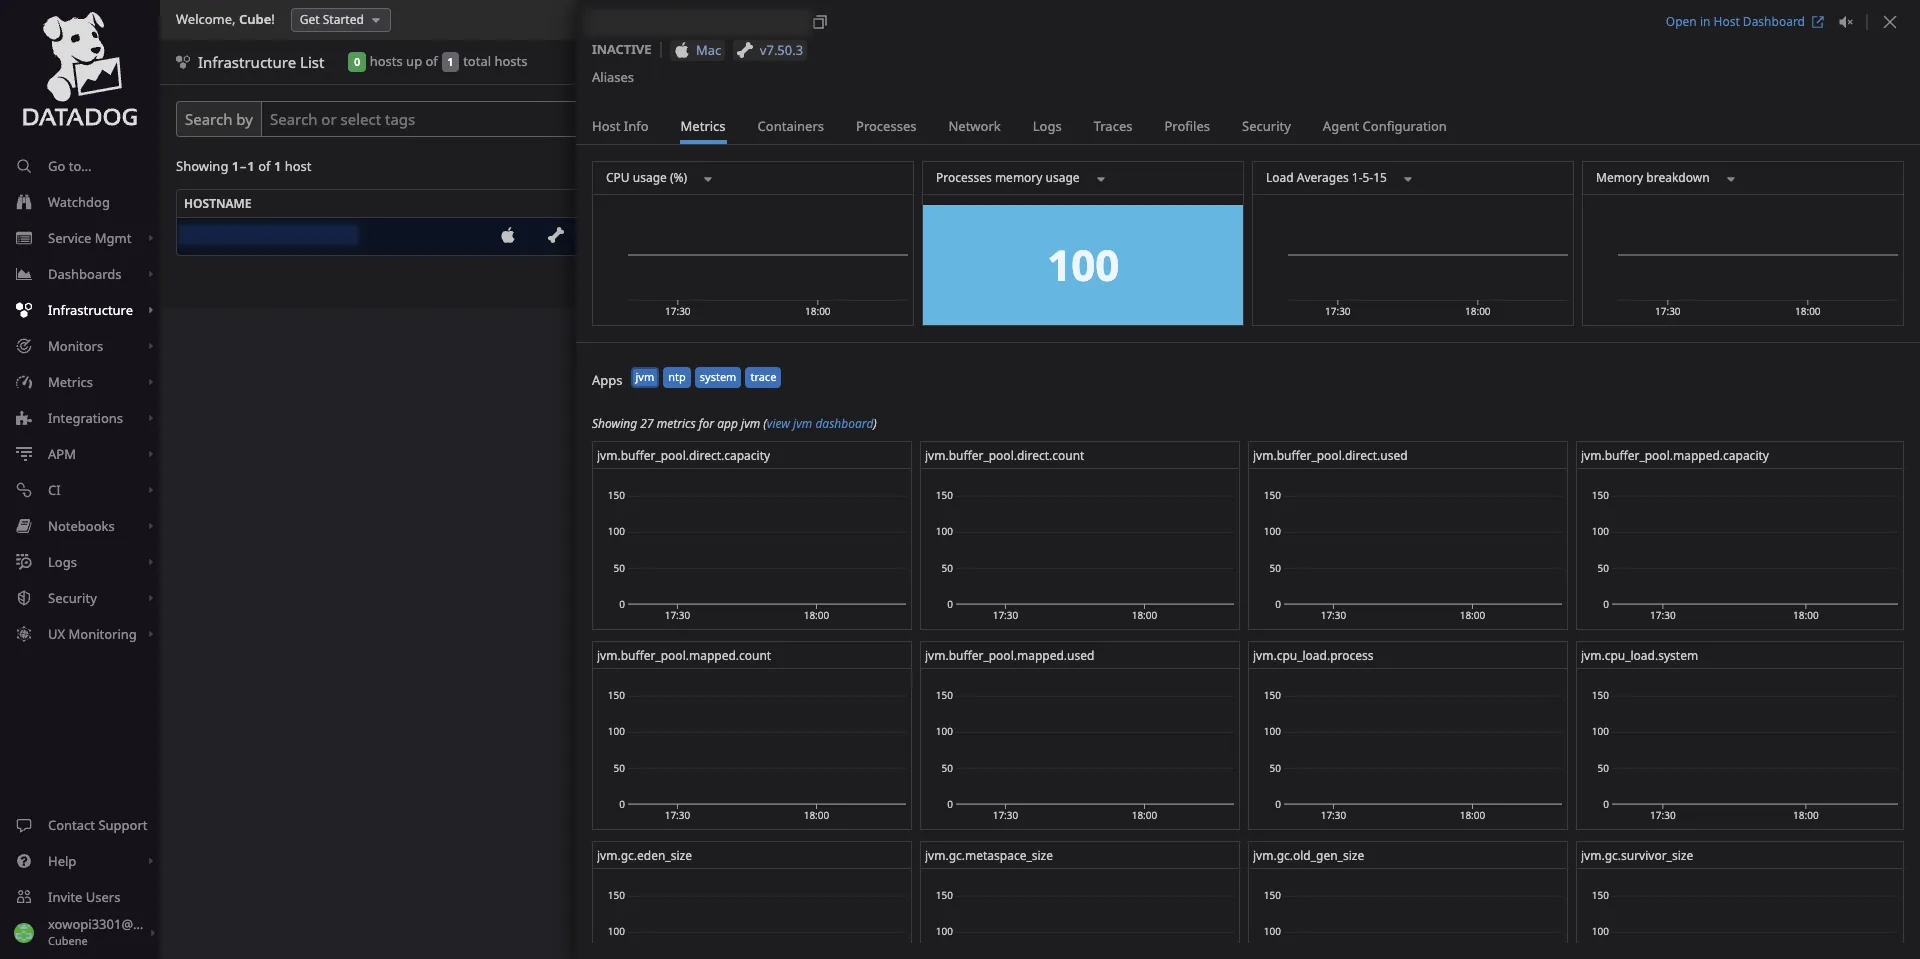
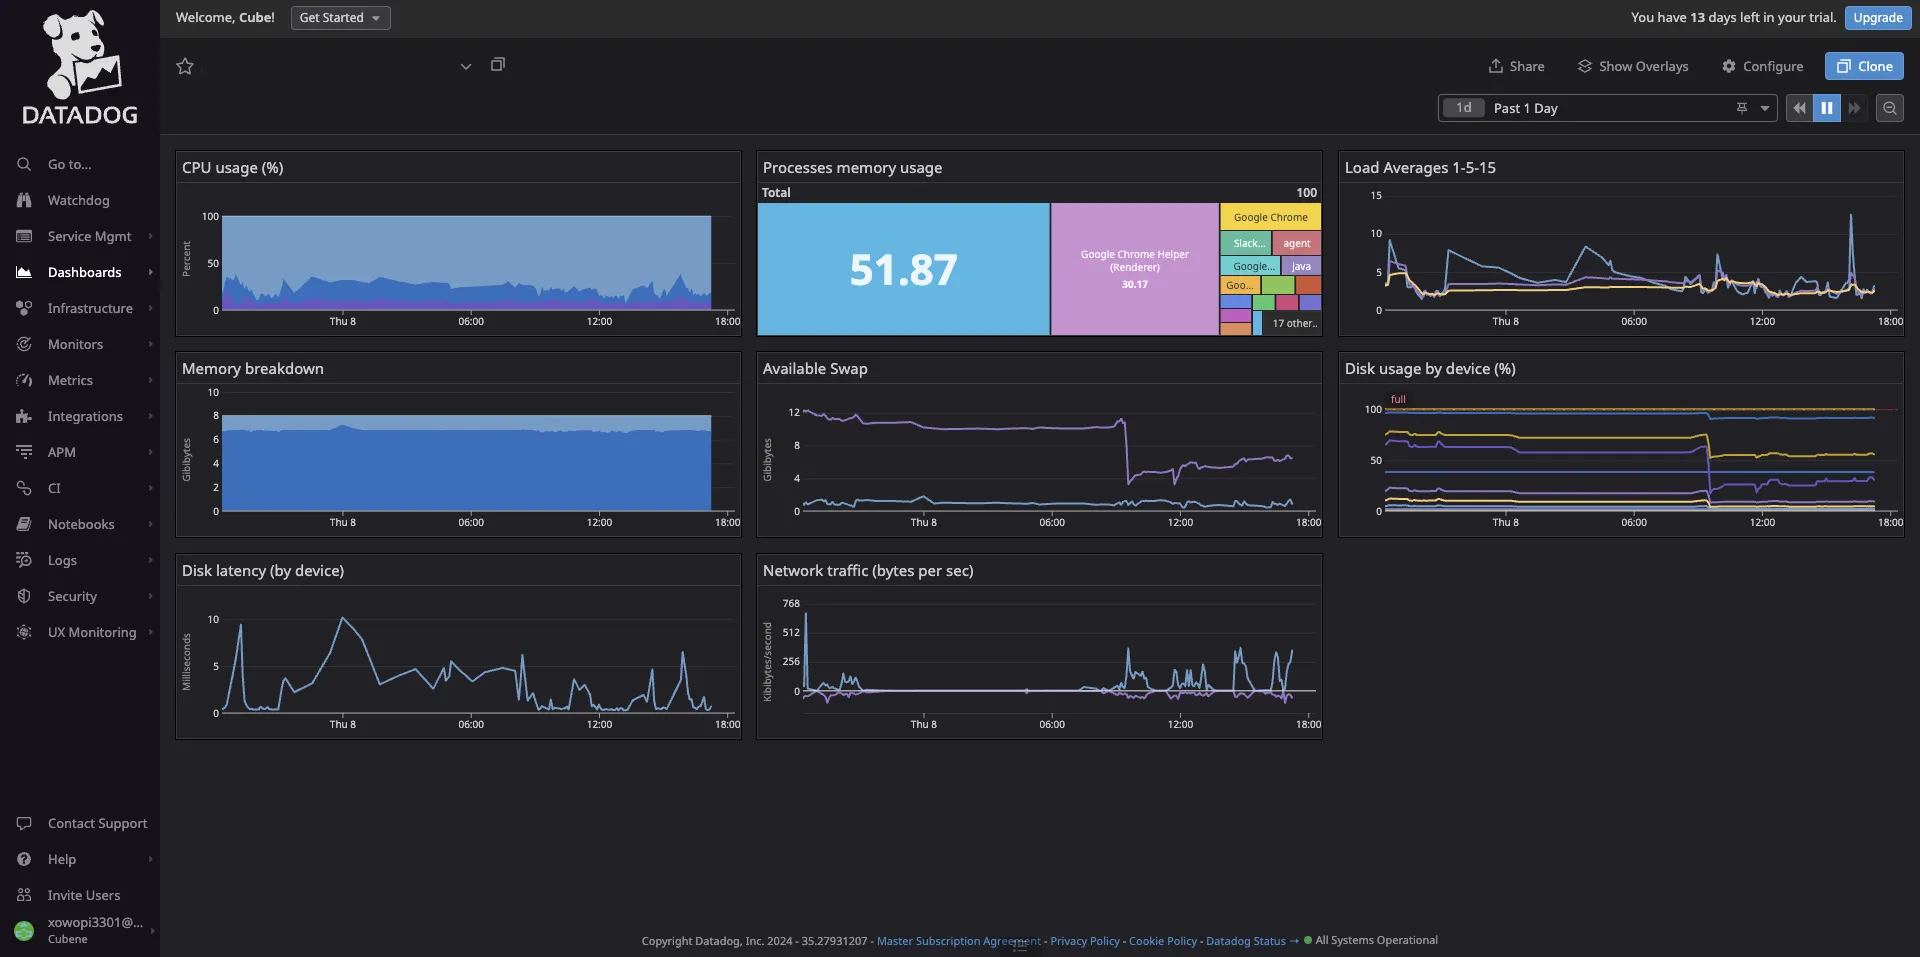
Some of the key features of DataDog's infrastructure monitoring include:
- ✅ You can see all your machines in the infrastructure list. Each machine/host has tags, aliases, and metrics attached to it.
- ✅ DataDog provides a Host map to visualize all your hosts on one screen.
- ✅ It also provides a container map and real-time monitoring of containers.
New Relic Infrastructure Monitoring
New Relic's infrastructure monitoring provides robust features for connecting host performance with configuration changes.
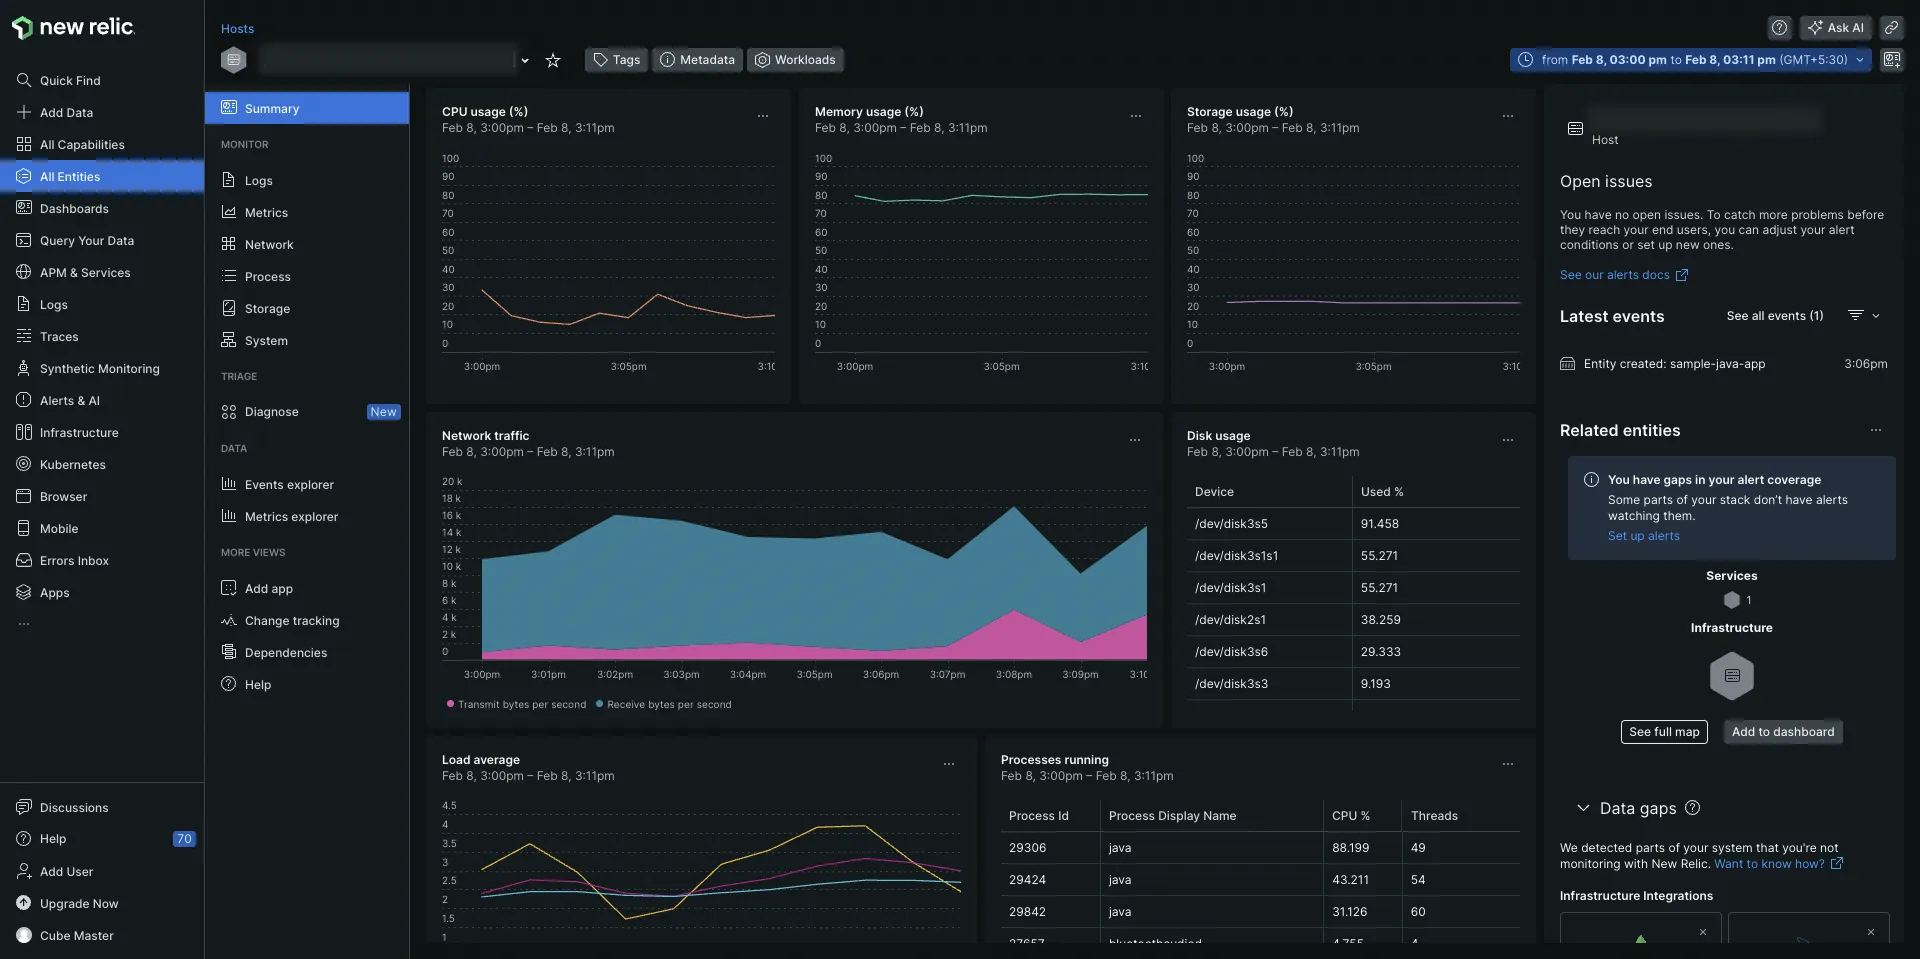
Some of the key features of New Relic infrastructure monitoring include:
- ✅ Connect changes in your host performance with your configuration changes.
- ✅ Troubleshoot performance issues by connecting the server-side to the application side if your infrastructure account is connected with the APM account.
- ✅ Provides integrations to collect metrics for popular platforms like AWS, GCP, Azure, Kubernetes, etc.
Verdict: New Relic vs DataDog
If your use case is only infrastructure monitoring, then the decision comes down to cost. However, it's not easy to figure out how much each tool will cost on a head-to-head basis as their pricing structures are very different. I recommend you sign up and do a trial for both tools, including factors like user seats (New Relic charges for user seats).
Network Monitoring
DataDog Network Monitoring
DataDog offers robust network monitoring capabilities. Some of the key features include:
- ✅ Provides metrics for point-to-point communication within your infrastructure.
- ✅ Granular data for network flows in a multi-cloud environment with aggregation capabilities supported by tags.
- ✅ Automatically collects tags from more than 450 integrations, allowing you to see network volume between any two sets of tags.
New Relic Network Monitoring
New Relic provides comprehensive network monitoring solutions. Some of the key features include:
- ✅ Pre-configured dashboards for monitoring popular cloud services like Azure, AWS, and GCP, with dynamic alerting.
- ✅ Integrations with over 100 services, including advanced Kubernetes monitoring that correlates metrics from the application and the infrastructure. Check the full list of AWS, Azure, and GCP integrations.
Verdict: New Relic vs DataDog Network Monitoring
Both DataDog and New Relic offer strong network monitoring features. DataDog excels in granular data and multi-cloud environments, while New Relic shines with its pre-configured dashboards and extensive integrations. The choice between the two may come down to specific needs and preferences regarding integration and visualization capabilities.
Browser or Real-User Monitoring
Real User Monitoring (RUM) is critical for understanding actual end-user experience with your applications. Both platforms offer robust solutions but with different approaches.
DataDog Real-User Monitoring
DataDog provides comprehensive end-to-end visibility into user journeys for mobile and web applications. Some of the key features include:
- ✅ Session Replay with up to 30-day retention, allowing you to watch recordings of user sessions
- ✅ Capture and track Core Web Vitals (LCP, FID, CLS) with the ability to set alerts
- ✅ Detailed filtering by user attributes, device, geography, and other dimensions
- ✅ Strong integration with backend APM traces for full-stack visibility
- ✅ Root cause analysis for slow loading times with visibility into code, network, and infrastructure
- ✅ Customer segmentation using tags for real-time error tracking
DataDog's RUM provides powerful analytics but requires additional configuration to enable all features, and it's priced per session.
New Relic Browser Monitoring
New Relic monitors end-users using your application across web browsers, devices, operating systems, and networks. Some of the key features include:
- ✅ Quick implementation with automatic tracking of "four golden signals" of user experience
- ✅ Built-in Apdex scoring for user satisfaction measurement
- ✅ Event trails and breadcrumbs (though no full session video replay)
- ✅ Full-stack visibility to identify end-user latency from backend or network issues
- ✅ Session performance heatmaps showing user interaction with the webpage
- ✅ JavaScript error analytics to track end-user steps leading to errors
New Relic's approach is simpler to implement and provides core functionality out-of-the-box, though it lacks some advanced features like session replay that Datadog offers.
Verdict: New Relic vs DataDog Browser Monitoring
If you need detailed user behavior insights with session replay and fine-grained analysis, Datadog RUM is more powerful. If you prefer quick implementation of essential UX monitoring with minimal setup, New Relic's Browser Monitoring provides what most teams need. Both capture Core Web Vitals and integrate with backend monitoring.
Synthetic Monitoring
Synthetic monitoring simulates user interactions to proactively detect issues before real users encounter them. Both platforms offer comprehensive solutions in this area.
New Relic Synthetics
New Relic Synthetics provides various monitor types including:
- ✅ Simple pings and API tests to check availability
- ✅ Scripted browser interactions for complex user flows
- ✅ Broken link detection and SSL certificate checks
- ✅ Geographically distributed testing from multiple locations
- ✅ Private locations for monitoring internal applications
- ✅ SLA/SLO tracking with over 300 optimization recommendations
New Relic Synthetics offers an easy-to-use scripted browser recorder and straightforward dashboards, making it accessible for teams new to synthetic monitoring.
Datadog Synthetics
Datadog's Synthetic Monitoring supports a wide range of test types:
- ✅ HTTP checks, SSL, DNS, WebSocket, TCP, UDP, ICMP ping, gRPC tests
- ✅ Multistep browser tests with screenshots of simulated sessions
- ✅ Detailed waterfall views for web tests
- ✅ Strong correlation with infrastructure metrics, traces, and logs
- ✅ CI/CD integration for running tests in deployment pipelines
- ✅ Performance budgets for build pass/fail criteria
Datadog excels in providing screenshots and detailed diagnostics when tests fail, as well as supporting lower-level network protocol testing that New Relic doesn't cover.
Verdict: Synthetic Monitoring
Both platforms offer strong synthetic monitoring capabilities, with Datadog providing more granular test types and CI/CD integration, while New Relic offers excellent out-of-the-box scenarios and SLA reporting. Your choice might depend on whether you need specific protocol checks (advantage Datadog) or prefer simpler setup for web app testing (advantage New Relic).
Security Monitoring
Security observability has become increasingly important, and the two platforms differ significantly in this area.
Datadog Security Monitoring
Datadog has invested heavily in security observability with a comprehensive suite of products:
- ✅ Cloud SIEM for log-based threat detection
- ✅ Cloud Workload Security for host/container protection
- ✅ Application Security Management for runtime protection
- ✅ Cloud Security Posture Management for configuration security
- ✅ Real-time threat detection analyzing logs, metrics, and traces
- ✅ Integration with user data from authentication systems
- ✅ Customizable detection rules with severity levels
Datadog's approach brings observability data into the security realm, enabling robust DevSecOps capabilities, though these features come at additional cost.
New Relic Security Features
As of 2026, New Relic's security monitoring capabilities are still developing:
- ✅ Vulnerability management (in public preview)
- ✅ Security Health views
- ✅ Basic security events integration
- ✅ Limited security insights in the same dashboards as performance data
New Relic is beginning to integrate security signals into its observability platform, but lacks a dedicated security monitoring product comparable to Datadog's offerings.
Verdict: Security Monitoring
Datadog is the clear winner for security monitoring in 2026. Its comprehensive suite covers cloud and application security extensively. New Relic currently doesn't offer comparable security monitoring features, so organizations requiring integrated security visibility typically either extend New Relic with third-party tools or consider Datadog for that domain.
Cloud-Native & Kubernetes/Serverless
Modern infrastructure heavily leverages cloud-native architectures, and both platforms have invested in supporting these paradigms.
Datadog Cloud-Native Capabilities
Datadog's infrastructure heritage gives it strong Kubernetes monitoring:
- ✅ Dedicated Datadog Cluster Agent for Kubernetes
- ✅ Auto-discovery of containerized services
- ✅ Integration with Kubernetes Events for deployment changes
- ✅ Live container maps and detailed resource metrics
- ✅ First-class support for AWS Lambda, Azure Functions, and Google Cloud Functions
- ✅ Serverless monitoring with cold start tracking and cost visibility
- ✅ 800+ integrations covering cloud-native tools
Datadog's extensive integrations and purpose-built components for container and serverless environments make it particularly strong for complex cloud-native architectures.
New Relic Cloud-Native Capabilities
New Relic has made significant advances in Kubernetes monitoring:
- ✅ "One-step Kubernetes observability" for automatic instrumentation
- ✅ Kubernetes integration and on-cluster agent (Pixie)
- ✅ Kubernetes cluster explorer views
- ✅ Native OpenTelemetry data support
- ✅ AWS Lambda monitoring via Lambda layer
- ✅ Distributed tracing through serverless functions
- ✅ Instrumentation for multiple serverless platforms
New Relic focuses on simplifying Kubernetes monitoring by instrumenting both applications and the platform in one step, with an emphasis on ease of use rather than raw depth.
Verdict: Cloud-Native
Both platforms are well-suited for cloud-native environments. Datadog may be preferable for organizations that are all-in on infrastructure monitoring at massive scale with fine-tuned control. New Relic fits teams that want to instrument applications running on Kubernetes or serverless with minimal effort. The choice often depends on which platform you're already using and whether you need Datadog's extra cloud-security features.
Pricing: Beware of These Things
The two tools differ fundamentally in pricing shape: Datadog is modular and largely per-host plus per-feature, which can stack up quickly as you add products, while New Relic uses a usage-based model built around data ingest (per GB) and billable users. The cost winner depends heavily on your host count, data volume, and team size.
New Relic
New Relic uses a usage-based pricing model centered on users and data ingest:
- Users: Three tiers of users:
- Full Platform Users (~$99/user/month)
- Core Users (~$49/user/month)
- Basic Users (free)
- Data Ingest: 100GB of free data per month, then pay per GB (~$0.25/GB)
- Entity-based pricing: No per-host or per-CPU charges
- Perpetual free tier: Good for evaluation and small projects
- Pricing Gotchas: User seats can get expensive (Full users), and ingesting huge log volumes beyond the free tier adds up quickly
New Relic's pricing is often more predictable for smaller usage and encourages broad monitoring since you're not penalized per host.
DataDog
DataDog uses a modular, per-product pricing structure:
- Infrastructure Monitoring: ~$15 per host/month
- APM & Continuous Profiler: ~$31 per host/month
- Logs: ~$0.10/GB ingestion + separate retention costs
- RUM: ~$1.50 per 1,000 sessions
- Synthetics: Priced per test run
- Security Products: Add-on pricing (SIEM, workload security, etc.)
- Custom Metrics: Additional charges beyond standard metrics
- Pricing Gotchas: Complex SKU-based pricing makes forecasting difficult; custom metrics can dramatically increase costs; using all components on all hosts gets very expensive
DataDog's granular pricing allows you to pay only for what you use, but requires discipline and careful management to avoid surprises.
Verdict: Pricing
If you want a predictable pricing model with many hosts but moderate data volumes, New Relic might be simpler and possibly cheaper. If you want to pay only for specific features on specific hosts and can limit usage carefully, Datadog can be cost-optimized but requires discipline. Large enterprises that negotiate custom contracts may find either workable, but Datadog is generally perceived as more expensive, while New Relic offers better bang-for-buck upfront but watch for data overages.
OpenTelemetry Support: Not Great in Both Datadog & New Relic
OpenTelemetry is quietly emerging as the open-source standard for collecting all types of telemetry signals. There are numerous benefits to using OpenTelemetry for collecting telemetry data from your applications and host.
Both Datadog's and New Relic's support for OpenTelemetry is not up to the mark, which seems reasonable as their entire product is anchored around their specific agents.
For example, Datadog cannot link traces and logs automatically with the DataDog OpenTelemetry tools. New Relic's documentation is better for using OpenTelemetry, but once the data gets reported, you can see the difference again.
If you are looking to use OpenTelemetry, then I would recommend SigNoz (of course) - an OpenTelemetry-native APM. And just like OpenTelemetry, SigNoz is also open-source. So you can have a full-stack open-source observability stack with SigNoz and OpenTelemetry.
User Experience
DataDog User Experience
DataDog offers a powerful but complex user interface with extensive customization options. The interface provides a lot of flexibility with multiple menus, time scopes, and tag-based filtering on nearly every screen.
Key aspects of the Datadog UI:
- ✅ Extremely detailed dashboards with many visualization options
- ✅ Powerful dashboard layout editor for custom views
- ✅ Deep integration between different data types
- ❌ Can be overwhelming for newcomers with many features in submenus
- ❌ Navigation sometimes feels cluttered with many related features bundled together
- ❌ Steeper learning curve, especially for the query syntax
Advanced users appreciate the granular control, but new users often find the interface challenging until they gain experience.
New Relic User Experience
New Relic underwent a UI redesign in mid-2023, creating a cleaner, more intuitive interface. The platform organizes features in a straightforward way with clear navigation categories.
Key aspects of the New Relic UI:
- ✅ User-friendly interface with guided onboarding
- ✅ NRQL query builder for easy data exploration
- ✅ Both click-driven exploration and deep query options
- ✅ Dark mode with consistent visual design
- ✅ Logical organization of features
- ❌ Fewer customization options than Datadog
- ❌ Some settings can be hard to find initially
New Relic excels at guiding users through setup and exploration, making the platform more approachable, though it might have fewer advanced options than Datadog.
Verdict: New Relic vs DataDog
New Relic wins on overall ease-of-use and intuitive design, especially for new users or smaller teams. Datadog provides a feature-rich interface preferred by power users who invest time to learn it. If you value a clean UI that onboards you smoothly, New Relic has an edge; if you need fine-grained control and don't mind density, Datadog works well once mastered.
Datadog vs New Relic: Final Verdict
You should choose Datadog over New Relic if you are an observability expert and want more granular control over your data. That said, New Relic is not far behind in terms of features offered and can be a good solution for application observability.
Here's a use-case-based guide for Datadog vs New Relic:
-
If you want better correlation between your signals, choose Datadog.
-
If you want comprehensive security monitoring, choose Datadog.
-
If you need deep, customizable infrastructure monitoring, choose Datadog.
-
If you want a simpler pricing model based on usage, choose New Relic.
-
If you prefer quick implementation with minimal learning curve, choose New Relic.
-
If your team is application-centric (developers focused on APM), choose New Relic.
-
If you need a free tier or more cost-effective startup pricing, choose New Relic.
Both platforms are excellent, but they cater to slightly different priorities. Datadog excels in depth and power across infrastructure, security, and customization, while New Relic offers a more unified experience with faster time-to-value, especially for application-centric teams.
In case you're also considering Splunk, you will find our Datadog vs Splunk guide useful as it goes deeper on how Datadog stacks up against another enterprise observability solution.
Issues with Datadog and New Relic
Datadog and New Relic are, of course, popular monitoring tools used by a lot of users worldwide. But they come with their own issues. Here are some issues that users encounter with Datadog and New Relic.
Complex billing practices
Datadog is particularly famous for its complex and unpredictable billing practices. Host-based pricing, charging separately for custom metrics and charging for both log ingestion and indexing are some of the common challenges with Datadog’s pricing.
New Relic charges for user seats, which doesn't make sense for a tool that any developer in the team can need based on what needs troubleshooting.
Cloud Only Both New Relic and Datadog are cloud-only products. That means that to use them, you need to send data outside your infrastructure. If you have strict compliance or data privacy issues, you cannot use these products.
Closed product roadmap For any small feature, you are dependent on their roadmap. We think this is an unnecessary restriction for a product which developers use. A product used by developers should be extendible
What the Community is Saying about New Relic vs DataDog
Reddit users have shared their experiences with Datadog and New Relic, highlighting various issues and insights:
-
Pricing Transparency and Cost Issues: Users often mention the unpredictable billing and high costs associated with both Datadog and New Relic. For instance, a user shared their frustration with Datadog's billing practices, noting a lack of transparency and delayed refunds for overcharges here.
-
Customer Support: Opinions on customer support vary. Some users report positive experiences with Datadog's customer support, finding it responsive and helpful. Others have had less favorable interactions, especially with New Relic, citing slow response times and a lack of proactive support for smaller companies here.
-
Cost Management Strategies: Users discuss various strategies to manage and reduce costs, such as setting up retention filters in Datadog to minimize data ingestion and storage costs. These strategies can lead to significant savings, but they also highlight the complexity and effort required to optimize usage here.
The other alternative can be going for an open-source solution. But the problem with most open-source products is that they are resource-intensive to set up, maintain and scale up. That's where SigNoz comes into the picture. SigNoz is a full-stack open-source APM platform with easy configuration and scalable architecture.
If you're evaluating Datadog against AWS-native tooling, Datadog vs CloudWatch covers that angle. And if New Relic's APM positioning is what you're testing, New Relic vs AppDynamics is a useful read.
Introducing SigNoz - an alternative to Datadog and New Relic
SigNoz is a strong alternative to Datadog and New Relic. It can be used as a drop-in replacement for Datadog and New Relic, providing similar features like APM, distributed tracing, and log management in one tool. SigNoz is built on top of OpenTelemetry and leverages OTel data to its full potential. If you're tired of complex and unpredictable billing practices, or if you want to use OpenTelemetry, then SigNoz is the right choice. Here are some top reasons to choose SigNoz over Datadog or New Relic.
OpenTelemetry Native - No vendor lock-in in your code
SigNoz is built from the ground up to be OpenTelemetry native. This means we fully leverage OTel's semantic conventions, providing deeper, out-of-the-box insights. Unlike Datadog, we don't charge you extra for "custom metrics" when you're using OpenTelemetry. This fundamental difference means you can embrace open standards without the fear of a massive bill.
We've also recently launched features that double down on our OTel-native approach, including:
- Trace Funnels: Intelligently sample and analyze traces to focus on what's important.
- External API Monitoring: Gain visibility into the performance of third-party APIs your application depends on.
- Out-of-the-box Messaging Queue Monitoring: Effortlessly monitor popular queuing systems.
Flexible Hosting Options for Every Stage of Growth
We believe you shouldn't be locked into a single deployment model. SigNoz offers a range of options to meet your needs as you scale:
- SigNoz Cloud: A fully-managed, scalable solution for teams that want to focus on their core business without the overhead of managing an observability platform.
- SigNoz Enterprise: For organizations with strict data residency or privacy requirements, we offer a self-hosted enterprise edition (bring-your-own-cloud or on-premise) with dedicated support and advanced security features.
- SigNoz Community: A self-hosted, open-source version that's perfect for getting started and for teams with the capability to manage their own infrastructure.
Simple, Transparent, Usage-Based Pricing
Our pricing model is designed to be straightforward and predictable. We primarily charge based on the volume of data you send us. It’s as simple as $0.3 per GB of ingested logs, $0.3 per GB of ingested traces, and $0.1 per mil samples.
There are no "weird" pricing levers like per-host charges that force you to alter your architecture, or charges based on user seats which can limit your team’s ability to set up robust observability practices. Our pricing plan is a simple, scalable model that grows with you.
With SigNoz, you get:
- No surprise bills: Our pricing is easy to understand and forecast.
- Cost-effective at scale: As your data volume grows, our pricing remains competitive.
- Freedom to architect your systems as you see fit: We don't penalize you for using modern, dynamic infrastructure.
SigNoz comes with out of box visualization of things like RED metrics.

SigNoz UI showing application overview metrics like RPS, 50th/90th/99th Percentile latencies, and Error Rate
You can also use flamegraphs to visualize spans from your trace data. All of this comes out of the box with SigNoz.

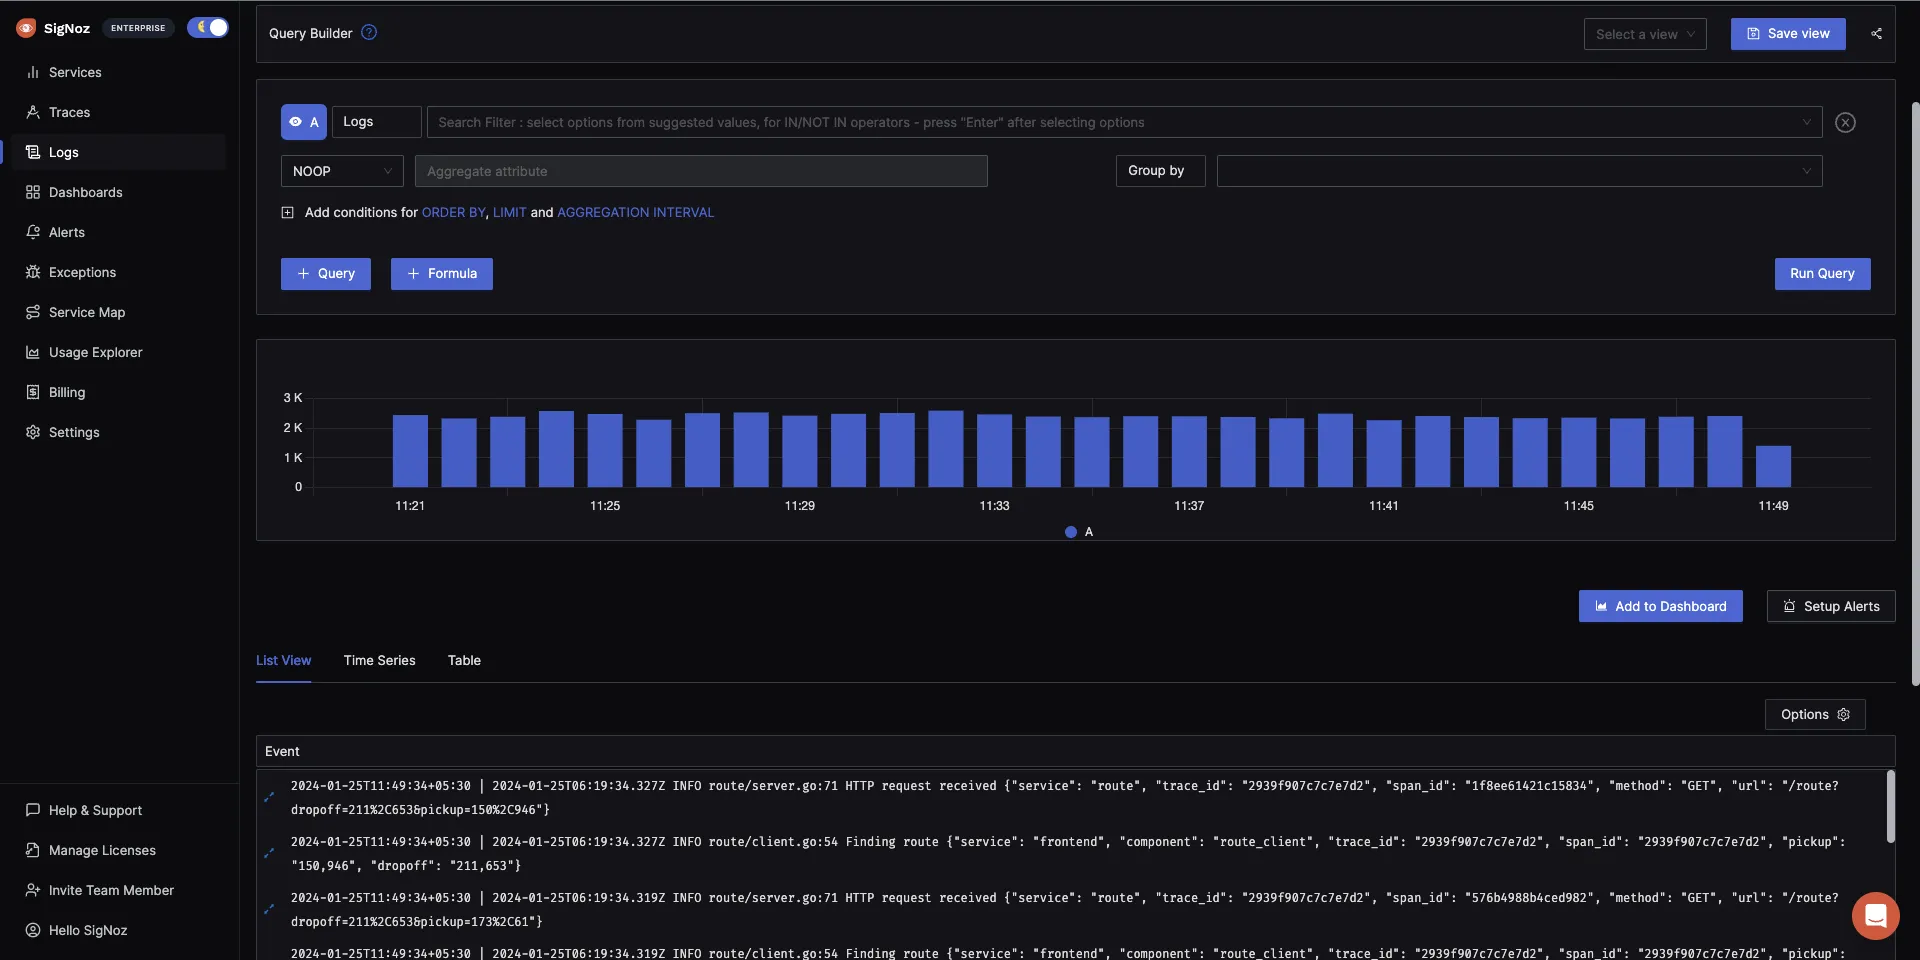
You can use logs to dig deeper into application issues.
You can also build custom metrics dashboard for your infrastructure.
The logs tab in SigNoz has advanced features like a log query builder, search across multiple fields, structured table view, JSON view, etc.
Getting Started with SigNoz
As discussed earlier, you can choose between various deployment options in SigNoz. The easiest way to get started with SigNoz is SigNoz cloud. We offer a 30-day free trial account with access to all features.
Those who have data privacy concerns and can’t send their data outside their infrastructure can sign up for either enterprise self-hosted or BYOC offering.
Those who have the expertise to manage SigNoz themselves or just want to start with a free self-hosted option can use our community edition.
Hope we answered all your questions regarding choosing SigNoz as the Datadog alternative. If you have more questions, feel free to use the SigNoz AI chatbot, or join our slack community.
FAQs
Is Datadog better than New Relic?
The choice between DataDog and New Relic depends on your specific needs. DataDog offers more granular control and better correlation between signals, while New Relic provides a simpler user experience and pricing based on usage.
What is the difference between Grafana vs Datadog vs New Relic?
Grafana is primarily a visualization tool, whereas DataDog and New Relic are comprehensive monitoring solutions. DataDog provides extensive integrations and detailed monitoring capabilities, while New Relic offers an easy-to-use platform with strong real-user monitoring features.
Is New Relic a monitoring tool?
Yes, New Relic is a comprehensive monitoring tool that provides application performance monitoring (APM), infrastructure monitoring, real-user monitoring, and more.
What is better than Datadog?
Depending on your specific requirements, alternatives like New Relic, Splunk, or open-source solutions like SigNoz might be better suited for your needs.
What is the weakness of Datadog?
DataDog's primary weaknesses include its complex pricing model, high costs, and cloud-only deployment, which may not suit all organizations.
Which is better Splunk or Datadog?
Splunk is better for log management and analysis, while DataDog excels in providing comprehensive monitoring and observability solutions. The best choice depends on your specific use case. Alternatively, SigNoz offers a full-stack open-source APM solution that combines the best of both worlds with easy configuration and scalability.
Is New Relic a good tool?
Yes, New Relic is a good tool for monitoring and observability, offering a wide range of features and a user-friendly interface. However, if you're looking for an open-source alternative, consider SigNoz for a cost-effective and scalable solution.
Is New Relic a SIEM tool?
No, New Relic is not a SIEM (Security Information and Event Management) tool. It focuses on application performance monitoring and observability.
Is New Relic a DevOps tool?
Yes, New Relic is used in DevOps for monitoring application performance, infrastructure, and real-user interactions, aiding in continuous delivery and operational efficiency.
Is Datadog a good monitoring tool?
Yes, DataDog is a robust monitoring tool that provides extensive features for application performance, infrastructure, and network monitoring. However, if you're looking for an open-source alternative, consider SigNoz for a cost-effective and scalable solution.
What is the advantage of Datadog?
DataDog's advantages include its granular control over monitoring data, extensive integrations, and comprehensive visibility across various aspects of an application's infrastructure. Additionally, SigNoz offers a similar comprehensive monitoring solution with the benefits of being open-source.
Datadog vs New Relic Cost
Datadog is a more expensive product. It has complex SKU-based pricing, which makes it difficult for engineering teams to use the platform freely. While New Relic provides free access to its entire platform and charges based on usage. But New Relic has user-based pricing - and that can be a significant portion of your entire bill at scale.
Related Content
