Top Pingdom Alternatives (2026) - From Simple Uptime to Full Observability
TL;DR
-
SigNoz combines metrics, traces, and logs into a single platform built on OpenTelemetry. You can self-host it or use their cloud, and pricing is based on what you ingest. A good pick if you need full observability with correlation across all your data.
-
UptimeRobot offers basic uptime monitoring with a free plan that covers 50 monitors. With paid tiers, it checks HTTP, Ping, DNS, and SSL, and sends alerts when keywords (like “Error”) appear or disappear. Good choice if you want simple monitoring without worrying about costs as you grow.
-
Checkly takes a developer-focused approach using Playwright to test both browsers and APIs through code. It includes AI-powered root-cause analysis and integrates with your CI/CD pipeline. Better option if you need more control and want to manage monitoring at scale with infrastructure-as-code.
-
Datadog covers your entire stack with AI anomaly detection, synthetic monitoring, real user monitoring, and over 1,000 integrations. It goes beyond just website checks to connect traces and logs for deeper troubleshooting. However, pricing is unpredictable as you're charged across various products, each with its own pricing metric.
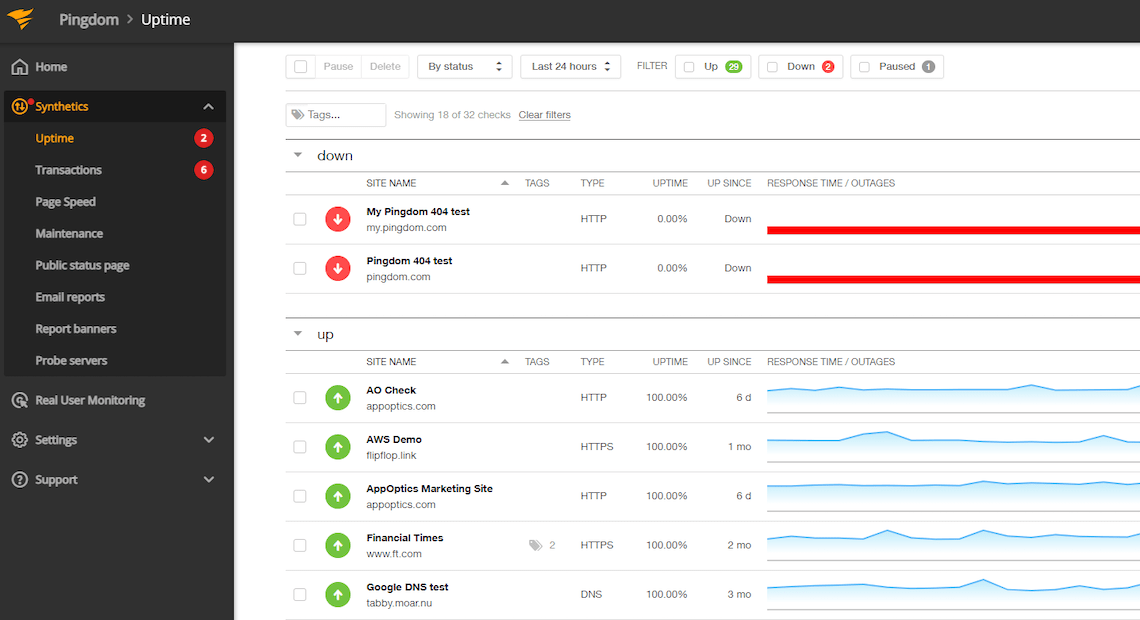
SolarWinds Pingdom has been around for years as a good option for quick monitoring of website uptime and performance. Due to its cloud-based setup, you don't need to manage any infrastructure, just set up checks from over 100 locations worldwide, track how fast your pages load, and test user flows.
Pingdom works fine early on, but friction sets in as you scale your infrastructure and move beyond the basic pricing plans (covering essential uptime monitoring and alerting). Pingdom’s costs can climb quickly when you add features like real user monitoring, increase check volumes across multiple services, or need more customisation.
While the unified dashboard simplifies initial setup, some teams find gaps in proactive anomaly detection, developer-focused workflows, and the ability to self-host without committing to a larger ecosystem (like SolarWind Observability).
This guide examines alternatives that address these challenges. We'll look at deployment options (cloud versus self-hosted), pricing transparency (how costs scale as your needs grow), and monitoring scope (from simple uptime checks to full observability with logs, traces, and metrics).
Category 1: Open Source Pingdom Alternatives
Open-source tools for devs wanting customizable, self-hosted observability beyond Pingdom's scope, allowing them to build their own monitoring stack with correlations for root-cause analysis.
SigNoz
SigNoz is an all-in-one observability platform built on OpenTelemetry that combines metrics, traces, and logs into a single unified dashboard. It's particularly useful for developers working with cloud-native or Kubernetes setups who need integrated visibility across their systems without vendor lock-in.
Key Features
- Effortless Signal Linking (Correlation): Enable one-click navigation to the precise trace or log entry that contextualises the issue, showing whether it's due to network latency, an application error, or an infrastructure anomaly, and eliminating manual tool navigation.
- Fast Queries: Powered by a columnar database, it handles a high volume of data with ease, letting you analyse large datasets in less time.
- OpenTelemetry-native (collector + web SDK): Use the OpenTelemetry Collector for things like HTTP endpoint checks/uptime-style signals, and the OpenTelemetry web SDK to capture frontend page-load telemetry. Once the data is flowing, you can build custom dashboards and alerts around SLAs/SLO-style targets and any custom metrics you emit.
Why consider SigNoz over Pingdom?
SigNoz is a broader observability tool (logs, traces, and metrics), while Pingdom is primarily website monitoring (RUM and synthetics). It also includes alerting, configurable retention (like cold storage in S3 for historical logs), and OpenTelemetry's semantic conventions for easier migrations. Website monitoring in SigNoz typically means a bit of up-front OpenTelemetry setup (collector config for checks, plus frontend instrumentation where needed). It offers a customizable observability stack that pays off when you want control over data, dashboards, alert logic, and cross-signal correlation.
SigNoz offers deployment flexibility, including self-hosting for free (keeping data in-house for compliance) or using managed cloud/BYOC setups. Pricing is transparent and ingest-based, with $0.30/GB for logs and traces and $0.10 per million metric samples, making costs predictable as your workload varies.
Get Started with SigNoz
You can choose between various deployment options in SigNoz. The easiest way to get started with SigNoz is SigNoz Cloud. We offer a 30-day free trial account with access to all features.
Those with data privacy concerns who can’t send their data outside their infrastructure can sign up for either the enterprise self-hosted or BYOC offering.
Those with the expertise to manage SigNoz themselves, or who want to start with a free, self-hosted option, can use our community edition.
Grafana Stack (with Loki, Tempo, and Prometheus)
The Grafana Stack lets you build a monitoring system from modular components: Loki for logs, Tempo for tracing, and Prometheus for metrics, all connected through Grafana's visualisation layer. Teams working with Kubernetes and cloud-native setups often choose it for the flexibility of open-source tools without vendor lock-in.
Key Features
- Efficient Log Storage with Loki: Loki indexes labels (not full log text) and stores compressed chunks in object storage. It can reduce indexing overhead and storage spend for many high-volume log workloads.
- Powerful Metrics with Prometheus: Purpose-built for time-series data, with PromQL queries to track response times, error rates, and resource usage patterns over time.
- Distributed Tracing via Tempo: Connects request traces across services to pinpoint where slowdowns happen in complex microservice architectures.
- Unified Dashboards in Grafana: Build custom views that combine logs, traces, and metrics in one place.
Why consider Grafana Stack over Pingdom?
Grafana Stack’s self-hosting gives you full control over data retention, privacy policies, and infrastructure costs. You can run it on your own servers, in Kubernetes clusters, or use Grafana Cloud for a managed experience. The pricing model is straightforward: the open-source components are free to self-host with no per-check or per-user fees. Grafana Cloud is usage-based: logs and traces are typically priced by data ingested (and log retention), while metrics pricing depends on the number of active series/usage. That means you can model costs based on telemetry volume, retention, and cardinality.
For synthetic monitoring, k6 (also by Grafana Labs) lets you write test scripts in JavaScript that run as part of your CI/CD pipeline, giving you programmatic control over user journey testing. The learning curve is steeper than with point-and-click tools, but you get the payoff of deep customisation, tailored dashboards, cross-signal correlation, and monitoring that scales with your architecture.
Category 2: Simple Uptime Monitoring Tools
These tools focus on basic uptime and performance checks with easy setup and affordable pricing. Good for straightforward monitoring without extra complexity.
UptimeRobot
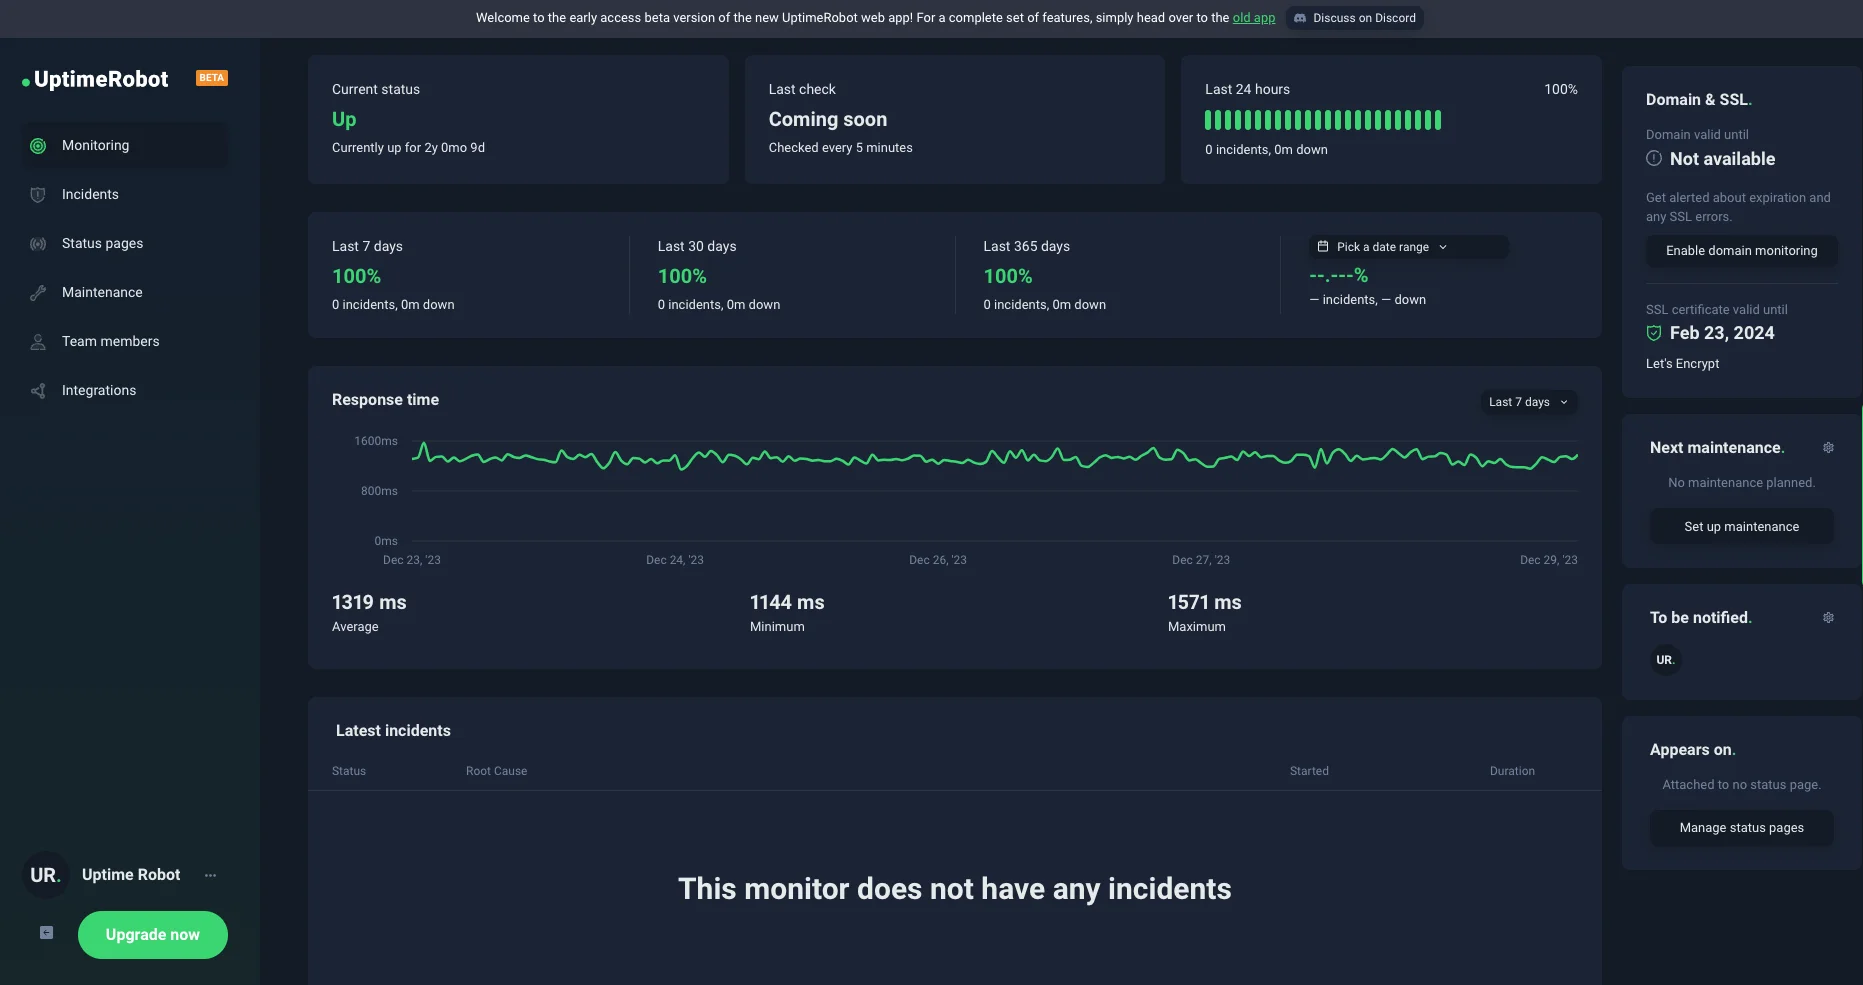
UptimeRobot is the go-to for devs who want hassle-free uptime checks without high costs. If you need straightforward monitoring with maintenance windows and low-noise alerting, this tool delivers exactly that for sites and APIs.
Key Features
- Versatile Monitoring Options: Handles HTTP/HTTPS for web pages, Ping for reachability, DNS lookups, SSL certs (with 30/14/7-day expiration alerts), domain expiration monitoring (alerts before expiration), cron jobs, custom ports, keyword checks in responses (handy for APIs), and response time tracking to spot lags early.
- Status Pages and Team Tools: Branded public status pages with logos/themes, auto-subscriber updates during incidents, and a mobile app for tweaks on the fly.
Why consider UptimeRobot over Pingdom?
UptimeRobot is all cloud-based, like Pingdom, and has different pricing tiers. Its free tier offers up to 50 monitors, including 5-minute monitoring intervals, email alerts, and other basic features. Solo tier starts with $8/month for 60-second intervals, 10-20 free SMS/voice credits, and enhanced status pages. Higher tiers like Team and Enterprise (around $35-65/month) add more credits, advanced integrations, and longer data retention. This differs from Pingdom's model, which starts at $15/month for synthetic monitoring, with tiers based on check counts, features, and add-ons (e.g., separate RUM at an additional $15/month, billed based on pageviews).
UptimeRobot stands out with built-in keyword monitoring (alerts when specific content, such as "Error," appears or disappears), domain expiration alerts, and customizable maintenance windows. It also offers branded public status pages with subscriber notifications, along with a mobile app for on-the-go management. UptimeRobot offers longer data retention (up to 24 months in paid tiers vs. Pingdom's 13 months plan-dependent) and more flexible integrations in higher plans.
Uptime Kuma(Open Source)
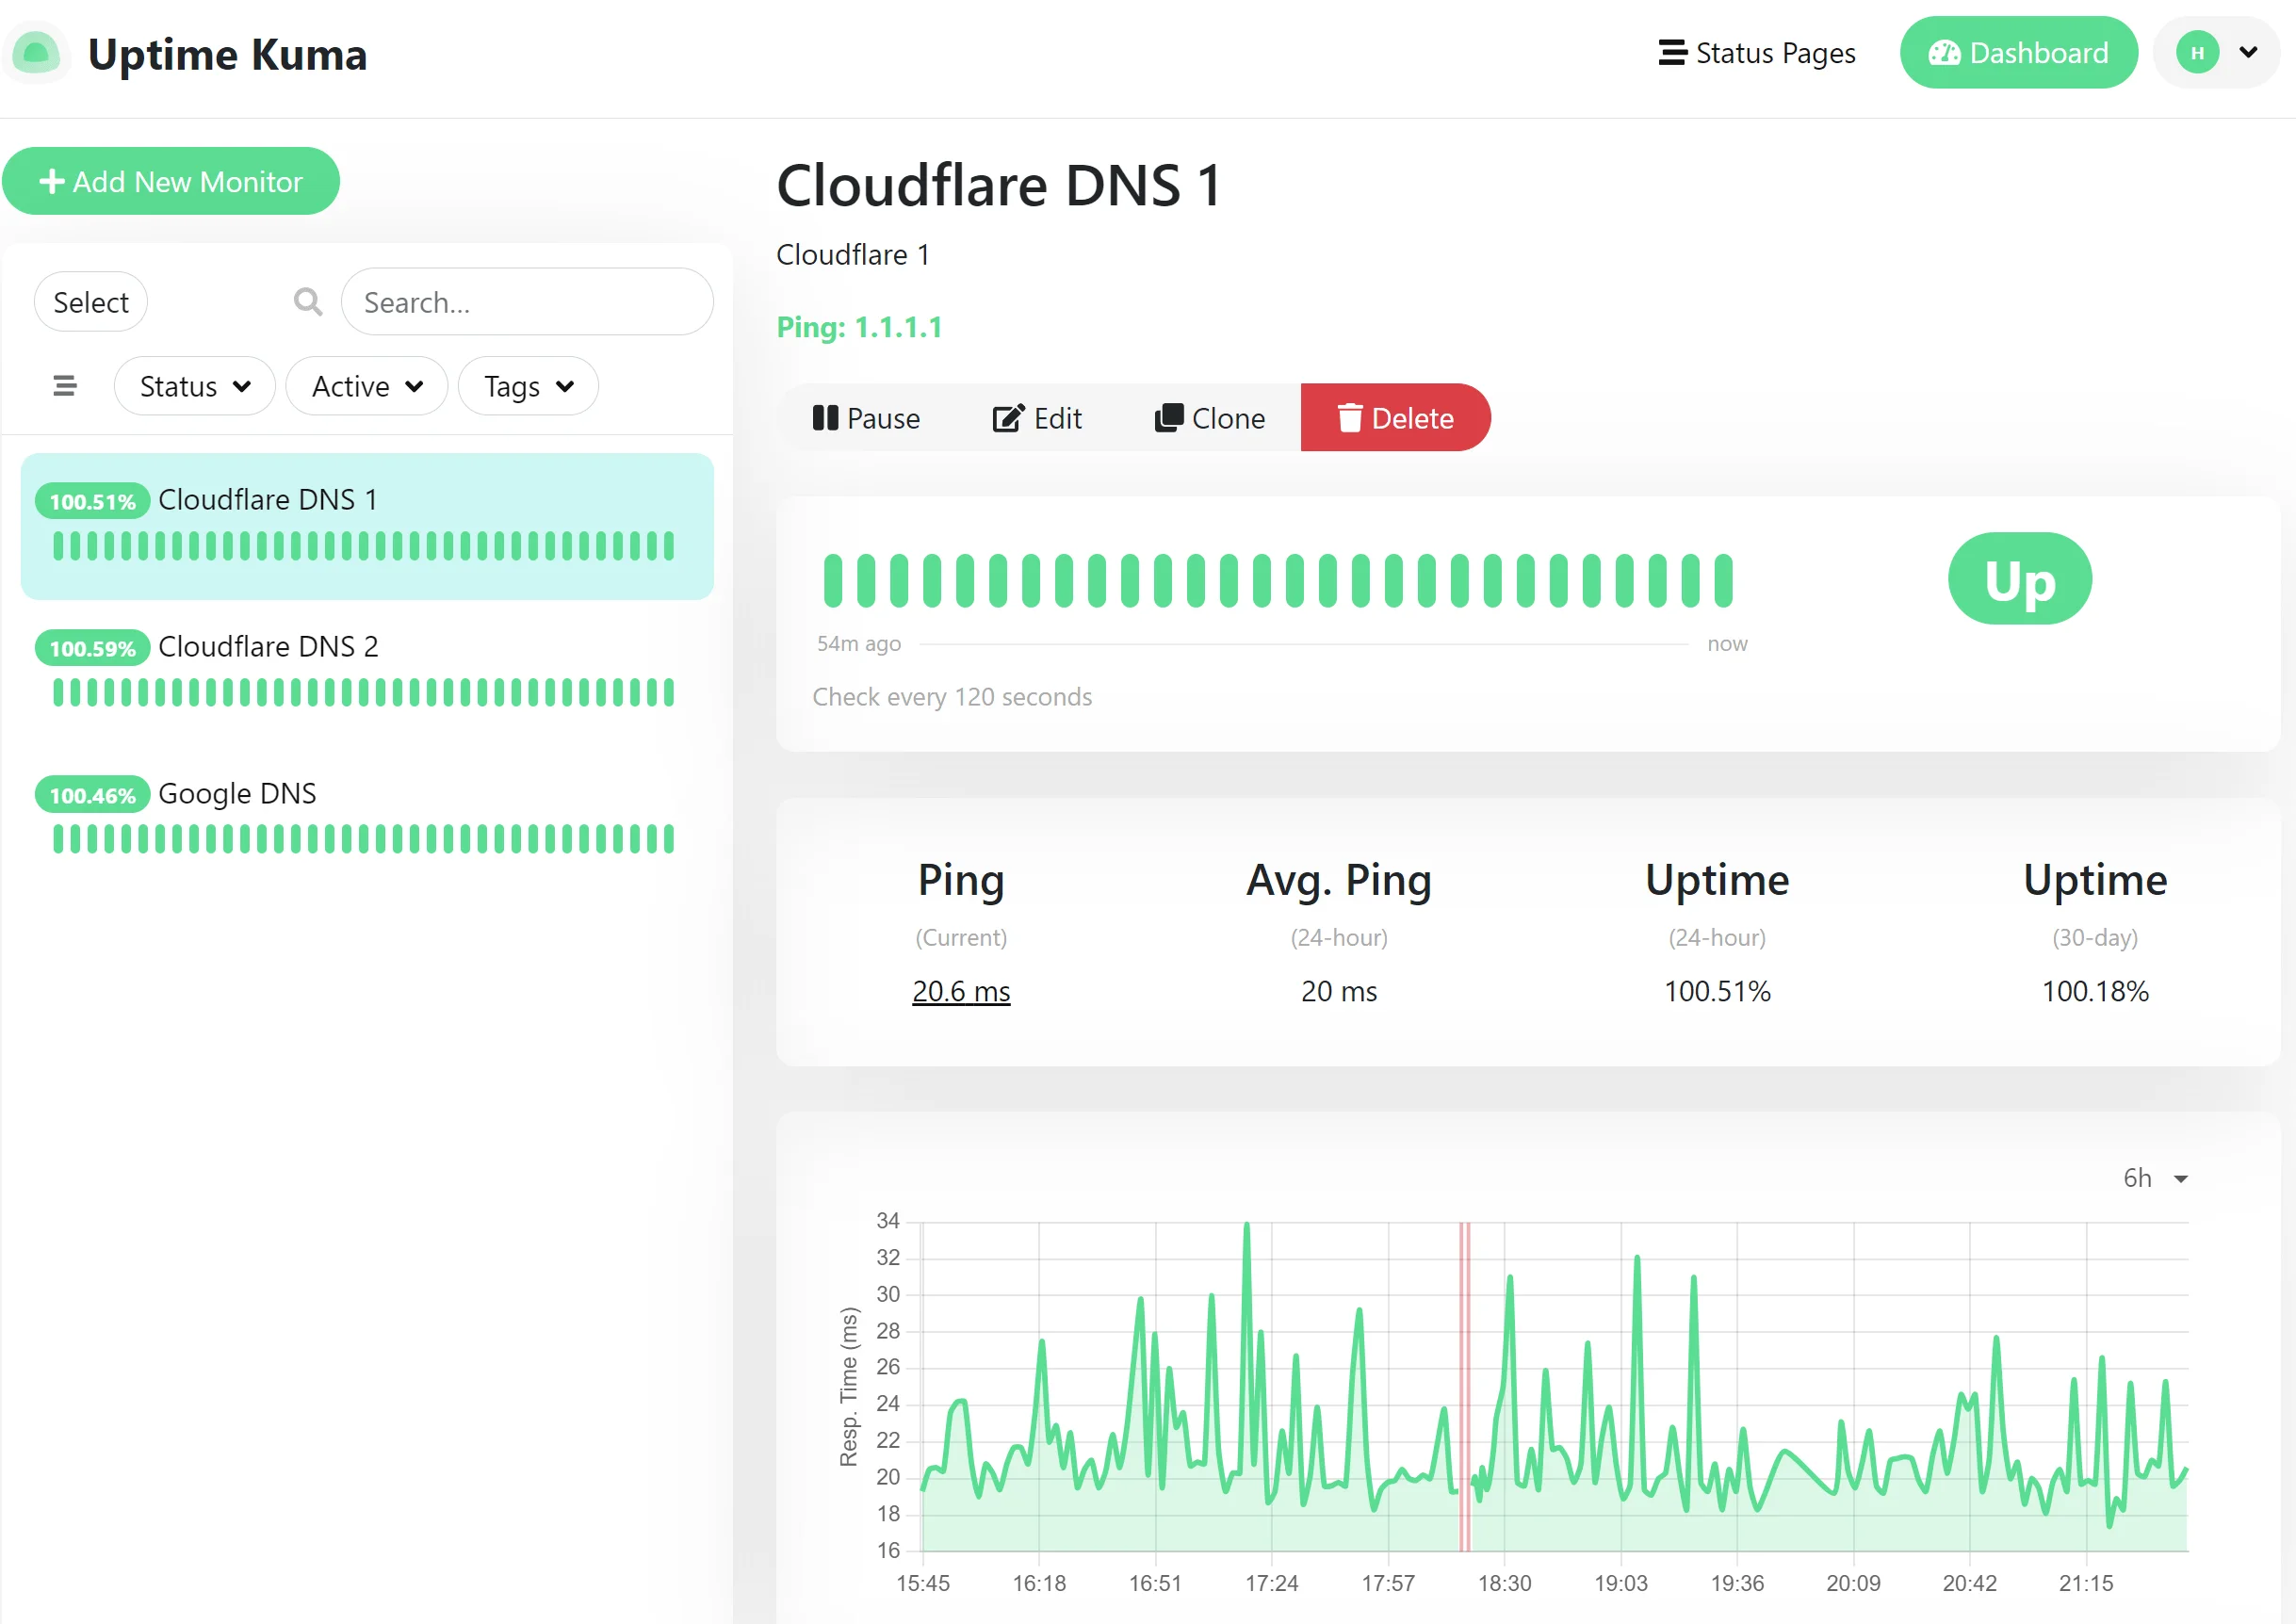
Uptime Kuma is an open-source, lightweight, self-hosted tool preferred for running your own infrastructure(Docker containers or a VPS). Built for straightforward uptime monitoring without vendor lock-in, it scales from personal projects to internal services.
Key Features
- Flexible monitoring options: Supports HTTP checks, ping tests, keyword monitoring (to detect when specific content disappears), and SSL certificate tracking(so you can catch expiring certificates before they cause outages).
- Clean, customizable interface: Build dashboards that group monitors by project, add status pages for public visibility, and organise checks without wrestling with complex configurations.
Why consider Uptime Kuma over Pingdom?
Uptime Kuma is a fully self-hosted, open-source option that gives you complete control over your monitoring setup. You can run it on your own servers without depending on any vendor's cloud infrastructure. It's 100% free, your only costs are whatever you pay for hosting (like a basic VPS at $5–10/month).
Features include HTTP/HTTPS checks, keyword monitoring, and notifications across multiple channels. The main trade-off is that you'll need to handle your own setup for multi-location checks, and it doesn't include built-in real user monitoring (RUM) or advanced performance analytics out of the box. But if your priority is straightforward availability monitoring without vendor lock-in or recurring fees, it's a decent choice, better for teams that already run self-hosted infrastructure or want to integrate with other observability tools they control.
Category 3: Monitoring with Built-in Incident Management
These tools provide both monitoring (tracking system health and performance) and incident management (alerts, escalations, and on-call scheduling). Good for teams that want alerts, escalations, and troubleshooting in one place, rather than juggling multiple tools.
Checkly
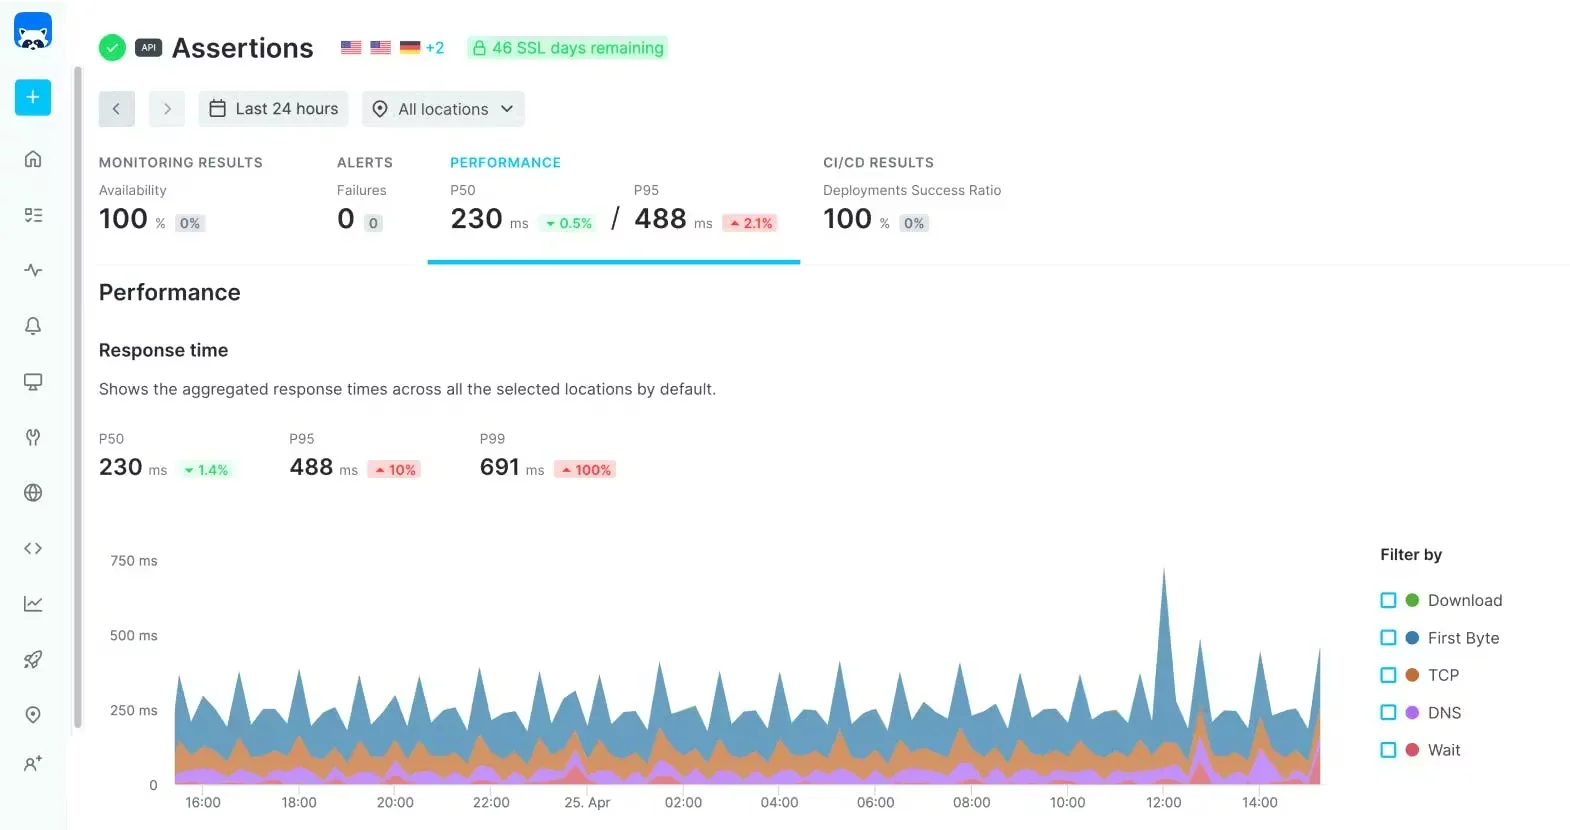
Checkly empowers you to manage code-first (with optional UI) monitoring, leveraging Playwright for authentic browser-based tests, making it a good fit for teams handling microservices or CI/CD pipelines where traditional point-and-click interfaces fall short.
Key Features
- Code-Driven Synthetics: Script uptime, API, or browser checks in JavaScript/TypeScript with Playwright, including assertions, screenshots, and videos for debugging complex flows like logins or checkouts.
- AI and Retries: Checkly provides an AI agent called "Rocky AI," built to help engineering teams diagnose and resolve issues across distributed systems. Rocky AI analyses Checkly Traces to surface critical information about failures, eliminating the need to manually go through logs and traces.
Why consider Checkly over Pingdom
For deployment flexibility, Checkly supports infrastructure-as-code via the CLI or Terraform, as well as private agents for monitoring apps behind firewalls. It covers synthetics and uptime across 20+ locations while adding programmable depth and AI-powered root-cause analysis. It requires coding knowledge, but that empowers developers to iterate faster without being constrained by dashboard-only interfaces.
Checkly offers a free plan called Hobby that provides uptime monitoring for up to 10 monitors, with additional features such as browser & API checks, SSL monitoring, alerts, and more. Paid plans are categorised into different bundles like starter ($29) and team ($80), offering additional credits (e.g., more browser & API checks per month, more monitors, etc.) and additional features such as automatic retries, visual regression testing, and more. This bundled usage model differs from Pingdom's tiered approach, starting at $15/month for synthetics (scaling by checks) and separate RUM, making Checkly more predictable for growing check volumes.
Better Stack
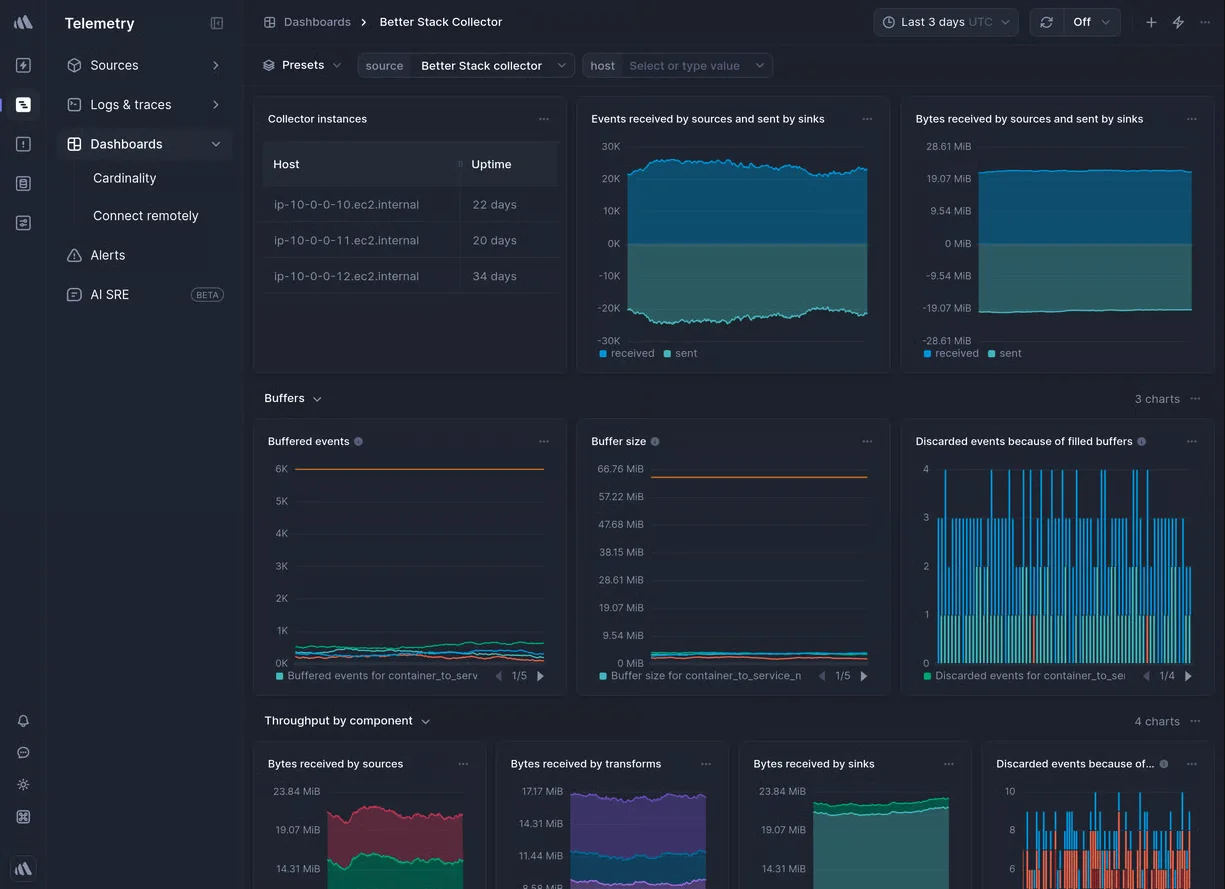
Better Stack is a developer-oriented alternative that bundles uptime monitoring and incident management/on-call into a single platform.
Key Features
- Fast uptime & browser synthetics: Checks run as fast as 30 seconds, with error screenshots and Traceroute/MTR for debugging. For user-flows (login/checkout), it supports Playwright transaction checks that run in a real Chrome browser instance.
- SQL for data diving: Query logs/spans/metrics with SQL (alongside other query modes like PromQL/drag-and-drop), and mark low-value events as “spam” so you don’t get billed for them.
- Incident & on-call built-in: Includes on-call schedules/rotations andescalation policies, smart incident merging, and AI post-mortems.
Why consider Better Stack over Pingdom
Pingdom is good for basic website monitoring like global uptime monitoring from 100+ locations, synthetic checks, and RUM, starting at $15/month per feature with per-check scaling (including caps like 50 SMS alerts), but Better Stack takes things further by integrating incident management directly adding capabilities like escalations chains via SMS and Slack that Pingdom handles through third-party integrations like PagerDuty.
On pricing, Better Stack offers a free tier with 10 monitors, 3 GB of logs (retained for 3 days), and basic alerts. Paid telemetry is per-GB ingestion ($0.15/GB for logs/traces) and retention ($0.08/GB/month), with bundles starting at $25/month for higher volumes. This usage-based model offers predictability for variable data and can be more cost-effective than Pingdom's feature-specific add-ons, especially with options like hosting data in your own S3-compatible bucket for compliance.
Category 4: Full-Stack and Advanced SaaS Platforms
Advanced SaaS platforms that go beyond Pingdom's web monitoring with AI capabilities and integrations, suitable for developers scaling to enterprise needs.
Datadog
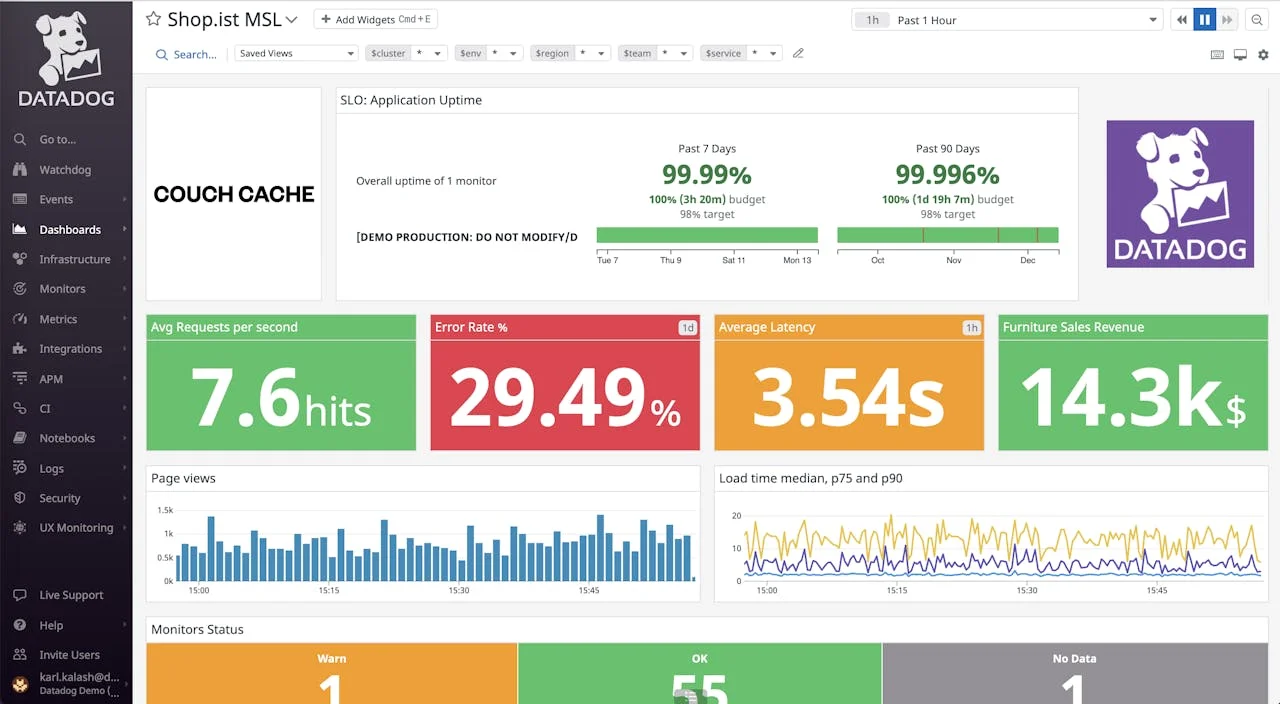
Datadog brings everything together in a cloud-based platform that's easy for devs juggling apps, infrastructure, and user experiences. It delivers comprehensive monitoring with AI-powered insights that detect, troubleshoot, and resolve via Watchdog, all without hosting the monitoring backend yourself (SaaS).
Key Features
- Synthetics and RUM: Simulate user journeys like logins from global locations, while capturing real-user data on load times, errors, and performance breakdowns by browser or device (easy to filter and act on).
- AI-Powered Insights: Automatically detects anomalies in performance or downtime, linking them directly to traces, logs, or metrics to speed up troubleshooting.
- Extensive Integrations: Connects to 1,000+ integrations (Slack, AWS, Kubernetes) with custom dashboards that combine monitoring data across your entire stack for a unified view.
Why consider Datadog over Pingdom
Datadog is SaaS-only and has no self-hosting option, which keeps setup simple but means you're committed to their cloud infrastructure. Datadog excels at full-stack observability by integrating uptime monitoring, distributed tracing, and log analytics in a single place. The AI capabilities reduce manual alert triage and root-cause analysis.
Datadog’s pricing is multi-dimensional and often unpredictable, with separate charges across offerings. For example - synthetic monitoring starts at $5 per 10,000 API test runs or $12 per 1,000 browser test runs (annual billing), RUM at $0.15 per 1,000 sessions and APM at $31 per host. This can lead to cost surprises from usage spikes, per-host billing (e.g., container traps), or custom metric overages, unlike Pingdom's simpler tiers, which start at $15/month for synthetics and another $15 for RUM.
New Relic
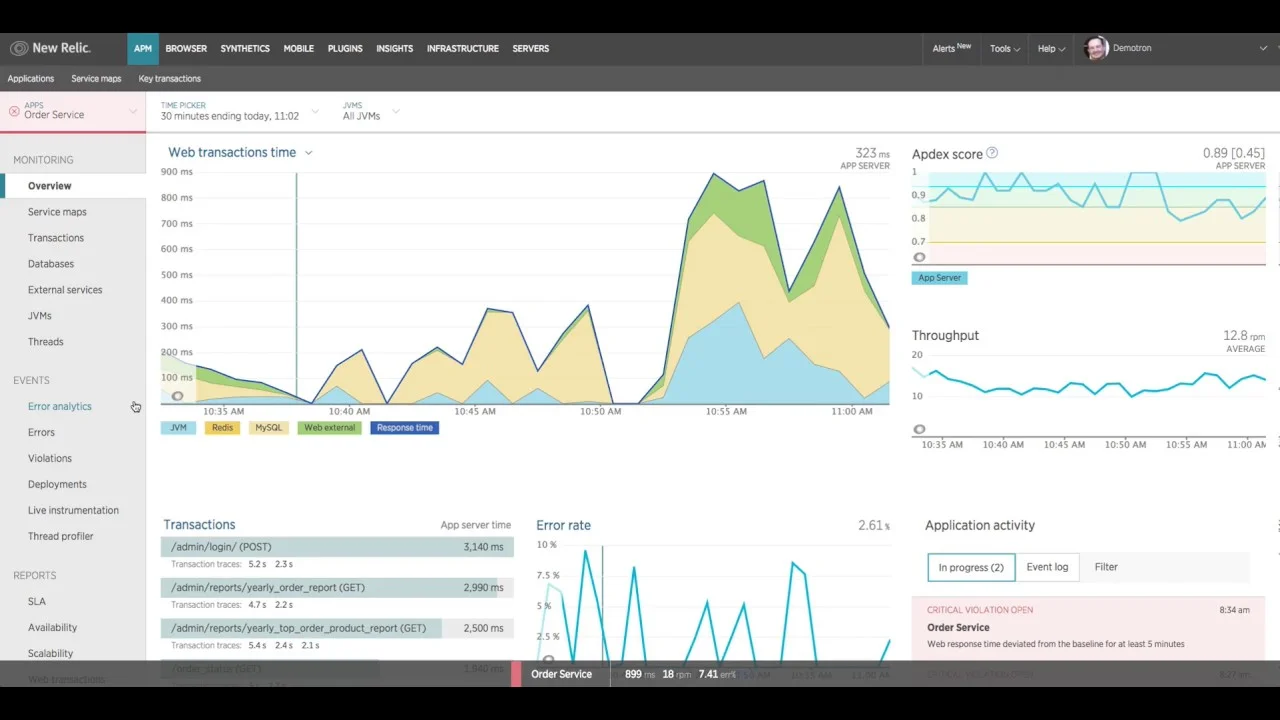
New Relic offers a flexible, pay-as-you-go monitoring approach that links site performance to business results (showing how page load times affect conversion rates or how errors impact revenue). It provides deep visibility into your code and user experience without switching between multiple tools.
Key Features
- Synthetics and Mobile Monitoring: Simulate user journeys (e.g., checkout flows or login sequences) from locations worldwide, with scripted browser monitors that provide step-by-step results, screenshots, and waterfall charts to spot bottlenecks, and AI-powered alerts for unusual patterns.
- Business-Aligned Metrics: Connect technical metrics (response times, error rates) to business impact like revenue loss or user drop-offs, going beyond basic uptime tracking.
Why consider New Relic over Pingdom?
For deployment flexibility, it's SaaS-only like Pingdom, but scales effortlessly in the cloud without on-prem requirements. New Relic offers a free tier with 100 GB/month of data ingest, then charges $0.40/GB for standard data or $0.60/GB for enhanced features like extended retention.
Synthetic monitoring includes check limits by edition (e.g., 500 in free, 10k in Standard, up to 10M in Enterprise), with overages at $0.005 per additional non-ping monitor (ping monitors included at no extra cost). RUM is billed as part of the ingest volume, without separate per-session fees. This model differs from Pingdom's, making New Relic more adaptable and potentially cheaper for basic use via the free ingest tier, but more variable at higher traffic/telemetry levels. Costs for other New Relic products, such as APM or logs, are included in the same ingest-based billing, providing flexibility for integrated use without multi-feature add-ons.
In feature breadth, it aligns with Pingdom's RUM (browser/device/geo breakdowns) and synthetics (journeys like checkouts), but adds mobile support, code profiling, and AI incident grouping/suggestions, filling Pingdom's root-cause gaps (beyond response codes/traceroutes) with full-stack APM/logs/serverless.
Site24x7
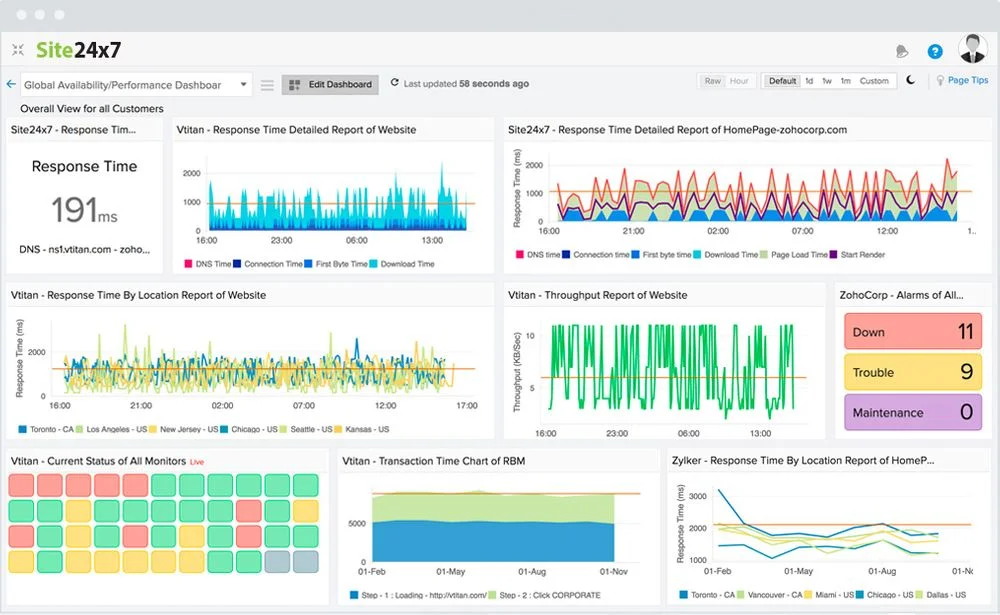
Site24x7, from Zoho, is an AI-powered all-in-one observability platform that combines website monitoring with IT operations. It offers monitoring probes from 130+ global locations, real-browser synthetic simulations for user journeys, and AI-driven anomaly detection to catch unusual patterns early.
Key Features
- Website and Synthetic Monitoring: Checks HTTPS, DNS, APIs, SSL, and more from 130+ locations (including private ones) and records multi-step user flows, such as logins or checkout processes, to catch issues before users do.
- Real User Monitoring (RUM): Tracks actual visitor experiences by browser, device, location, and ISP. Lets you set custom performance targets and identify bounce patterns.
- AIOps and Integrations: Machine learning spots anomalies in response times or availability, connects with APM tools (Java, .NET, and others), logs, networks, and cloud platforms like AWS and Kubernetes, and integrates with status pages and third-party plugins.
Why consider Site24x7 over Pingdom?
Site24x7 goes beyond basic uptime monitoring. While it covers the essential 100+ location checks, synthetic user-journey monitoring, and RUM with geographic and browser breakdowns, Site24x7 adds AI-based anomaly detection. Compared to Pingdom, Site24x7 bundles broader infra coverage (network/server/cloud/K8S) into its platform, whereas with Pingdom, you typically pair it with SolarWinds Observability/APM for backend infrastructure visibility.
For deployment, Site24x7 is primarily SaaS, but it also supports on-premises probes for monitoring private infrastructure, giving you more flexibility than cloud-only alternatives. Pricing starts around $9/month (annual billing) with bundled quotas and optional add-ons as you scale. Also note that Pingdom retains RUM/visitor insights for ~13 months (plan-dependent), while Site24x7’s detailed RUM datasets vary by data type and plan.
Summary: Top 9 Pingdom Alternatives
| Tool | Core Focus | Key Advantages Over Pingdom |
|---|---|---|
| UptimeRobot | Budget Uptime: Hassle-free checks for sites/APIs with low-noise alerting. | Free 50-monitor tier without per-check costs, adding keyword/expiration checks and status pages for versatile basics. |
| Uptime Kuma | Self-Hosted Simplicity: Open-source for internal/custom monitoring without lock-in. | 100% free self-hosting with flexible HTTP/keyword checks, prioritizing control and privacy over cloud dependency. |
| Checkly | Dev-First Coding: Code-driven synthetics for CI/CD workflows. | Programmable depth with Playwright and AI analysis, supporting IaC/CLI for faster iterations vs. UI-only interfaces. |
| Better Stack | Uptime + Incidents: Integrated monitoring with on-call and SQL querying. | Built-in escalations and free tier (3GB/month), adding AI post-mortems and spam filtering for streamlined handling. |
| Datadog | Enterprise Full-Stack: AI insights across infra and apps. | Anomaly detection with synthetics/RUM and 1,000+ integrations, linking to traces/logs for quicker troubleshooting. |
| New Relic | Usage-Based Flexibility: A PM linking performance to business KPIs. | Free ingest tier (100GB/month) and code profiling, adding mobile/synthetics with AI suggestions for business context. |
| Site24x7 | Hybrid All-in-One: AI-enhanced for cloud/IT ops. | AIOps from 130+ locations with on-prem probes, bundling RUM/anomalies at $9/month for broader coverage. |
| SigNoz | Unified OTel Observability: OpenTelemetry-native for traces/metrics/logs. | Signal correlations with self-host/cloud options and ingest pricing ($0.30/GB), enabling custom dashboards/SLAs. |
| Grafana Stack | Modular OSS Ecosystem: Community-driven for Kubernetes setups. | Free self-hosting with k6 synthetics and PromQL metrics, offering customizable views beyond fixed dashboards. |
Hope we answered all your questions regarding Pingdom alternatives. If you have more questions, feel free to use the SigNoz AI chatbot or join our Slack community. You can also subscribe to our newsletter for insights from observability nerds at SigNoz, and get open-source, OpenTelemetry, and devtool-building stories straight to your inbox.
