Splunk vs Prometheus - In-depth Comparison for 2026
Splunk and Prometheus are popular monitoring tools used today by businesses and companies for monitoring data. Splunk is an enterprise monitoring tool that specializes in searching, monitoring, and analyzing machine-generated big data, while Prometheus is primarily for metrics monitoring. In this article, we will compare Splunk and Prometheus against their key features.
Splunk is a powerful software platform used to search, analyze, and visualize machine-generated data and logs through a web interface in real-time. Beyond its core functionality in log analysis, Splunk offers a wide array of capabilities and features, including the monitoring of telemetry data, application performance monitoring (APM), application security, incident response, and more. This positions Splunk as a versatile solution for organizations seeking to delve deeply into the insights provided by their systems and applications.
On the other hand, Prometheus is an open-source monitoring tool primarily used for monitoring metrics data. It collects and stores metrics as time-series data (metrics that change over time). Additionally, Prometheus includes robust alerting capabilities, allowing for proactive monitoring and quick response to potential issues.
Monitoring is essential for maintaining the health and reliability of your applications and systems. Both Splunk and Prometheus are capable of monitoring, but both have different features and use cases.
Splunk vs Prometheus: Overview
Here’s a quick overview of the overall platform features and functionality of Splunk and Prometheus.
| Features | Splunk | Prometheus |
|---|---|---|
| Getting Started | 🟡 | ✅ |
| Metrics Monitoring | ✅ | ✅ |
| Log management | ✅ | ❌ |
| Cloud SIEM | ✅ | ❌ |
| Application Security | ✅ | ❌ |
| Alerting | ✅ | 🟡 |
| Visualization capabilities | ✅ | 🟡 |
| UI/UX | 🟡 | 🟡 |
| Free Tier | 🟡 | ✅ |
✅ - Available
❌ - Not Available
🟡 - Limited
Key features of Splunk
Some of the key features of Splunk are:
-
Security
Splunk offers real-time monitoring and analysis of security events to detect and respond to threats effectively.
-
Observability
Splunk provides 360 visibility into your environment. It predicts and detects problems before customer impact and helps with the troubleshooting process.
-
Incident management
Splunk uses advanced analytics like anomaly detection and adaptive thresholding to predict and prevent issues before they impact performance.
-
Query language
Splunk uses a powerful query language called the Splunk "Search Processing Language” (SPL), a rich, expressive language for searching, filtering, and aggregating data machine data.
-
Search and analysis
Splunk has a powerful search engine designed to handle and analyze large volumes of data efficiently. It allows users to search, analyze, and get insights from massive datasets collected from various sources in real-time, using SPL.
Key features of Prometheus
Some of the key features of Prometheus are:
-
Multi-dimensional data model
It stores data as time series (data that is tracked at an increment in time). You can also store an optional set of key-value pairs called labels for those metrics. The multi-dimensional data model enables rich contextual metrics monitoring.
-
Query language
Prometheus uses a query language called “Prom QL” to query the metrics data collected.
-
Pull model data collection over HTTP
Data collection for Prometheus is pull-based. It pulls metrics from an application and exposes them in a format it understands on an HTTP endpoint.
-
Alerting
Prometheus uses Alert manager to create alerts on metrics. The alert manager also provides capabilities to group alerts in a single notification.
-
Visualization and dashboard
Prometheus comes with a basic visualization layer and doesn’t allow for the creation of dashboards.
Getting Started: Splunk vs Prometheus
Splunk provides a cloud version, a fully managed service that doesn't require any installation. It comes with a 14-day free trial.
Additionally, Splunk provides an Enterprise version designed for deployment on-premises or within a private cloud. This version is beneficial for organizations seeking complete control over their data and infrastructure. It comes with a 60-day free trial.
Prometheus doesn’t offer a cloud version. It needs to be installed and maintained. If you require a managed version of Prometheus, it has managed services like the Amazon Managed Service for Prometheus, Google Cloud Managed Service for Prometheus and more that are managed by the providers.
Metrics monitoring: Splunk vs Prometheus
Metrics monitoring provides insights into system performance, resource utilization, and application behavior. Both Splunk and Prometheus offer robust solutions for metrics monitoring, but they differ significantly in their approaches. Here is how both tools carry out metrics monitoring:
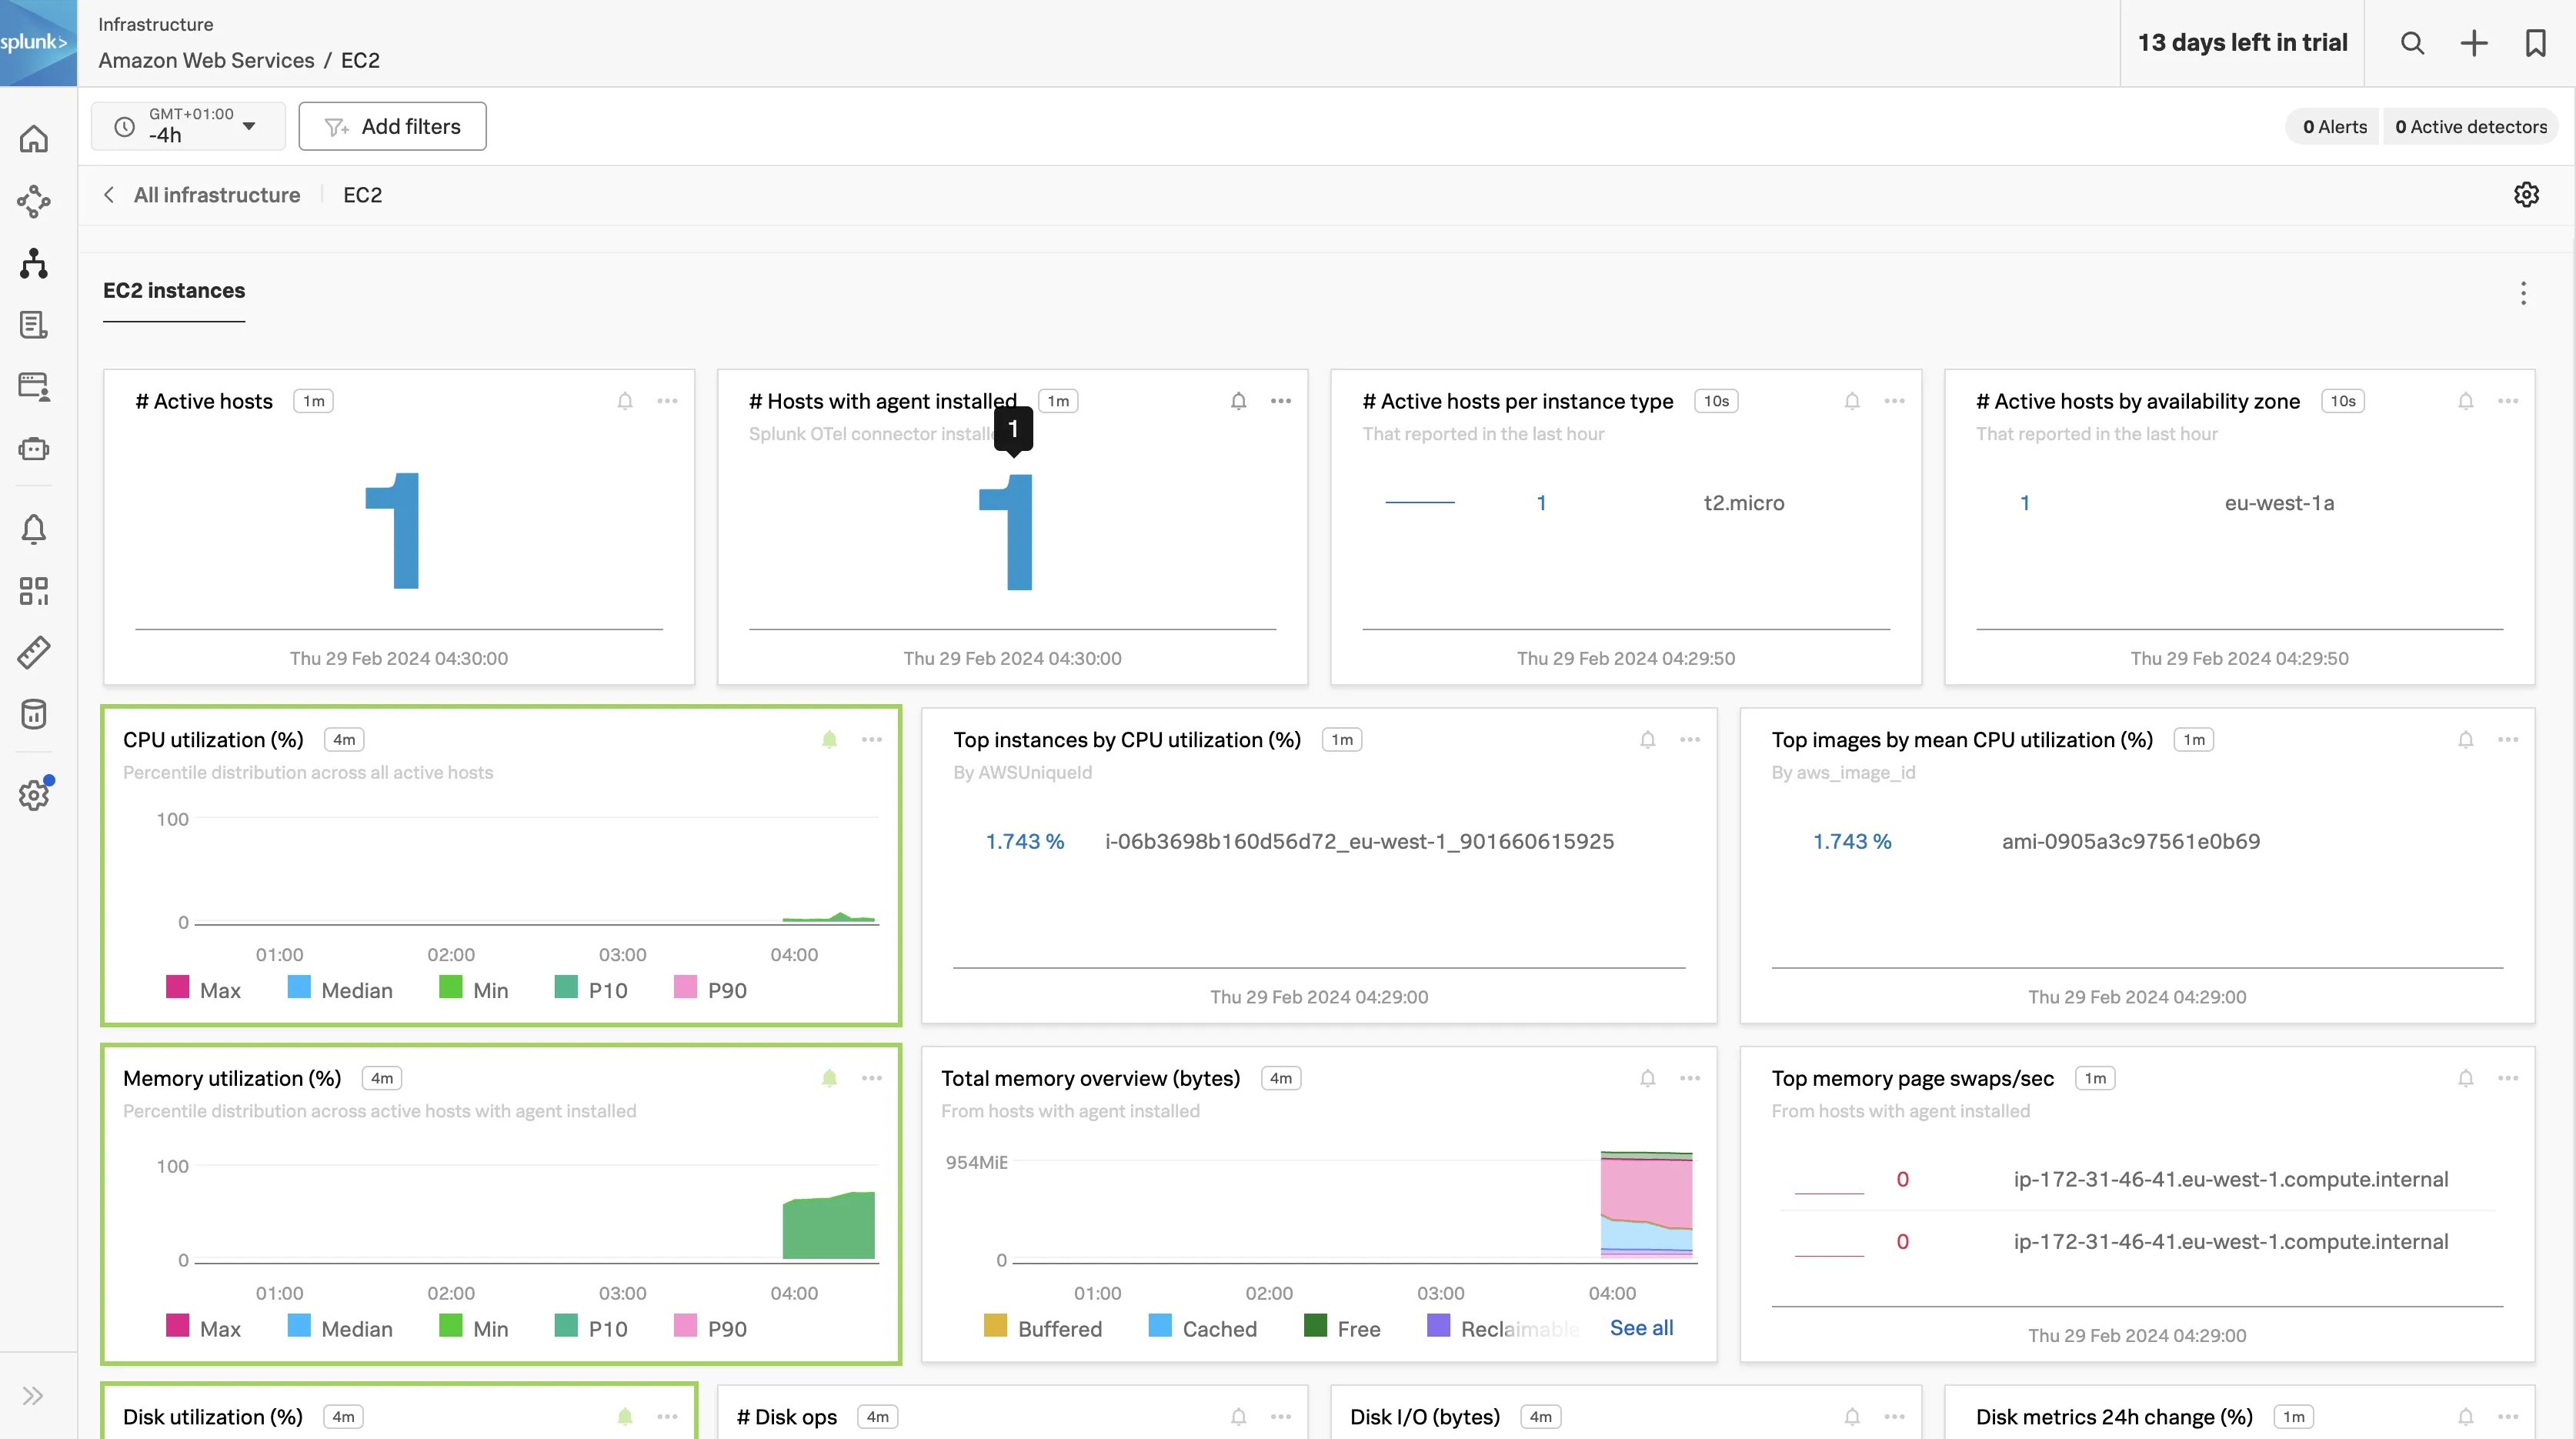
Splunk
Metrics monitoring in Splunk involves a comprehensive process that starts with the collection of metrics data from various sources.
Other than ingesting metrics data, Splunk can automatically convert ingested log data into metrics and insert it into a specified metrics index.
Once the metrics data is ingested, it is indexed and stored in Splunk's proprietary index format, for fast and efficient retrieval of metrics data during query and analysis.
The metrics are then monitored in real-time using different visualizations. Dashboards can be utilized for this as the Splunk Observability Cloud platform comes with out-of-the-box dashboards. Custom dashboards can also be created to monitor custom or other specific metrics and alerts can be set up on the metrics.
Another way to monitor metrics in Splunk is through the use of the Analytics Workspace. The Analytics Workspace provides a user interface that allows for monitoring and analysis of metrics and other time series without using SPL. It allows users to easily understand trends and patterns in their metrics data.
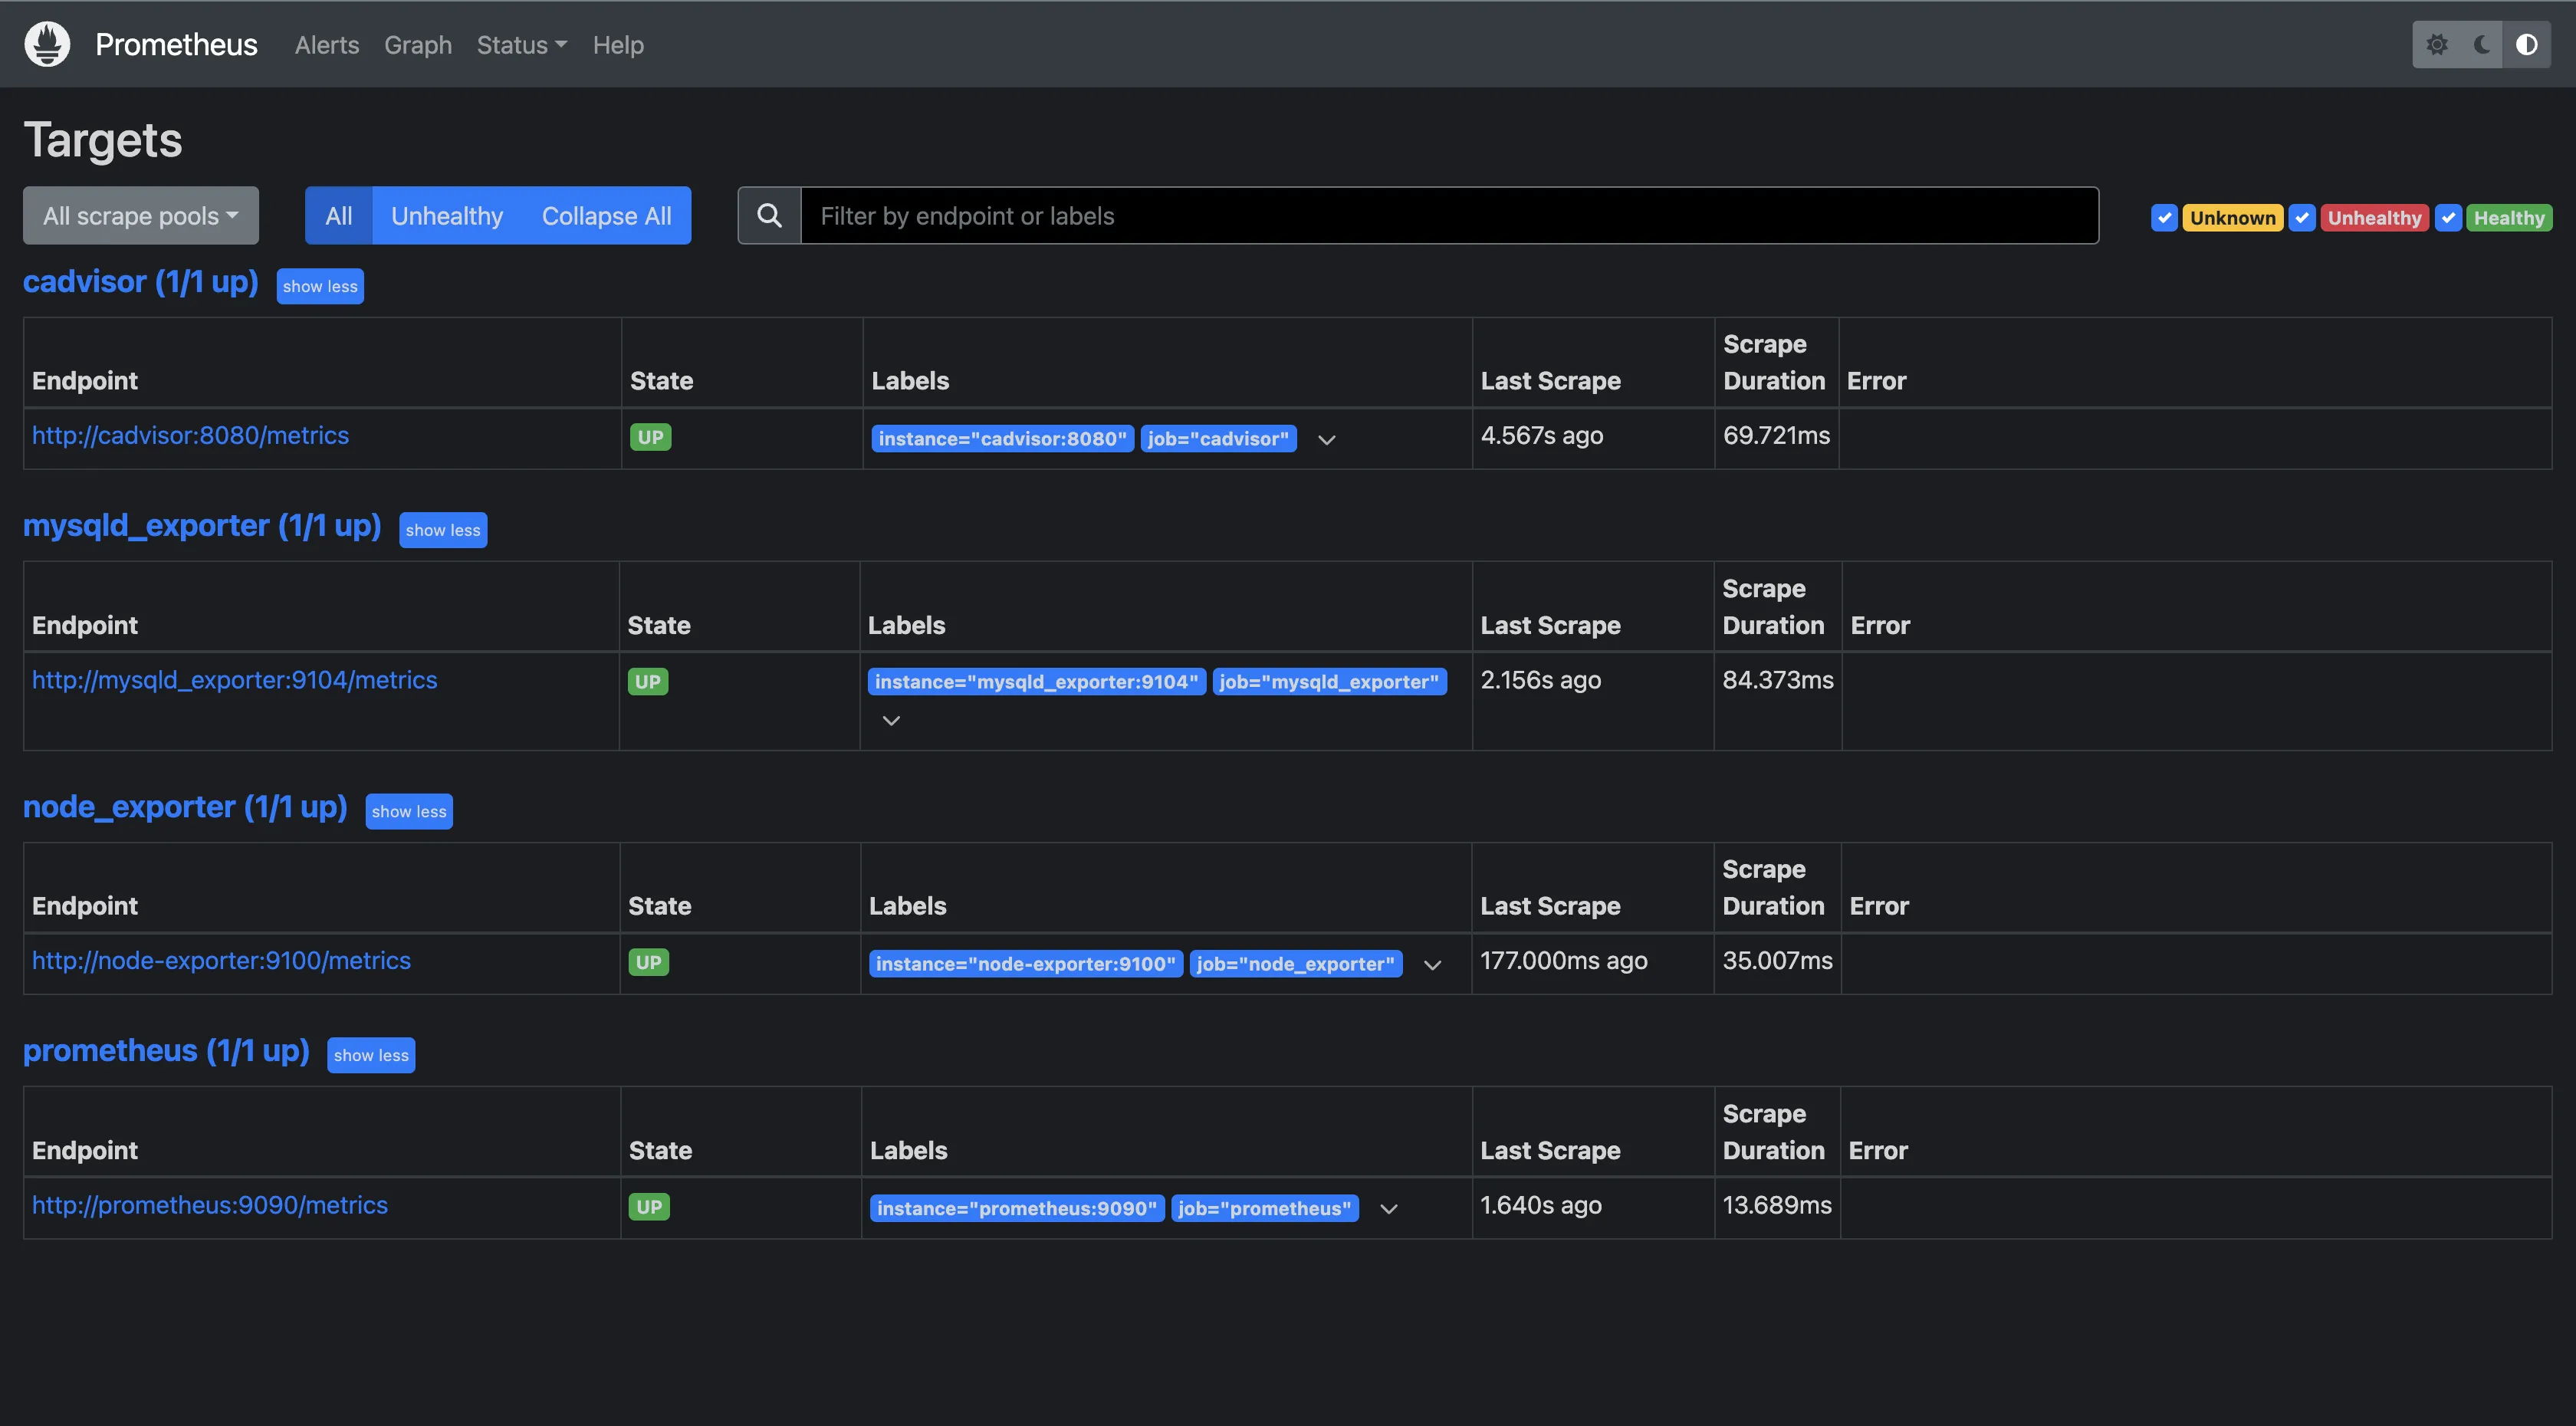
Prometheus
Prometheus is specifically designed for monitoring and alerting on metrics. Metrics monitoring in Prometheus starts with the collection of metric data from different data sources, by scraping metrics from HTTP endpoints exposed by monitored services at regular intervals. Once collected, Prometheus stores the metrics in a local database optimized for time-series data.
This storage method allows for efficient querying and analysis of the metrics. These metrics can be queried using PromQL, a powerful query language, to analyze the collected metrics. Users can write queries to create temporary time series from the source data, allowing for real-time aggregation and analysis. Alerts can then be set on these metrics for proactiveness in resolving issues before they escalate.
The downside of metrics monitoring in Prometheus is its basic visualization, the expression browser, which doesn’t provide enough information to understand your metrics data. For better metrics visualization, users would have to send the metrics from Prometheus to a different visualization platform, like Grafana. Prometheus is usually used in combination with Grafana for visualization.
An alternative to Splunk and Prometheus - SigNoz
While Splunk does offer good metrics monitoring capabilities, it's often not the first choice for organizations specifically looking for metric monitoring solutions, because of the costs that come with it. Splunk is more suited for enterprises and large-scale businesses, hence its robust features.
Prometheus, in contrast, is open-source and doesn’t require any license to install and use but you need to maintain it yourself which will require engineering bandwidth. However, its scope is limited to metrics alone. For a holistic understanding of your systems, metrics alone are insufficient. Logs and traces are equally crucial for comprehensive observability and monitoring of services and infrastructure. In such cases, it is best to consider an alternative tool like SigNoz.
SigNoz is an open-source, full-stack Application Performance Monitoring (APM) and observability tool that serves as a great alternative to both Splunk and Prometheus. SigNoz being an OpenTelemetry native tool provides you with metrics, logs, and traces to get a comprehensive view of your systems. OpenTelemetry is rapidly becoming the global standard for generating and managing telemetry data (Logs, metrics, and traces).
Regarding cost, SigNoz is highly cost-effective. It is available both as an open-source software and a cloud offering. The could offering has a simple and transparent pricing model allowing you to pay only for what you use.
Getting Started with SigNoz
SigNoz Cloud is the easiest way to run SigNoz. Sign up for a free account and get 30 days of unlimited access to all features.

You can also install and self-host SigNoz yourself since it is open-source. With 24,000+ GitHub stars, open-source SigNoz is loved by developers. Find the instructions to self-host SigNoz.
Further Reading:
Top 11 Splunk Alternatives in 2024 [Includes Free & Open-Source Tools]
