Overview
This guide walks you through setting up monitoring and observability for Agno using OpenTelemetry and exporting logs, traces, and metrics to SigNoz. With this integration, you can observe the performance of various models, capture request/response details, and track system-level metrics in SigNoz, giving you real-time visibility into latency, error rates, and usage trends for your Agno applications.
Instrumenting Agno in your AI applications with telemetry ensures full observability across your agent workflows, making it easier to debug issues, optimize performance, and understand user interactions. By leveraging SigNoz, you can analyze correlated traces, logs, and metrics in unified dashboards, configure alerts, and gain actionable insights to continuously improve reliability, responsiveness, and user experience.
Prerequisites
- A SigNoz Cloud account with an active ingestion key or Self-Hosted SigNoz instance
- Internet access to send telemetry data to SigNoz Cloud
- Python 3.10+ with Agno installed
- For Python:
pipinstalled for managing Python packages
Monitoring Agno
No code auto-instrumentation is recommended for quick setup with minimal code changes. It's ideal when you want to get observability up and running without modifying your application code and are leveraging standard instrumentor libraries.
Step 1: Install the necessary packages in your Python environment.
pip install \
  opentelemetry-distro \
  opentelemetry-exporter-otlp \
  httpx \
  opentelemetry-instrumentation-httpx \
  opentelemetry-instrumentation-system-metrics \
  agno \
  openinference-instrumentation-agno
Step 2: Add Automatic Instrumentation
opentelemetry-bootstrap --action=installStep 3: Create an example Agno agent workflow
import os

from agno.agent import Agent
from agno.models.openai import OpenAIChat
from agno.tools.duckduckgo import DuckDuckGoTools

# Create and configure the agent
agent = Agent(
    name="Stock Market Agent",
    model=OpenAIChat(id="gpt-4o-mini"),
    tools=[DuckDuckGoTools()],
    markdown=True,
    debug_mode=True,
)

# Use the agent
agent.print_response("What is news on the stock market?")
📌 Note: Before running this code, ensure that you have set the environment variable
OPENAI_API_KEYwith your generated API key.
Step 4: Run your application with auto-instrumentation
Run your application with the following environment variables set. This configures OpenTelemetry to export traces, logs, and metrics to SigNoz Cloud and enables automatic log correlation:
OTEL_RESOURCE_ATTRIBUTES="service.name=<service_name>" \
OTEL_EXPORTER_OTLP_ENDPOINT="https://ingest.<region>.signoz.cloud:443" \
OTEL_EXPORTER_OTLP_HEADERS="signoz-ingestion-key=<your-ingestion-key>" \
OTEL_EXPORTER_OTLP_PROTOCOL=grpc \
OTEL_TRACES_EXPORTER=otlp \
OTEL_METRICS_EXPORTER=otlp \
OTEL_LOGS_EXPORTER=otlp \
OTEL_PYTHON_LOG_CORRELATION=true \
OTEL_PYTHON_LOGGING_AUTO_INSTRUMENTATION_ENABLED=true \
opentelemetry-instrument <your_run_command><service_name>is the name of your service<region>: Your SigNoz Cloud region<your-ingestion-key>: Your SigNoz ingestion key- Replace
<your_run_command>with the actual command you would use to run your application. In this case we would use:python main.py
Code-based manual instrumentation gives you fine-grained control over your telemetry configuration. Use this approach when you need to customize resource attributes, sampling strategies, or integrate with existing observability infrastructure.
Step 1: Install additional OpenTelemetry dependencies
pip install \
  opentelemetry-api \
  opentelemetry-sdk \
  opentelemetry-exporter-otlp \
  opentelemetry-instrumentation-httpx \
  opentelemetry-instrumentation-system-metrics \
  agno \
  openinference-instrumentation-agno
Step 2: Import the necessary modules in your Python application
Traces:
from opentelemetry import trace
from opentelemetry.sdk.resources import Resource
from opentelemetry.sdk.trace import TracerProvider
from opentelemetry.sdk.trace.export import BatchSpanProcessor
from opentelemetry.exporter.otlp.proto.http.trace_exporter import OTLPSpanExporter
Logs:
from opentelemetry.sdk._logs import LoggerProvider, LoggingHandler
from opentelemetry.sdk._logs.export import BatchLogRecordProcessor
from opentelemetry.exporter.otlp.proto.http._log_exporter import OTLPLogExporter
from opentelemetry._logs import set_logger_provider
import logging
Metrics:
from opentelemetry.sdk.metrics import MeterProvider
from opentelemetry.exporter.otlp.proto.http.metric_exporter import OTLPMetricExporter
from opentelemetry.sdk.metrics.export import PeriodicExportingMetricReader
from opentelemetry import metrics
from opentelemetry.instrumentation.system_metrics import SystemMetricsInstrumentor
from opentelemetry.instrumentation.httpx import HTTPXClientInstrumentor
Step 3: Set up the OpenTelemetry Tracer Provider to send traces directly to SigNoz Cloud
from opentelemetry.sdk.resources import Resource
from opentelemetry.sdk.trace import TracerProvider
from opentelemetry.sdk.trace.export import BatchSpanProcessor
from opentelemetry.exporter.otlp.proto.http.trace_exporter import OTLPSpanExporter
from opentelemetry import trace
import os

from openinference.instrumentation.agno import AgnoInstrumentor


resource = Resource.create({"service.name": "<service_name>"})
provider = TracerProvider(resource=resource)
span_exporter = OTLPSpanExporter(
    endpoint= os.getenv("OTEL_EXPORTER_TRACES_ENDPOINT"),
    headers={"signoz-ingestion-key": os.getenv("SIGNOZ_INGESTION_KEY")},
)
processor = BatchSpanProcessor(span_exporter)
provider.add_span_processor(processor)
trace.set_tracer_provider(provider)

# Start instrumenting agno
AgnoInstrumentor().instrument()<service_name>is the name of your serviceOTEL_EXPORTER_TRACES_ENDPOINT→ SigNoz Cloud trace endpoint with appropriate region:https://ingest.<region>.signoz.cloud:443/v1/tracesSIGNOZ_INGESTION_KEY→ Your SigNoz ingestion key
Step 4: Setup Logs
import logging
from opentelemetry.sdk.resources import Resource
from opentelemetry._logs import set_logger_provider
from opentelemetry.sdk._logs import LoggerProvider, LoggingHandler
from opentelemetry.sdk._logs.export import BatchLogRecordProcessor
from opentelemetry.exporter.otlp.proto.http._log_exporter import OTLPLogExporter
import os

resource = Resource.create({"service.name": "<service_name>"})
logger_provider = LoggerProvider(resource=resource)
set_logger_provider(logger_provider)

otlp_log_exporter = OTLPLogExporter(
    endpoint= os.getenv("OTEL_EXPORTER_LOGS_ENDPOINT"),
    headers={"signoz-ingestion-key": os.getenv("SIGNOZ_INGESTION_KEY")},
)
logger_provider.add_log_record_processor(
    BatchLogRecordProcessor(otlp_log_exporter)
)
# Attach OTel logging handler to root logger
handler = LoggingHandler(level=logging.INFO, logger_provider=logger_provider)
logging.basicConfig(level=logging.INFO, handlers=[handler])

logger = logging.getLogger(__name__)<service_name>is the name of your serviceOTEL_EXPORTER_LOGS_ENDPOINT→ SigNoz Cloud endpoint with appropriate region:https://ingest.<region>.signoz.cloud:443/v1/logsSIGNOZ_INGESTION_KEY→ Your SigNoz ingestion key
Step 5: Setup Metrics
from opentelemetry.sdk.resources import Resource
from opentelemetry.sdk.metrics import MeterProvider
from opentelemetry.exporter.otlp.proto.http.metric_exporter import OTLPMetricExporter
from opentelemetry.sdk.metrics.export import PeriodicExportingMetricReader
from opentelemetry import metrics
from opentelemetry.instrumentation.system_metrics import SystemMetricsInstrumentor
import os

resource = Resource.create({"service.name": "<service-name>"})
metric_exporter = OTLPMetricExporter(
    endpoint= os.getenv("OTEL_EXPORTER_METRICS_ENDPOINT"),
    headers={"signoz-ingestion-key": os.getenv("SIGNOZ_INGESTION_KEY")},
)
reader = PeriodicExportingMetricReader(metric_exporter)
metric_provider = MeterProvider(metric_readers=[reader], resource=resource)
metrics.set_meter_provider(metric_provider)

meter = metrics.get_meter(__name__)

# turn on out-of-the-box metrics
SystemMetricsInstrumentor().instrument()
HTTPXClientInstrumentor().instrument()<service_name>is the name of your serviceOTEL_EXPORTER_METRICS_ENDPOINT→ SigNoz Cloud endpoint with appropriate region:https://ingest.<region>.signoz.cloud:443/v1/metricsSIGNOZ_INGESTION_KEY→ Your SigNoz ingestion key
📌 Note: SystemMetricsInstrumentor provides system metrics (CPU, memory, etc.), and HTTPXClientInstrumentor provides outbound HTTP request metrics such as request duration. If you want to add custom metrics to your Agno application, see Python Custom Metrics.
Step 6: Run an example Agno agent workflow
📌 Note: Ensure you have completed the steps above (traces, logs, and metrics configuration) before running this code. All OpenTelemetry instrumentation must be initialized first.
import os

from agno.agent import Agent
from agno.models.openai import OpenAIChat
from agno.tools.duckduckgo import DuckDuckGoTools

# Create and configure the agent
agent = Agent(
    name="Stock Market Agent",
    model=OpenAIChat(id="gpt-4o-mini"),
    tools=[DuckDuckGoTools()],
    markdown=True,
    debug_mode=True,
)

# Use the agent
agent.print_response("What is news on the stock market?")
📌 Note: Before running this code, ensure that you have set the environment variable
OPENAI_API_KEYwith your generated API key.
View Traces, Logs, and Metrics in SigNoz
Your Agno agent usage should now automatically emit traces, logs, and metrics.
You should be able to view traces in SigNoz Cloud under the traces tab:

When you click on a trace in SigNoz, you'll see a detailed view of the trace, including all associated spans, along with their events and attributes.

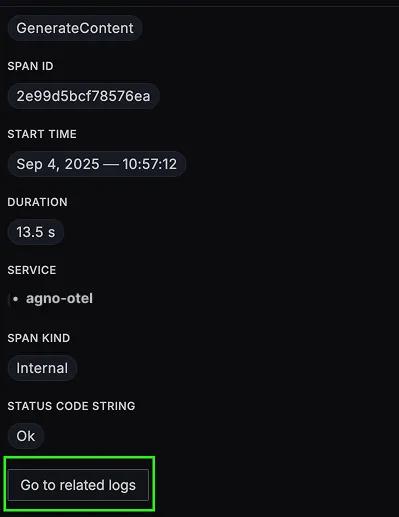
You should be able to view logs in SigNoz Cloud under the logs tab. You can also view logs by clicking on the “Related Logs” button in the trace view to see correlated logs:

When you click on any of these logs in SigNoz, you'll see a detailed view of the log, including attributes:

You should be able to see Agno related metrics in SigNoz Cloud under the metrics tab:

When you click on any of these metrics in SigNoz, you'll see a detailed view of the metric, including attributes:

Troubleshooting
If you don't see your telemetry data:
- Verify network connectivity - Ensure your application can reach SigNoz Cloud endpoints
- Check ingestion key - Verify your SigNoz ingestion key is correct
- Wait for data - OpenTelemetry batches data before sending, so wait 10-30 seconds after making API calls
- Try a console exporter — Enable a console exporter locally to confirm that your application is generating telemetry data before it’s sent to SigNoz
Next Steps
You can also check out our custom Agno dashboard here which provides specialized visualizations for monitoring your Agno usage in applications. The dashboard includes pre-built charts specifically tailored for LLM usage, along with import instructions to get started quickly.

Related integrations
Instrument the rest of your agent stack with the same OpenTelemetry pipeline:
- Google ADK observability with OpenTelemetry - trace ADK agents, tools, and the model calls they make
- Semantic Kernel observability with OpenTelemetry - trace plugins, planners, and kernel function calls
- Mastra observability with OpenTelemetry - trace Mastra agents, workflows, and tool calls
- LiveKit observability with OpenTelemetry - trace voice agent sessions, turn latency, and STT and TTS calls
- Monitor Pipecat voice agents with OpenTelemetry - trace pipeline latency across the STT, LLM, and TTS stages
Browse all LLM observability integrations to instrument the rest of your stack.


