


Overview
Claude Code monitoring with OpenTelemetry gives you full visibility into how Claude is used across your engineering team. This guide walks you through exporting Claude Code logs and metrics to SigNoz, so you can track the signals that matter most:
- Token usage & costs — break down spend by user, model, or subagent
- Session & request activity — track adoption, active time, and request volumes
- Performance — monitor API latency, cache hit rates, and tool execution times
- Quota & limits — stay ahead of rate limits before they impact developers
- Tool decisions — see accept/reject rates across Edit, Write, and other tools
- Errors & retries — detect API failures and retry exhaustion before they snowball
Once set up, all of this flows into SigNoz dashboards where you can correlate logs and metrics, set alerts, and analyze trends over time.
Prerequisites
- SigNoz setup (choose one):
- SigNoz Cloud account with an active ingestion key
- Self-hosted SigNoz instance
- Internet access to send telemetry data to SigNoz Cloud
- Claude Code installed and running on your system
Monitoring Claude Code
Check out detailed instructions on how to set up OpenTelemetry instrumentation for your Claude Code usage over here.
Option 1 (VSCode)
Step 1: Launch VSCode with telemetry enabled
CLAUDE_CODE_ENABLE_TELEMETRY=1 \
OTEL_METRICS_EXPORTER=otlp \
OTEL_LOGS_EXPORTER=otlp \
OTEL_EXPORTER_OTLP_PROTOCOL=grpc \
OTEL_EXPORTER_OTLP_ENDPOINT="https://ingest.<region>.signoz.cloud:443" \
OTEL_EXPORTER_OTLP_HEADERS="signoz-ingestion-key=<your-ingestion-key>" \
OTEL_METRIC_EXPORT_INTERVAL=10000 \
OTEL_LOGS_EXPORT_INTERVAL=5000 \
code .
<region>: Your SigNoz Cloud region<your-ingestion-key>: Your SigNoz ingestion key
Using self-hosted SigNoz? Most steps are identical. To adapt this guide, update the endpoint and remove the ingestion key header as shown in Cloud → Self-Hosted.
This will open VSCode with the required environment variables already configured. From here, any Claude Code activity will automatically generate telemetry and export logs to your SigNoz Cloud instance.
For convenience, you can also clone our bash script, update it with your SigNoz endpoint and ingestion key, and run it directly.
Option 2 (Terminal)
Step 1: Launch Claude Code with telemetry enabled
CLAUDE_CODE_ENABLE_TELEMETRY=1 \
OTEL_METRICS_EXPORTER=otlp \
OTEL_LOGS_EXPORTER=otlp \
OTEL_EXPORTER_OTLP_PROTOCOL=grpc \
OTEL_EXPORTER_OTLP_ENDPOINT="https://ingest.<region>.signoz.cloud:443" \
OTEL_EXPORTER_OTLP_HEADERS="signoz-ingestion-key=<your-ingestion-key>" \
OTEL_METRIC_EXPORT_INTERVAL=10000 \
OTEL_LOGS_EXPORT_INTERVAL=5000 \
claude
- Set the
<region>to match your SigNoz Cloud region - Replace
<your-ingestion-key>with your SigNoz ingestion key
Using self-hosted SigNoz? Most steps are identical. To adapt this guide, update the endpoint and remove the ingestion key header as shown in Cloud → Self-Hosted.
This will launch Claude Code with telemetry enabled. Any Claude Code activity in the terminal session will automatically generate and export logs and metrics to your SigNoz Cloud instance.
For convenience, you can also clone our bash script, update it with your SigNoz endpoint and ingestion key, and run it directly.
Administrator Configuration
Administrators can configure OpenTelemetry settings for all users through the managed settings file. This allows for centralized control of telemetry settings across an organization. See the settings precedence for more information about how settings are applied.
The managed settings file is located at:
- macOS:
/Library/Application Support/ClaudeCode/managed-settings.json - Linux and WSL:
/etc/claude-code/managed-settings.json - Windows:
C:\ProgramData\ClaudeCode\managed-settings.json
Example managed settings configuration:
{
  "env": {
    "CLAUDE_CODE_ENABLE_TELEMETRY": "1",
    "OTEL_METRICS_EXPORTER": "otlp",
    "OTEL_LOGS_EXPORTER": "otlp",
    "OTEL_EXPORTER_OTLP_PROTOCOL": "grpc",
    "OTEL_EXPORTER_OTLP_ENDPOINT": "http://collector.company.com:4317",
    "OTEL_EXPORTER_OTLP_HEADERS": "Authorization=Bearer company-token"
  }
}
Managed settings can be distributed via MDM (Mobile Device Management) or other device management solutions. Environment variables defined in the managed settings file have high precedence and cannot be overridden by users.
Example Configurations
# Console debugging (1-second intervals)
export CLAUDE_CODE_ENABLE_TELEMETRY=1
export OTEL_METRICS_EXPORTER=console
export OTEL_METRIC_EXPORT_INTERVAL=1000

# OTLP/gRPC
export CLAUDE_CODE_ENABLE_TELEMETRY=1
export OTEL_METRICS_EXPORTER=otlp
export OTEL_EXPORTER_OTLP_PROTOCOL=grpc
export OTEL_EXPORTER_OTLP_ENDPOINT=http://localhost:4317

# Prometheus
export CLAUDE_CODE_ENABLE_TELEMETRY=1
export OTEL_METRICS_EXPORTER=prometheus

# Multiple exporters
export CLAUDE_CODE_ENABLE_TELEMETRY=1
export OTEL_METRICS_EXPORTER=console,otlp
export OTEL_EXPORTER_OTLP_PROTOCOL=http/json

# Different endpoints/backends for metrics and logs
export CLAUDE_CODE_ENABLE_TELEMETRY=1
export OTEL_METRICS_EXPORTER=otlp
export OTEL_LOGS_EXPORTER=otlp
export OTEL_EXPORTER_OTLP_METRICS_PROTOCOL=http/protobuf
export OTEL_EXPORTER_OTLP_METRICS_ENDPOINT=http://metrics.company.com:4318
export OTEL_EXPORTER_OTLP_LOGS_PROTOCOL=grpc
export OTEL_EXPORTER_OTLP_LOGS_ENDPOINT=http://logs.company.com:4317

# Metrics only (no events/logs)
export CLAUDE_CODE_ENABLE_TELEMETRY=1
export OTEL_METRICS_EXPORTER=otlp
export OTEL_EXPORTER_OTLP_PROTOCOL=grpc
export OTEL_EXPORTER_OTLP_ENDPOINT=http://localhost:4317

# Events/logs only (no metrics)
export CLAUDE_CODE_ENABLE_TELEMETRY=1
export OTEL_LOGS_EXPORTER=otlp
export OTEL_EXPORTER_OTLP_PROTOCOL=grpc
export OTEL_EXPORTER_OTLP_ENDPOINT=http://localhost:4317
Your Claude Code activity should now automatically emit logs and metrics.
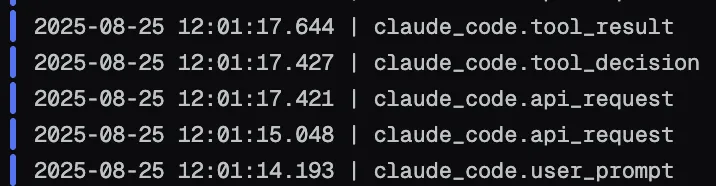
Finally, you should be able to view logs in Signoz Cloud under the logs tab:
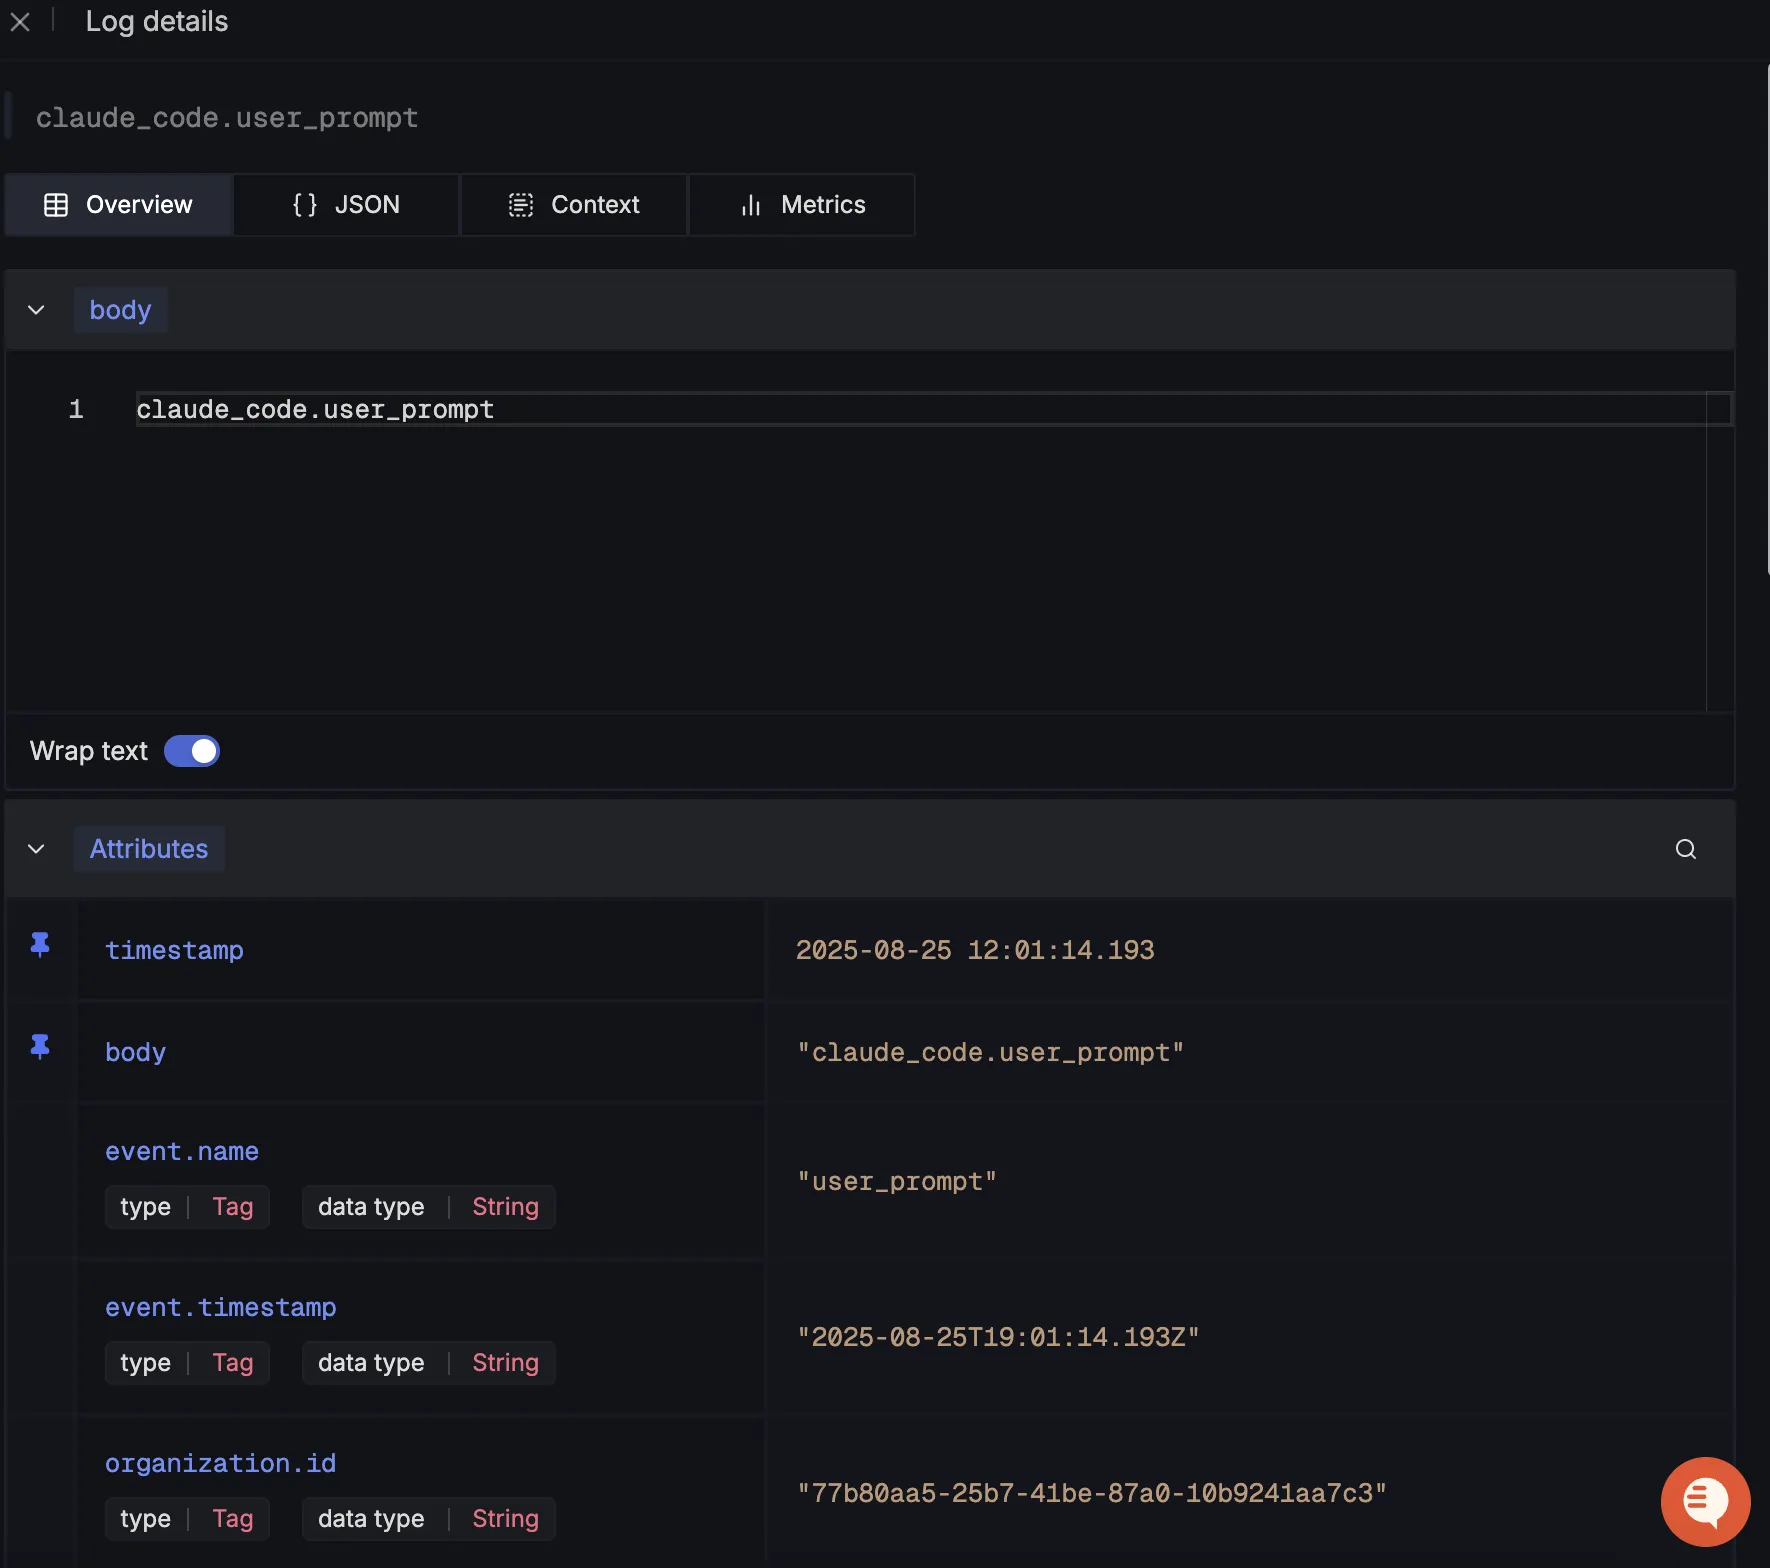
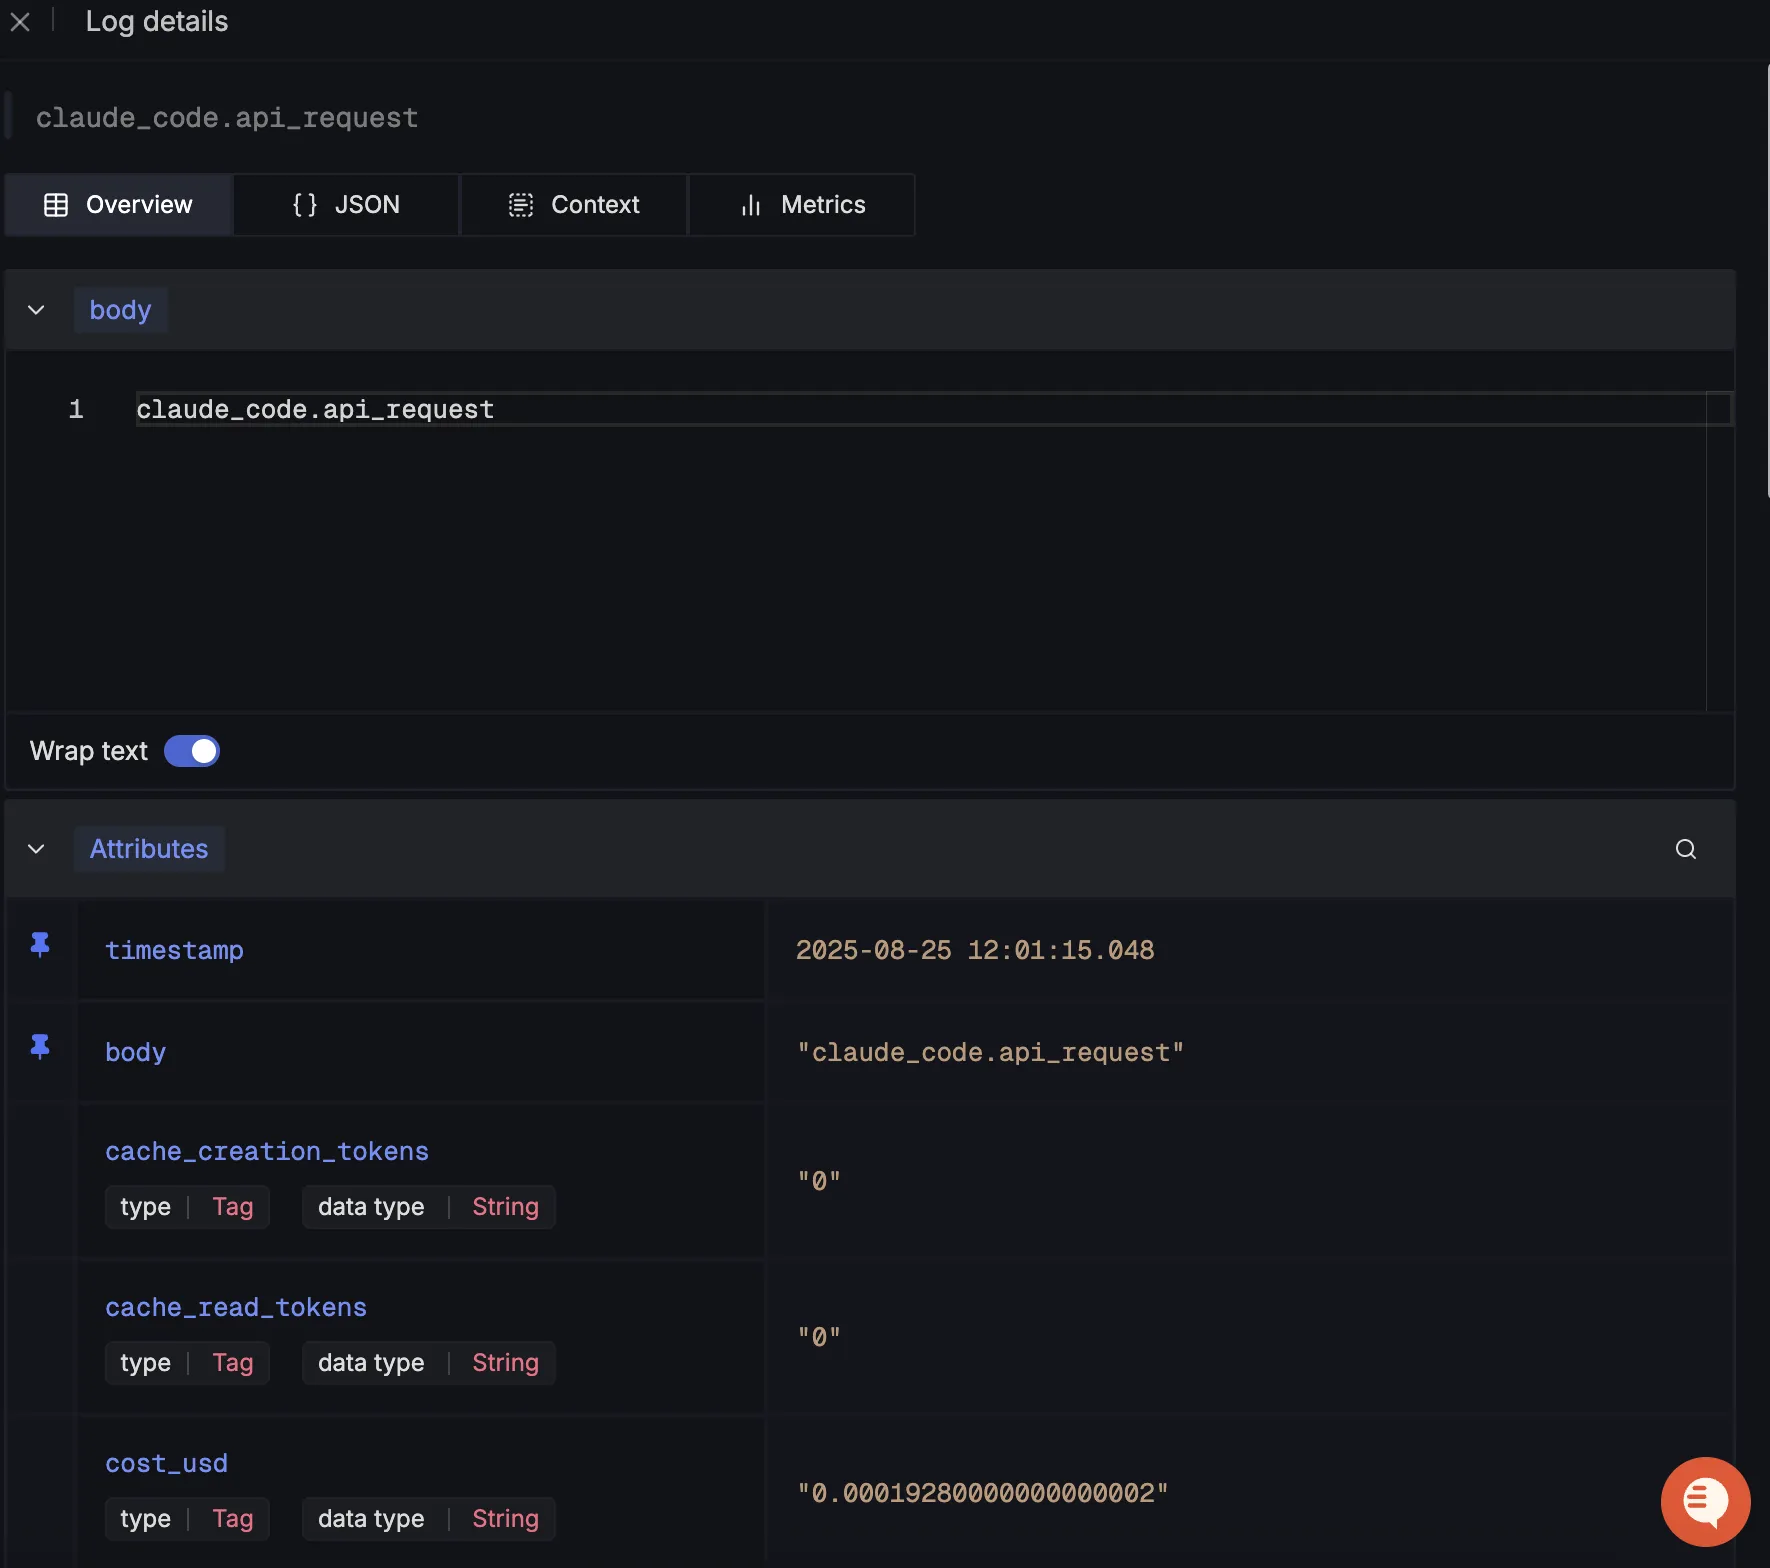
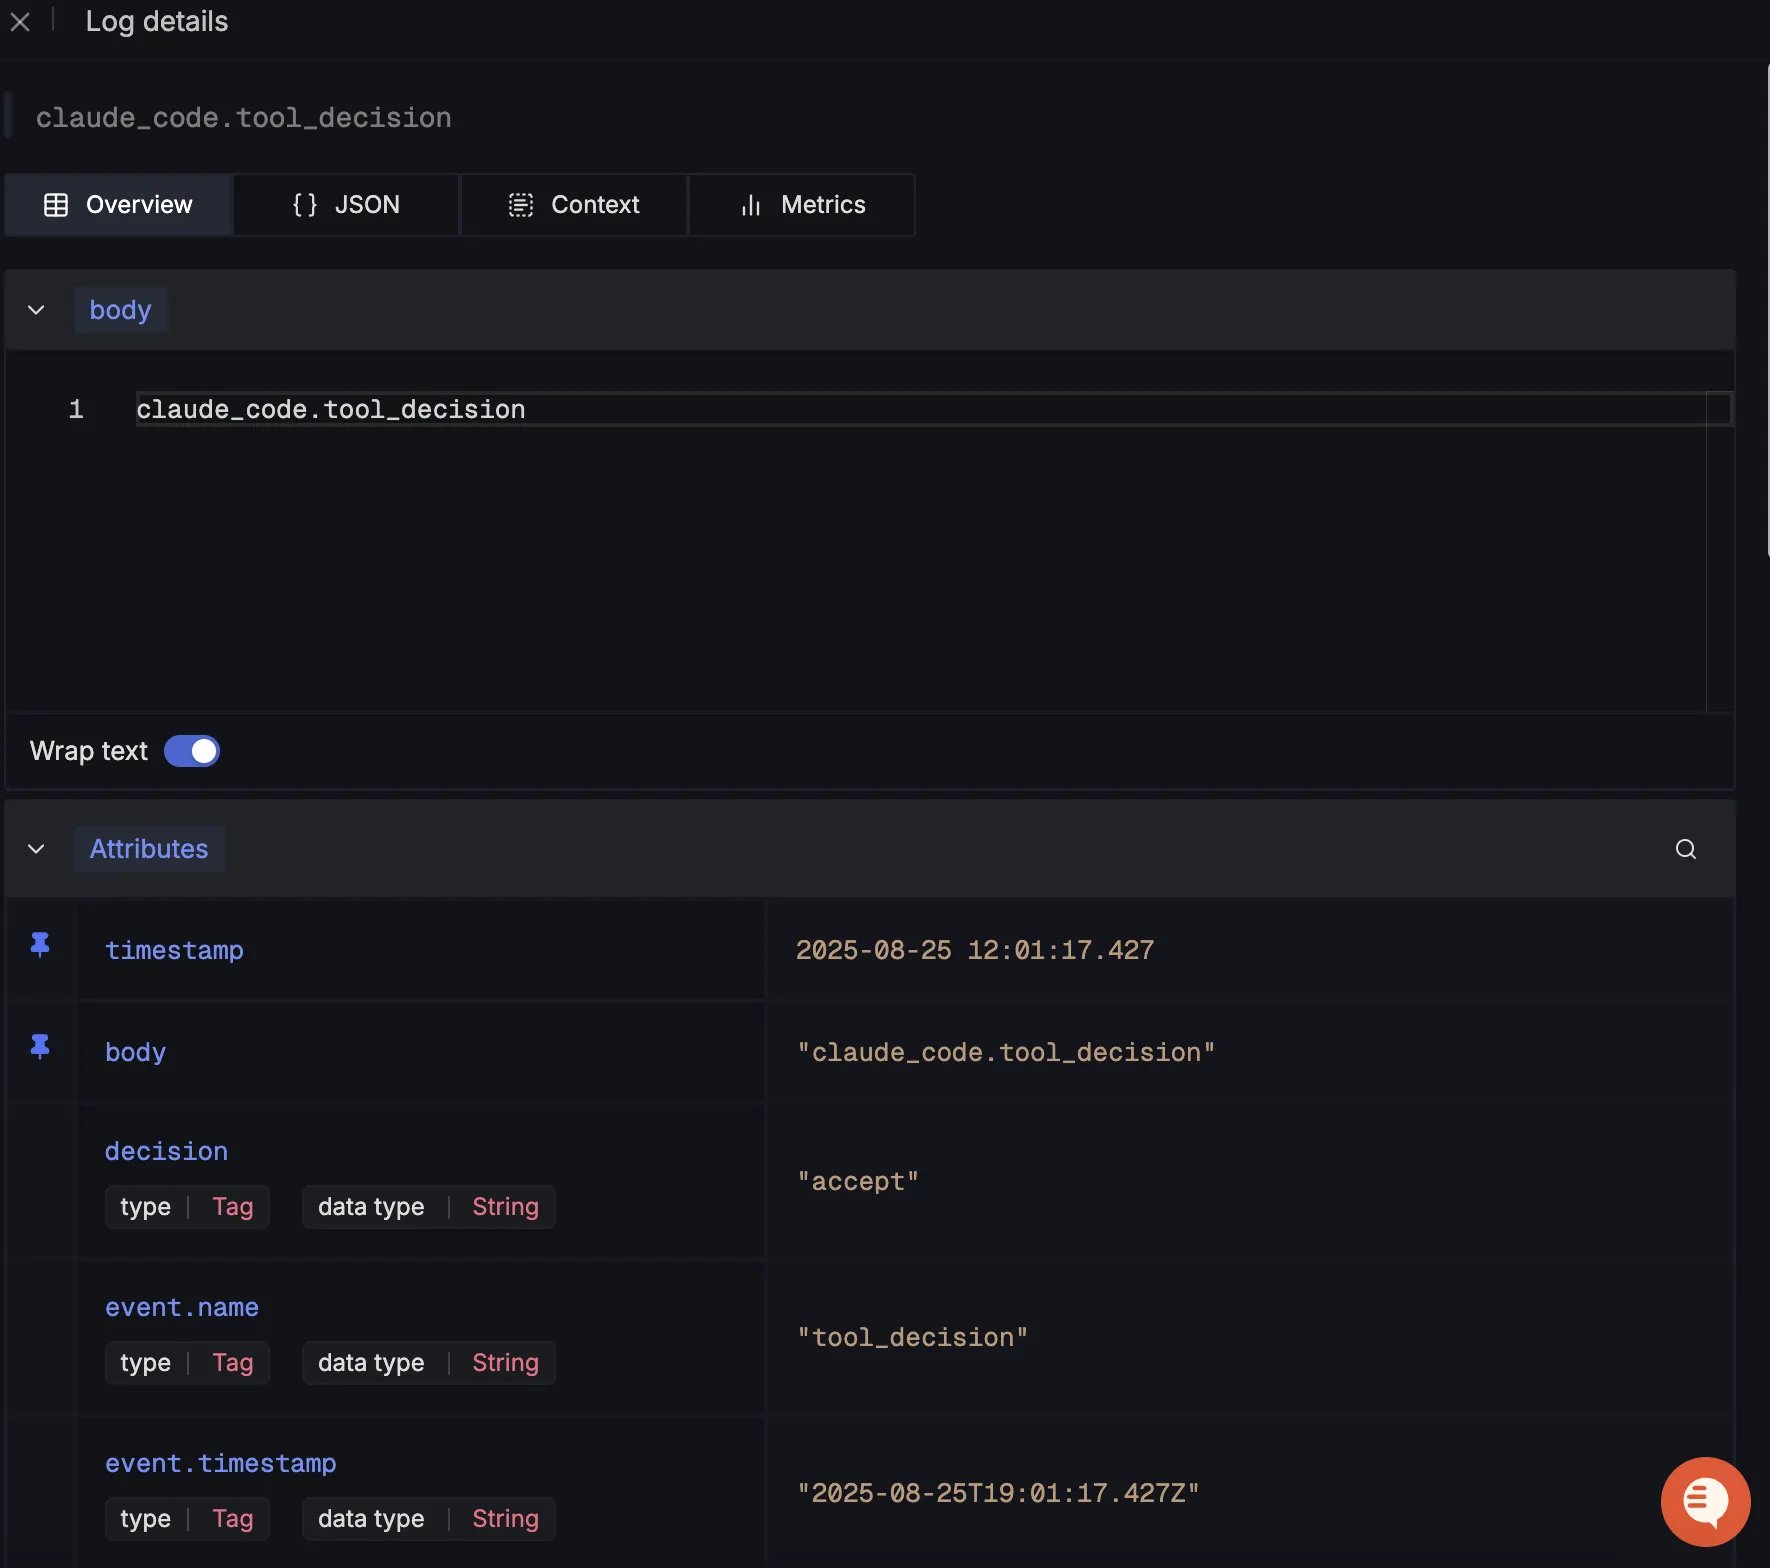
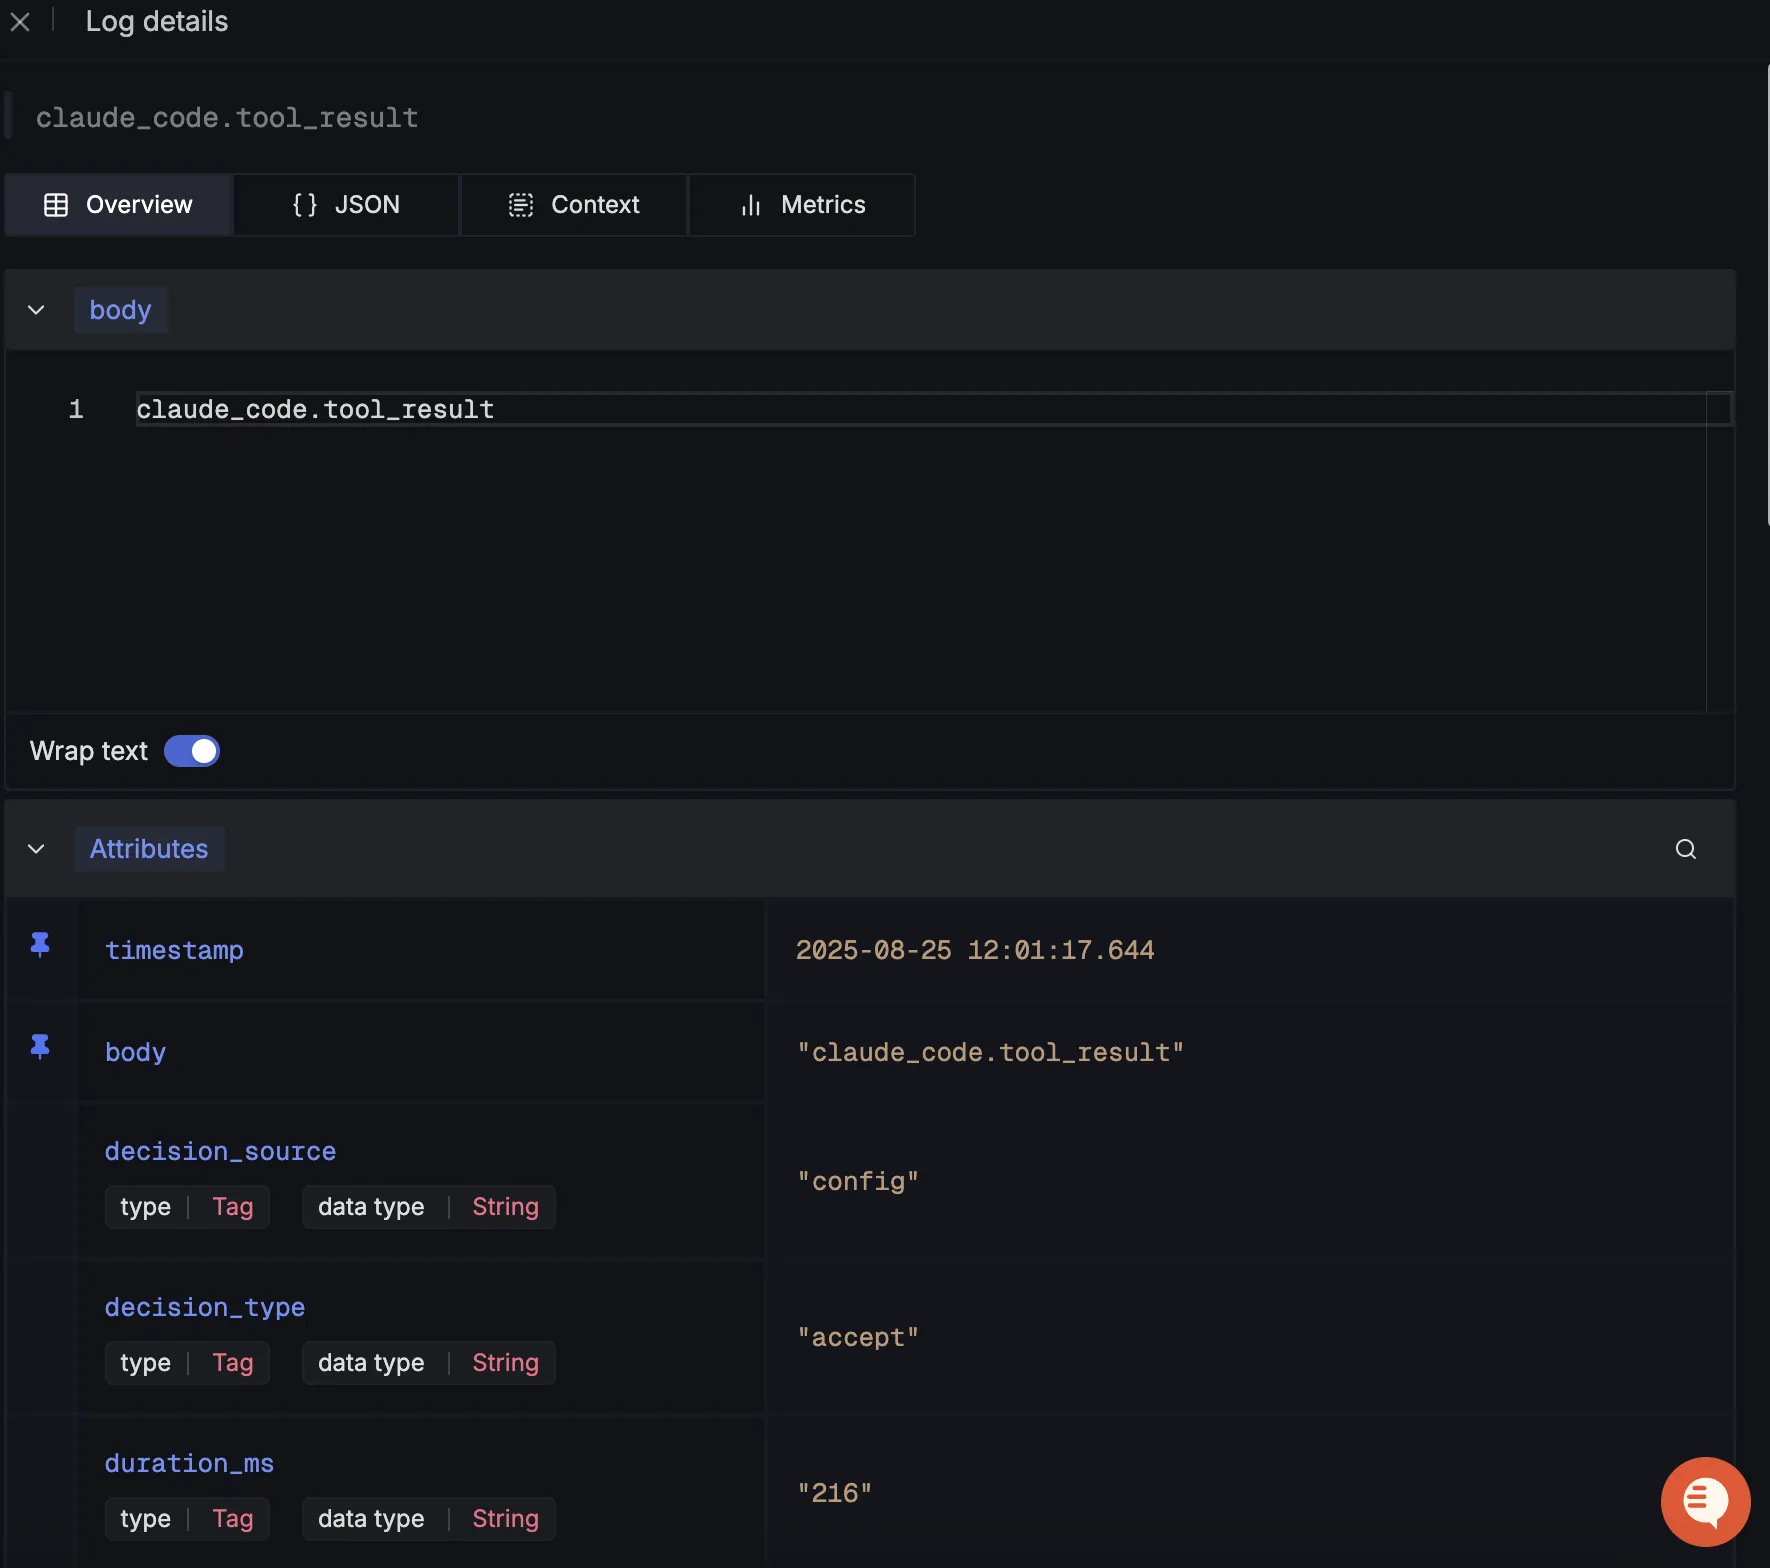
When you click on any of these logs in SigNoz, you'll see a detailed view of the log, including attributes:
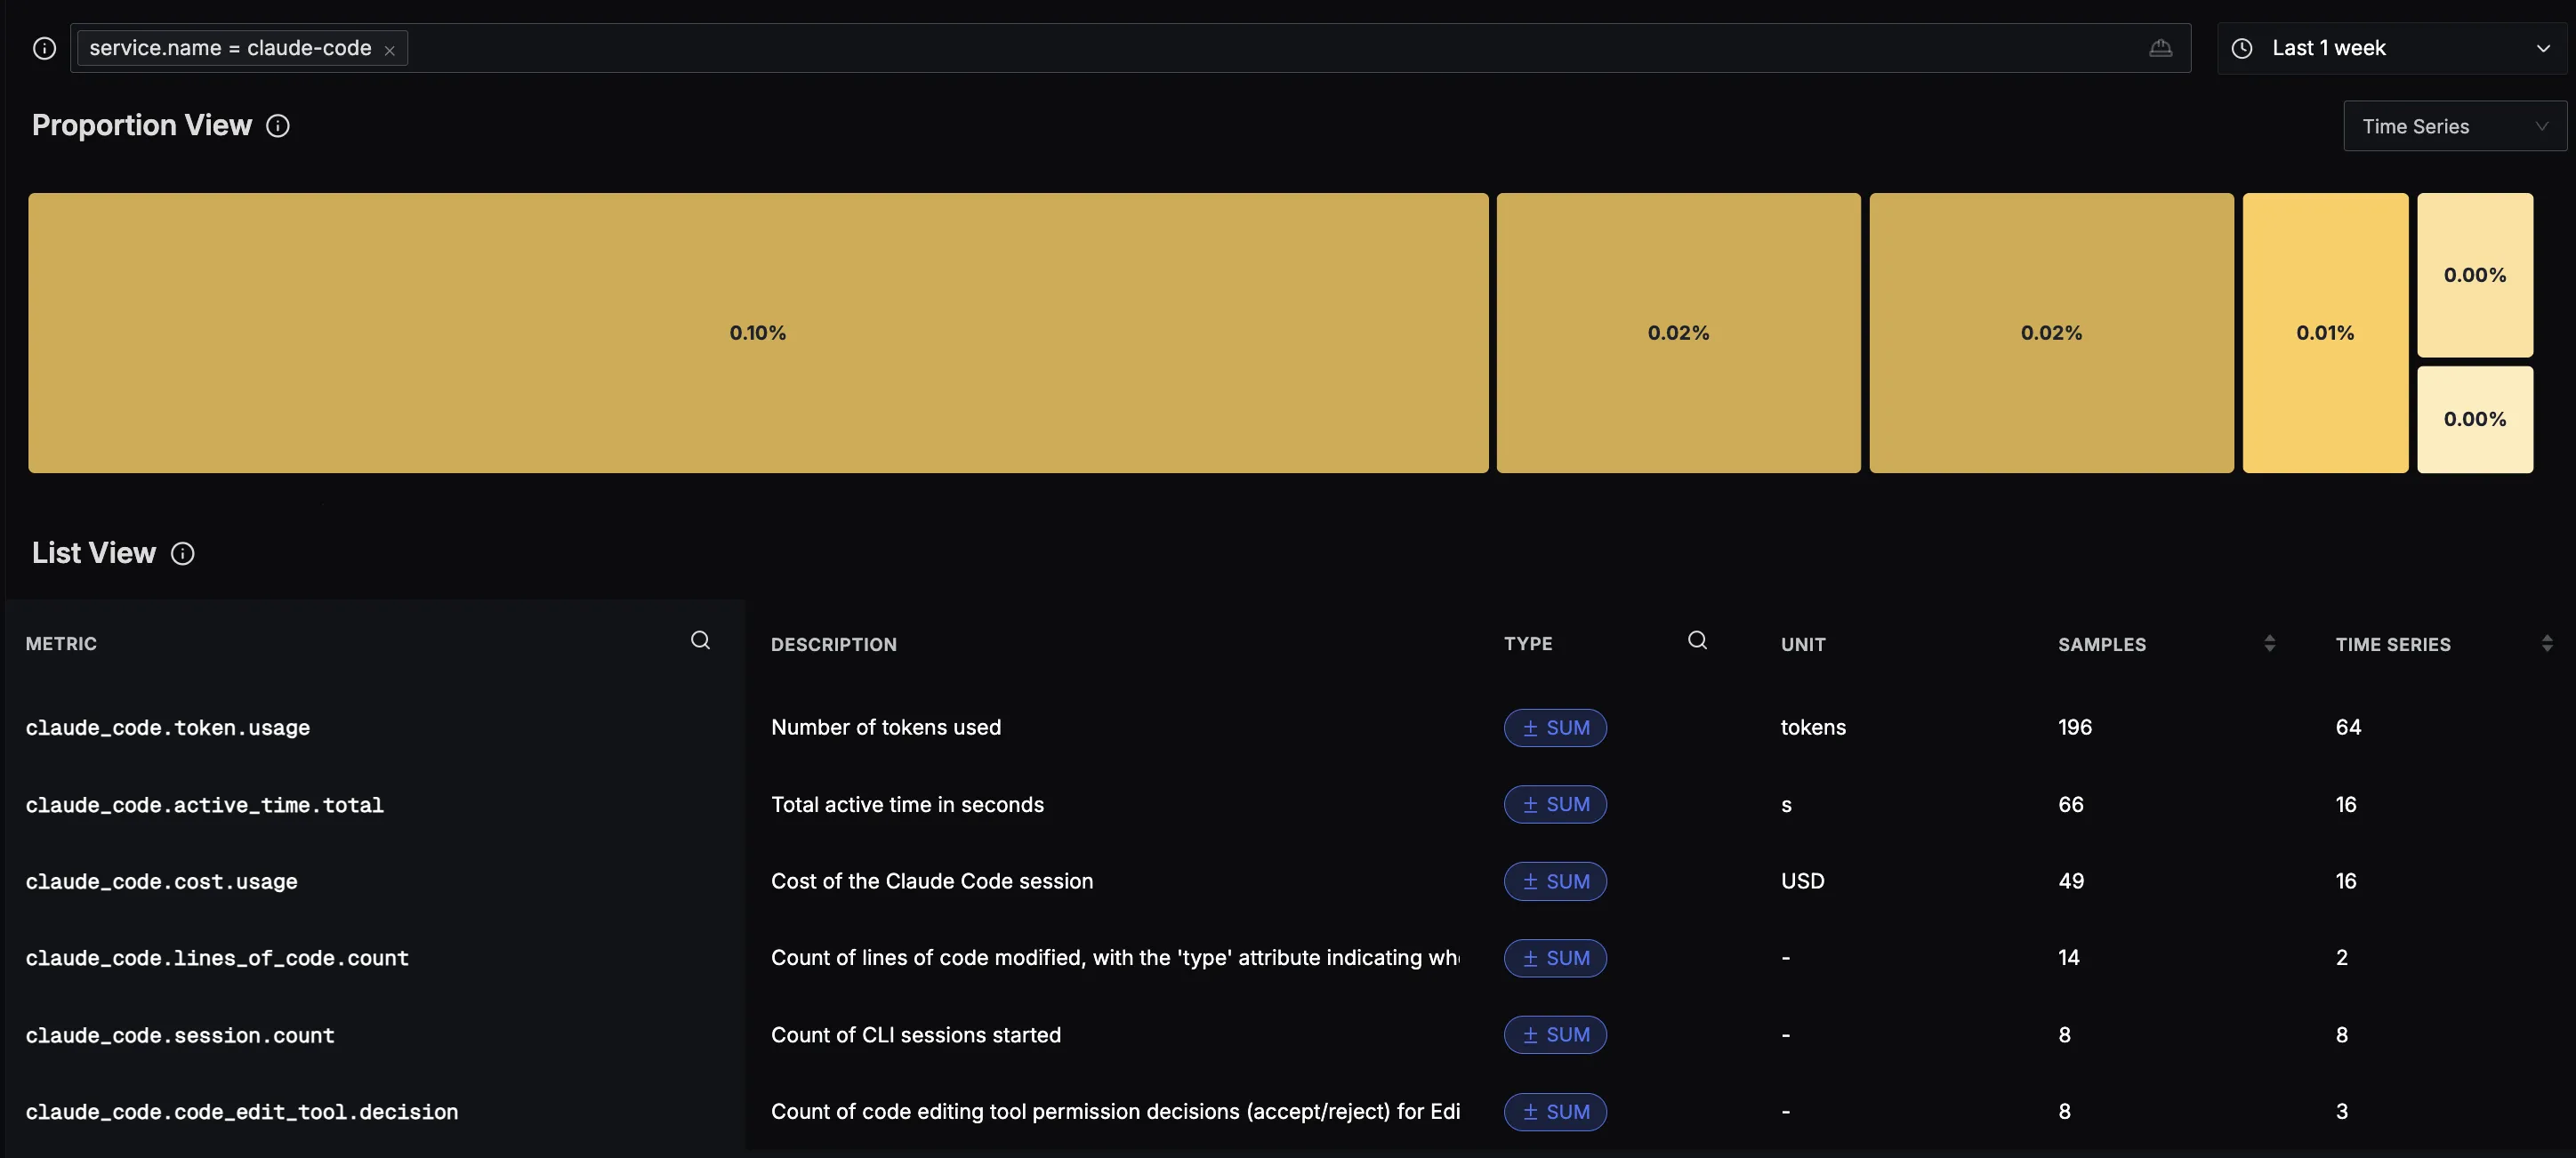
You should be able to see Claude Code related metrics in Signoz Cloud under the metrics tab:
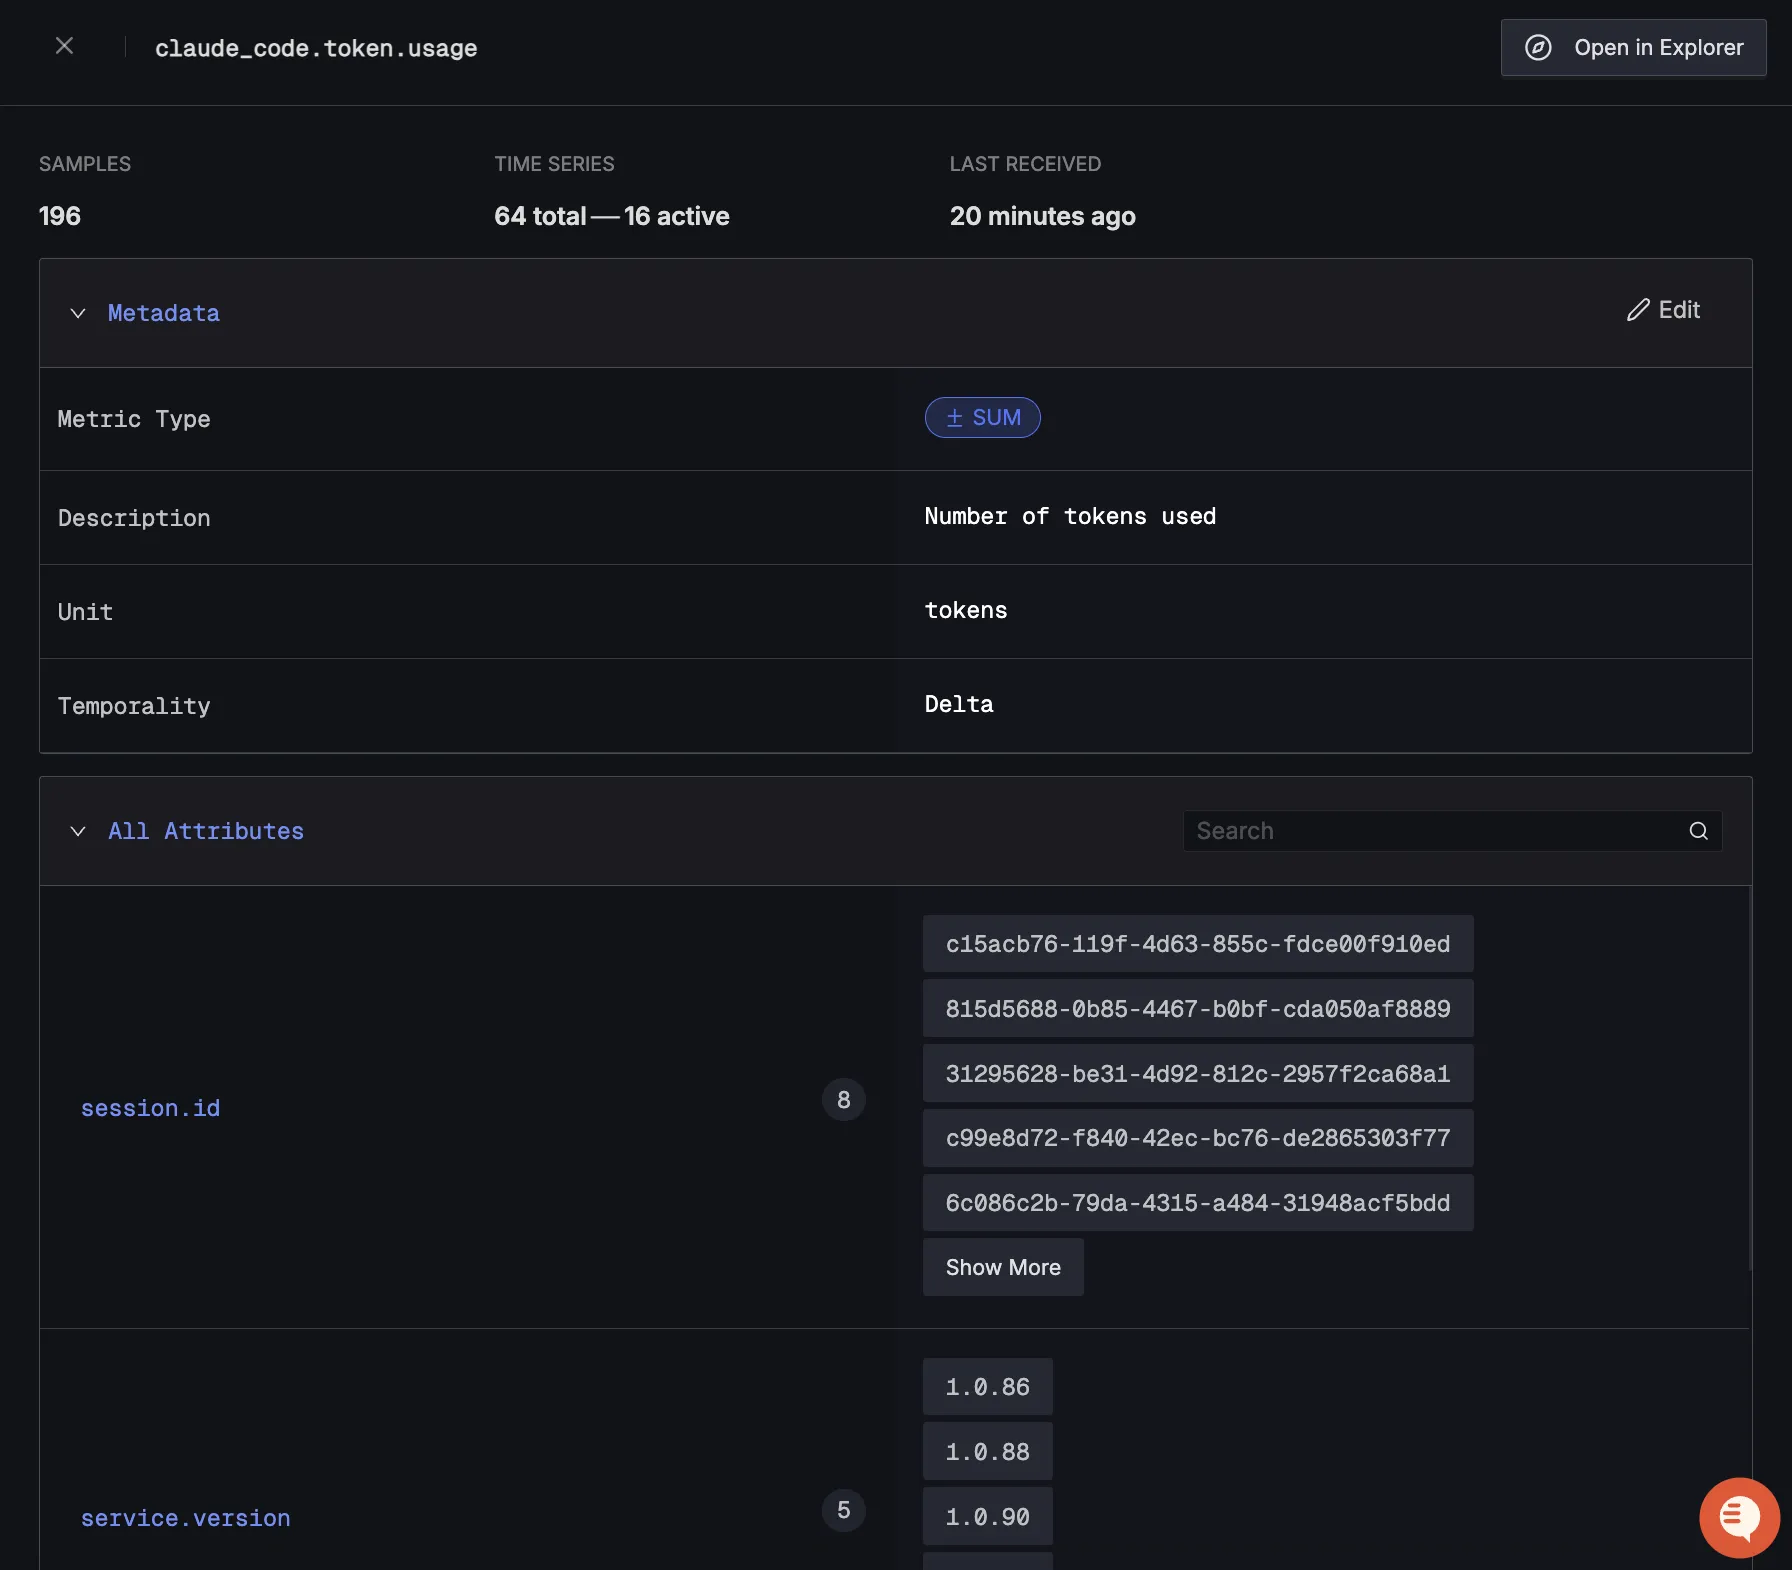
When you click on any of these metrics in SigNoz, you'll see a detailed view of the metric, including attributes:
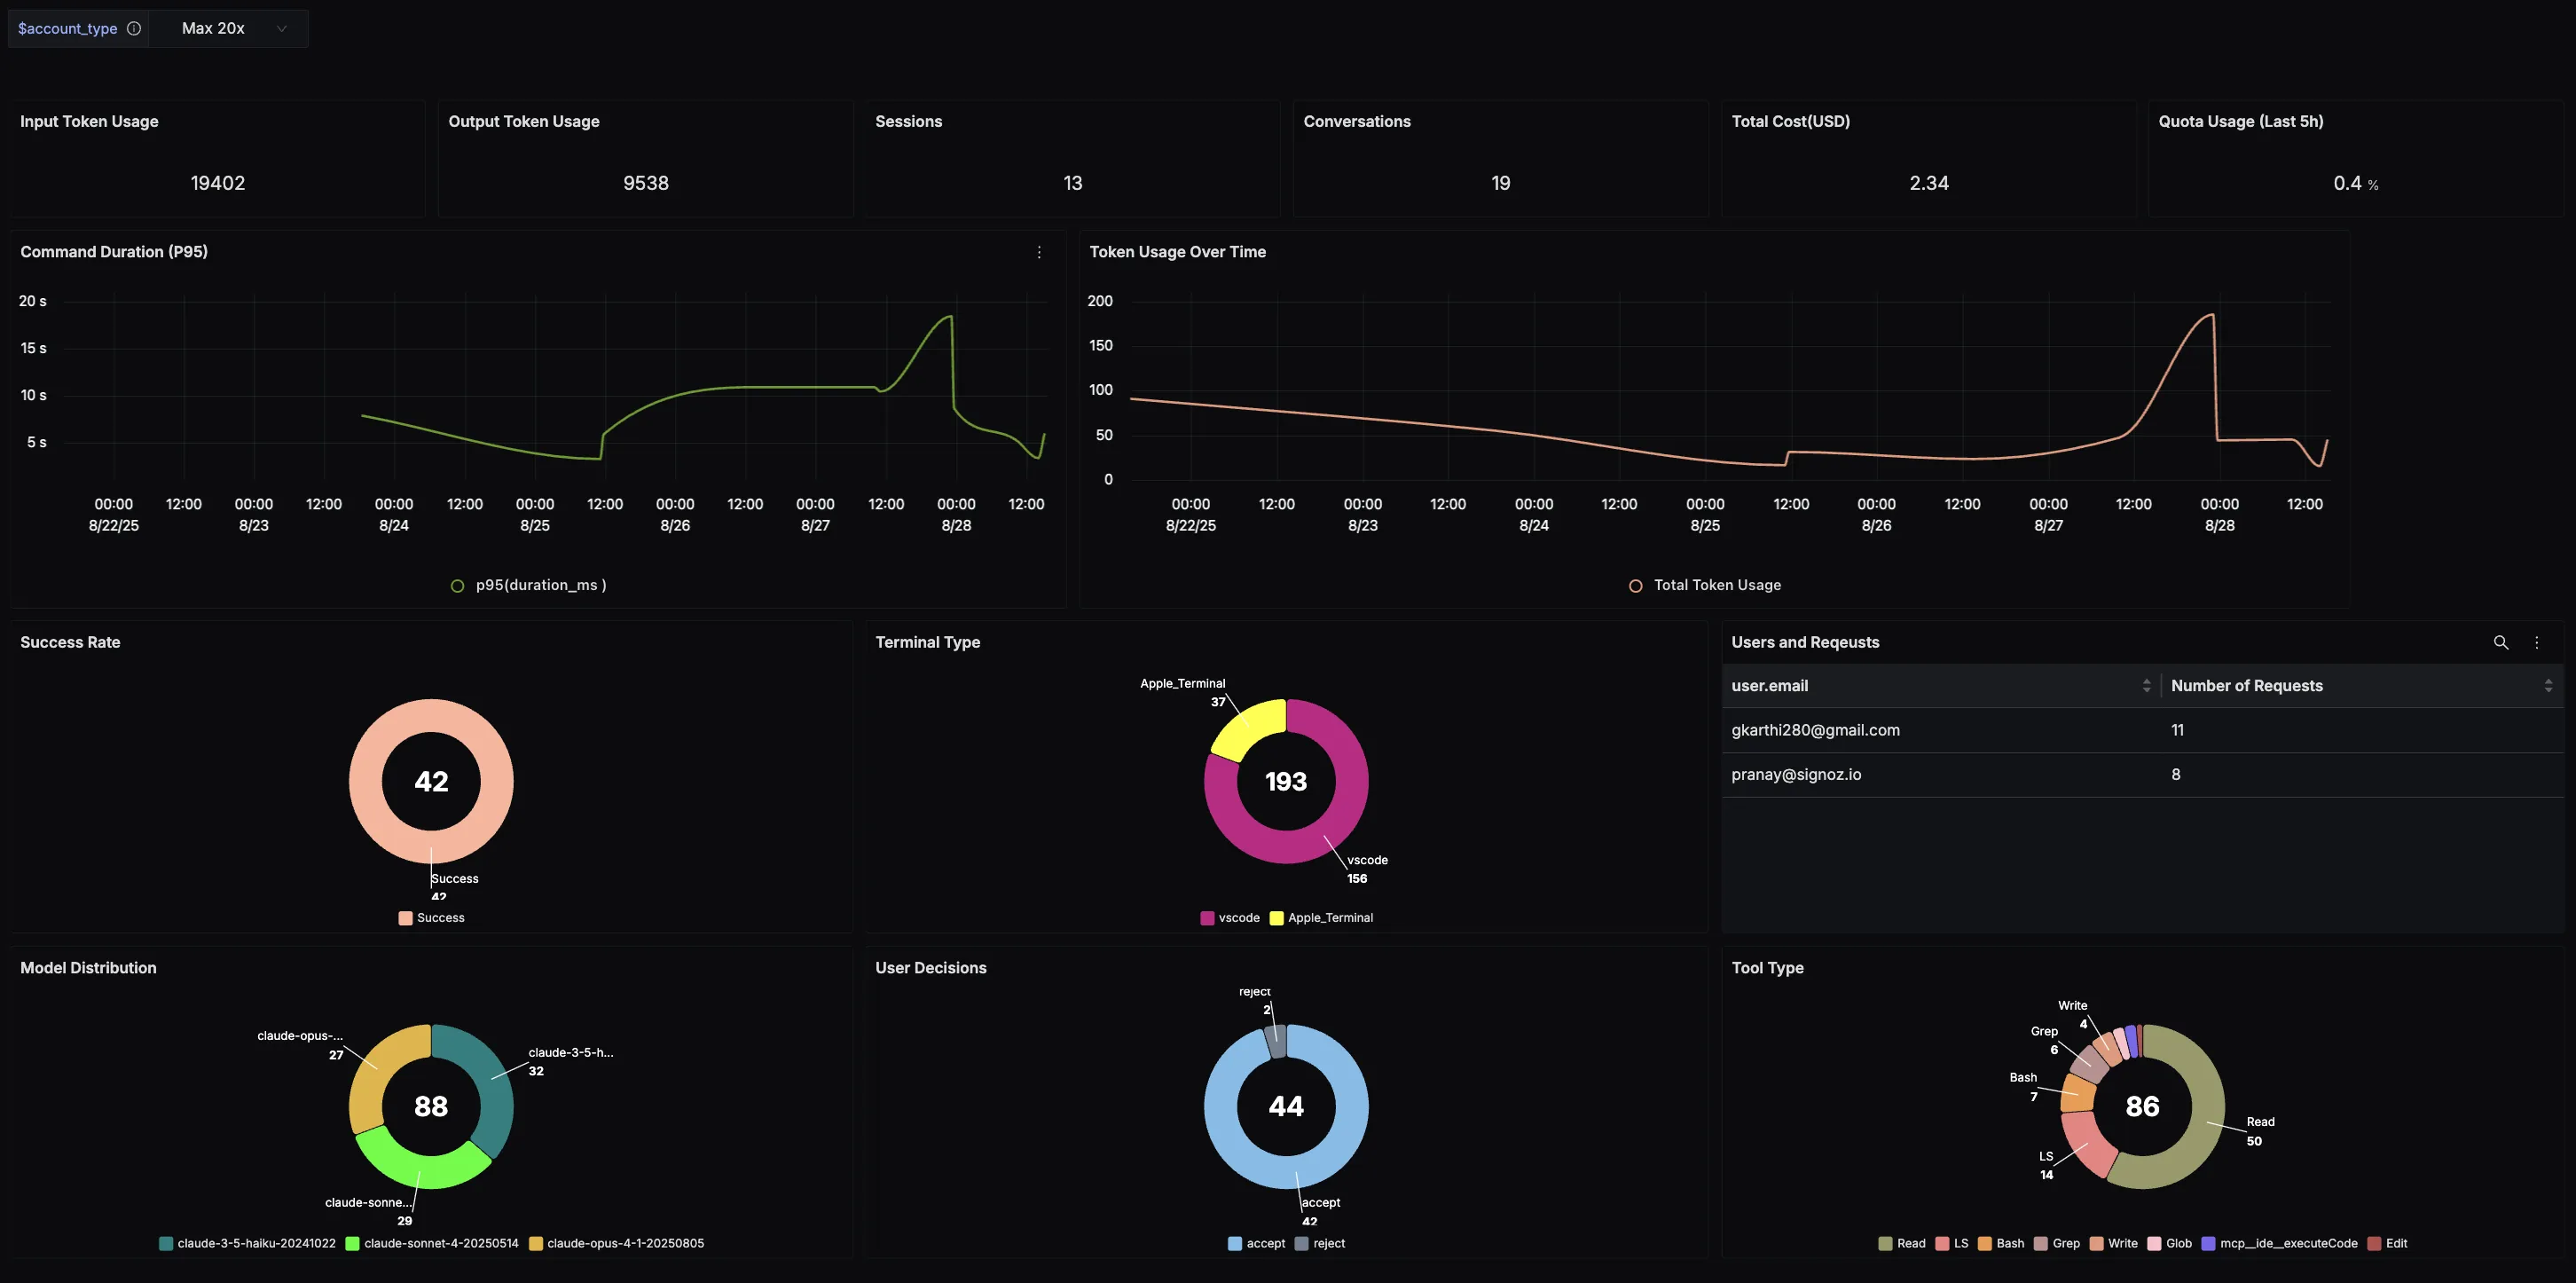
Dashboard
You can also check out our custom Claude Code dashboard here which provides specialized visualizations for monitoring your Claude Code usage. The dashboard includes pre-built charts specifically tailored for LLM usage, along with import instructions to get started quickly.
Telemetry Data
Claude Code emits the following metrics and events via OpenTelemetry. For the full upstream specification, see the Claude Code monitoring docs.
Standard Attributes
Every metric and event includes these attributes:
| Attribute | Description |
|---|---|
session.id | Unique session identifier |
user.id | Anonymous device/installation identifier |
user.email | User email address (when authenticated via OAuth) |
user.account_uuid | Account UUID (when authenticated) |
user.account_id | Account ID matching Anthropic admin APIs (when authenticated) |
organization.id | Organization UUID (when authenticated) |
terminal.type | Terminal type, e.g. vscode, iTerm.app, cursor, tmux |
app.version | Claude Code version (opt-in via OTEL_METRICS_INCLUDE_VERSION=true) |
Metrics
| Metric | Description | Unit | Key Attributes |
|---|---|---|---|
claude_code.session.count | Sessions started | count | start_type (fresh, resume, continue) |
claude_code.token.usage | Tokens used per API request | tokens | type (input, output, cacheRead, cacheCreation), model, query_source, speed |
claude_code.cost.usage | Estimated cost per API request | USD | model, query_source, speed, agent.name, skill.name, effort |
claude_code.lines_of_code.count | Lines of code added or removed | count | type (added, removed) |
claude_code.commit.count | Git commits created | count | — |
claude_code.pull_request.count | Pull requests or merge requests created | count | — |
claude_code.code_edit_tool.decision | Edit/Write/NotebookEdit permission decisions | count | tool_name, decision (accept/reject), source, language |
claude_code.active_time.total | Active usage time | seconds | type (user for keyboard input, cli for tool/AI response time) |
Events
Claude Code emits these events via the OpenTelemetry logs/events protocol (when OTEL_LOGS_EXPORTER is configured):
| Event | Emitted When | Key Attributes |
|---|---|---|
claude_code.user_prompt | User submits a prompt | prompt_length, command_name, command_source, prompt (redacted by default — enable with OTEL_LOG_USER_PROMPTS=1) |
claude_code.api_request | API request to Claude completes | model, cost_usd, duration_ms, input_tokens, output_tokens, cache_read_tokens, cache_creation_tokens, request_id, speed, query_source |
claude_code.api_error | API request fails after all retries | model, error, status_code, duration_ms, attempt, speed, query_source |
claude_code.api_retries_exhausted | All retry attempts are exhausted | model, error, total_attempts, total_retry_duration_ms, status_code |
claude_code.tool_result | Tool execution completes | tool_name, success, duration_ms, decision_type, decision_source, error_type, tool_input_size_bytes, tool_result_size_bytes |
claude_code.tool_decision | Tool permission is accepted or rejected | tool_name, decision (accept/reject), source (config, hook, user_permanent, user_temporary, user_abort, user_reject) |
claude_code.permission_mode_changed | Permission mode switches | from_mode, to_mode, trigger (shift_tab, exit_plan_mode, auto_gate_denied, auto_opt_in) |
claude_code.mcp_server_connection | MCP server connects, fails, or disconnects | status (connected, failed, disconnected), transport_type, server_scope, duration_ms, error_code |
claude_code.auth | /login or /logout completes | action (login/logout), success, auth_method, error_category |
claude_code.compaction | Conversation compaction completes | trigger (auto/manual), success, pre_tokens, post_tokens, duration_ms |
claude_code.internal_error | Unexpected internal error is caught | error_name, error_code |
claude_code.plugin_installed | Plugin finishes installing | plugin.name, marketplace.name, install.trigger |
claude_code.plugin_loaded | Plugin is active at session start | plugin.name, plugin.scope, plugin.version, enabled_via |
claude_code.skill_activated | Skill is invoked by Claude or as a / command | skill.name, invocation_trigger, skill.source |
claude_code.hook_execution_complete | All hooks for a hook event finish | hook_event, hook_name, num_hooks, num_success, num_blocking, total_duration_ms |
claude_code.feedback_survey | Session quality survey is shown or answered | event_type, survey_type, response |
All events share a prompt.id attribute, a UUID that links every event produced while processing a single user prompt. Filter by prompt.id in SigNoz to correlate all API requests and tool executions triggered by one prompt.
Troubleshooting
If you don't see your telemetry data in SigNoz:
- Check
CLAUDE_CODE_ENABLE_TELEMETRY- This must be set to1. Telemetry is opt-in and nothing is exported without it - Verify your region and ingestion key - An incorrect
<region>or<your-ingestion-key>will silently drop all data. Double-check against your SigNoz Cloud settings - Check both exporters are set -
OTEL_METRICS_EXPORTERcontrols metrics andOTEL_LOGS_EXPORTERcontrols events. If only one is set, the other signal will not appear - Try a console exporter - Set
OTEL_METRICS_EXPORTER=consoleandOTEL_LOGS_EXPORTER=consoleto confirm Claude Code is generating telemetry locally before sending to SigNoz - Wait for the export interval - The default metrics export interval is 60 seconds. During setup, set
OTEL_METRIC_EXPORT_INTERVAL=10000to flush every 10 seconds instead - Confirm env vars are set before launch - Environment variables must be set before launching
claudeorcode .. Variables exported after launch have no effect
FAQs
Does Claude Code have built-in monitoring?
A. Yes. Claude Code has native OpenTelemetry support that you opt into by setting CLAUDE_CODE_ENABLE_TELEMETRY=1. Once enabled, it emits metrics (token usage, costs, session counts, lines of code, commits) and structured log events (API requests, tool executions, permission decisions) via the standard OTLP protocol to any compatible backend including SigNoz.
How do I track Claude Code token usage?
A. Claude Code emits a claude_code.token.usage metric after every API request, broken down by type (input, output, cacheRead, cacheCreation), model, and query_source. In SigNoz, filter this metric by user or model to see exactly where tokens are going. See the Telemetry Data section for the full attribute list.
Can I monitor Claude Code costs with OpenTelemetry?
A. Yes. The claude_code.cost.usage metric tracks estimated USD cost per API request and includes attributes for model, agent.name, skill.name, and query_source, so you can break down spend by team, model, or workflow. Note that these are approximations — for billing data, refer to your Anthropic Console or cloud provider.
How do I monitor Claude Code across an entire team?
A. Use the Administrator Configuration section to deploy a managed settings file (managed-settings.json) via MDM or your device management solution. This sets CLAUDE_CODE_ENABLE_TELEMETRY=1 and the SigNoz endpoint centrally for all users, without requiring each developer to configure env vars individually.
What is the difference between Claude Code metrics and events?
A. Metrics (like claude_code.token.usage and claude_code.cost.usage) are numeric time-series data, ideal for dashboards, aggregations, and alerts. Events (like claude_code.api_request and claude_code.tool_result) are structured log records emitted per action, ideal for audit trails, debugging, and tracing individual sessions. Both are exported via OpenTelemetry but require separate exporter configuration (OTEL_METRICS_EXPORTER vs OTEL_LOGS_EXPORTER).
Related Articles
A practical walkthrough of how to connect Claude Code's monitoring hooks with OpenTelemetry and visualize usage, costs, and performance in SigNoz dashboards.
Learn how to track output-per-token ratios across commits, PRs, and lines of code to detect whether Claude Code's efficiency is degrading over time.