Overview
This guide walks you through setting up monitoring and observability for Claude Agent SDK using OpenTelemetry and exporting logs, traces, and metrics to SigNoz. With this integration, you can observe the performance of various models, capture request/response details, and track system-level metrics in SigNoz, giving you real-time visibility into latency, error rates, and usage trends for your Claude Code SDK applications.
Instrumenting Claude Agent SDK in your AI applications with telemetry ensures full observability across your agent workflows, making it easier to debug issues, optimize performance, and understand user interactions. By leveraging SigNoz, you can analyze correlated traces, logs, and metrics in unified dashboards, configure alerts, and gain actionable insights to continuously improve reliability, responsiveness, and user experience.
Prerequisites
- A SigNoz Cloud account with an active ingestion key or Self Hosted SigNoz instance
- Python 3.10+ with
claude-agent-sdkinstalled - For Python:
pipinstalled for managing Python packages - An Anthropic API account with a working API Key
Monitoring Claude Agent SDK
For more information on monitoring Claude Agent SDK with OpenTelemetry, refer to the official Claude Agent SDK observability documentation.
Step 1: Install the necessary packages in your Python environment.
pip install claude-agent-sdk
Step 2: Configure OpenTelemetry environment variables
export CLAUDE_CODE_ENABLE_TELEMETRY=1
export CLAUDE_CODE_ENHANCED_TELEMETRY_BETA=1
export OTEL_SERVICE_NAME=<service_name>
export OTEL_TRACES_EXPORTER=otlp
export OTEL_METRICS_EXPORTER=otlp
export OTEL_LOGS_EXPORTER=otlp
export OTEL_EXPORTER_OTLP_PROTOCOL="http/protobuf"
export OTEL_EXPORTER_OTLP_ENDPOINT=https://ingest.<region>.signoz.cloud:443
export OTEL_EXPORTER_OTLP_HEADERS=signoz-ingestion-key=<your-ingestion-key>
<service_name>: The name of your service<region>: Your SigNoz Cloud region<your-ingestion-key>: Your SigNoz ingestion key
Using self-hosted SigNoz? Most steps are identical. To adapt this guide, update the endpoint and remove the ingestion key header as shown in Cloud → Self-Hosted.
Step 3: Create an example Claude Agent SDK workflow
import asyncio
from claude_agent_sdk import query

async def main():
    async for message in query(
        prompt="List the files in this directory"
    ):
        print(message)

asyncio.run(main())
📌 Note: Before running this code, ensure that you have set the environment variable
ANTHROPIC_API_KEYwith your generated API key.
Step 4: Run your application
In this case:
python main.py
View Traces, Logs, and Metrics in SigNoz
Your Claude Agent SDK usage should now automatically emit traces, logs, and metrics.
You should be able to view traces in Signoz Cloud under the traces tab:

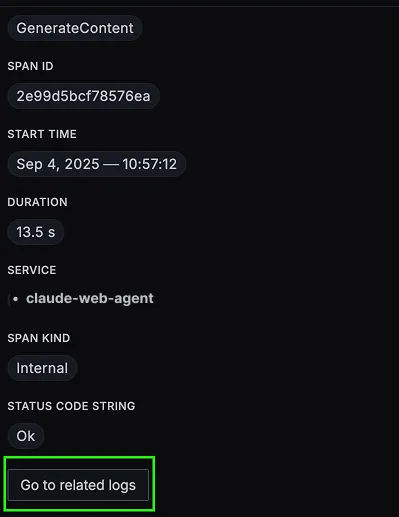
When you click on a trace in SigNoz, you'll see a detailed view of the trace, including all associated spans, along with their events and attributes.

You should be able to view logs in Signoz Cloud under the logs tab. You can also view logs by clicking on the “Related Logs” button in the trace view to see correlated logs:

When you click on any of these logs in SigNoz, you'll see a detailed view of the log, including attributes:

You should be able to see Claude Agent SDK related metrics in Signoz Cloud under the metrics tab:

When you click on any of these metrics in SigNoz, you'll see a detailed view of the metric, including attributes:

Troubleshooting
If you don't see your telemetry data:
- Verify network connectivity - Ensure your application can reach SigNoz Cloud endpoints
- Check ingestion key - Verify your SigNoz ingestion key is correct
- Wait for data - OpenTelemetry batches data before sending, so wait 10-30 seconds after making API calls
- Try a console exporter — Enable a console exporter locally to confirm that your application is generating telemetry data before it’s sent to SigNoz
Next Steps
You can also check out our custom Claude Agent SDK dashboard here which provides specialized visualizations for monitoring your Claude Agent SDK usage in applications. The dashboard includes pre-built charts specifically tailored for LLM usage, along with import instructions to get started quickly.

Additional resources:
- Set up alerts for high latency or error rates
- Learn more about querying traces
- Explore log correlation
