The Meter Explorer provides advanced capabilities to analyze and understand your observability costs through detailed meter metrics. With the powerful SigNoz query interface, you can drill deeper into each meter metric to extract meaningful insights about your ingested telemetry data and optimize your observability spend.
What you'll learn:
- How to query and analyze meter metrics for cost insights
- Understanding the structure and components of meter data
- How to break down signal meter data by specific label dimensions
- Creating saved views for recurring cost analysis
Overview
Meter Explorer enables you to monitor and control your observability costs by providing granular visibility into your telemetry data ingestion patterns. By leveraging the familiar SigNoz query interface, you can analyze meter metrics to understand consumption trends, identify cost drivers, and make informed decisions about your observability strategy.
Prerequisites
Before using Meter Explorer, ensure you have:
- Familiarity with how metrics work in SigNoz
- A running SigNoz instance with telemetry data being ingested
- Understanding of the SigNoz query interface (helpful but not required)
Understanding Meter Metrics
Meter metrics provide detailed information about your telemetry data ingestion, helping you understand consumption patterns and costs. Let's explore the structure and components of meter data.
Namespace
All meter data exposed by SigNoz follows a consistent namespace pattern and is queryable through the standard metrics interface. Each meter metric is namespaced with signoz.meter and follows standard metric aggregation patterns.
Available Metrics
SigNoz exposes five core meter metrics that provide comprehensive visibility into your telemetry data ingestion:
| Metric Name | Description | Type | Temporality |
|---|---|---|---|
signoz.meter.log.count | Total number of log records ingested | Sum | Delta |
signoz.meter.log.size | Total size of log records ingested (in bytes) | Sum | Delta |
signoz.meter.span.count | Total number of spans ingested | Sum | Delta |
signoz.meter.span.size | Total size of spans ingested (in bytes) | Sum | Delta |
signoz.meter.metric.datapoint.count | Total number of metric datapoints ingested | Sum | Delta |
Metric Labels
Each meter metric includes a fixed set of labels that enable you to slice and dice your data across different dimensions:
service.name: The name of the service generating the telemetry datadeployment.environment: The deployment environment (e.g., production, staging, development)host.name: The hostname of the system generating the datasignoz.workspace.key.id: The ID of the ingestion key used for ingesting telemetry data
These labels allow you to analyze your metering data across multiple dimensions, helping you identify which services, environments, or hosts are contributing most to your observability costs.
Data Retention
Meter data is retained for a period of 1 year. This retention policy ensures that you have access to historical data for long-term analysis and trend identification. By maintaining a year-long history, you can make more informed decisions about your observability strategy and cost optimization efforts over time.
Querying Meter Data
Meter Explorer uses the same powerful query interface as other SigNoz components, making it easy to analyze your cost data with familiar patterns and syntax.
Time Range Considerations
Important: Meter data is aggregated over hourly intervals. Queries with time ranges under 1 hour will not return any data. For real-time analysis, use time ranges of 1 hour or greater.
Query Patterns
The querying patterns for meter data are identical to standard metric querying patterns. You can use the same operators, functions, and syntax that you're familiar with from other SigNoz metrics.
For detailed information about metric querying, refer to our Metrics Management Guide.
Example Queries
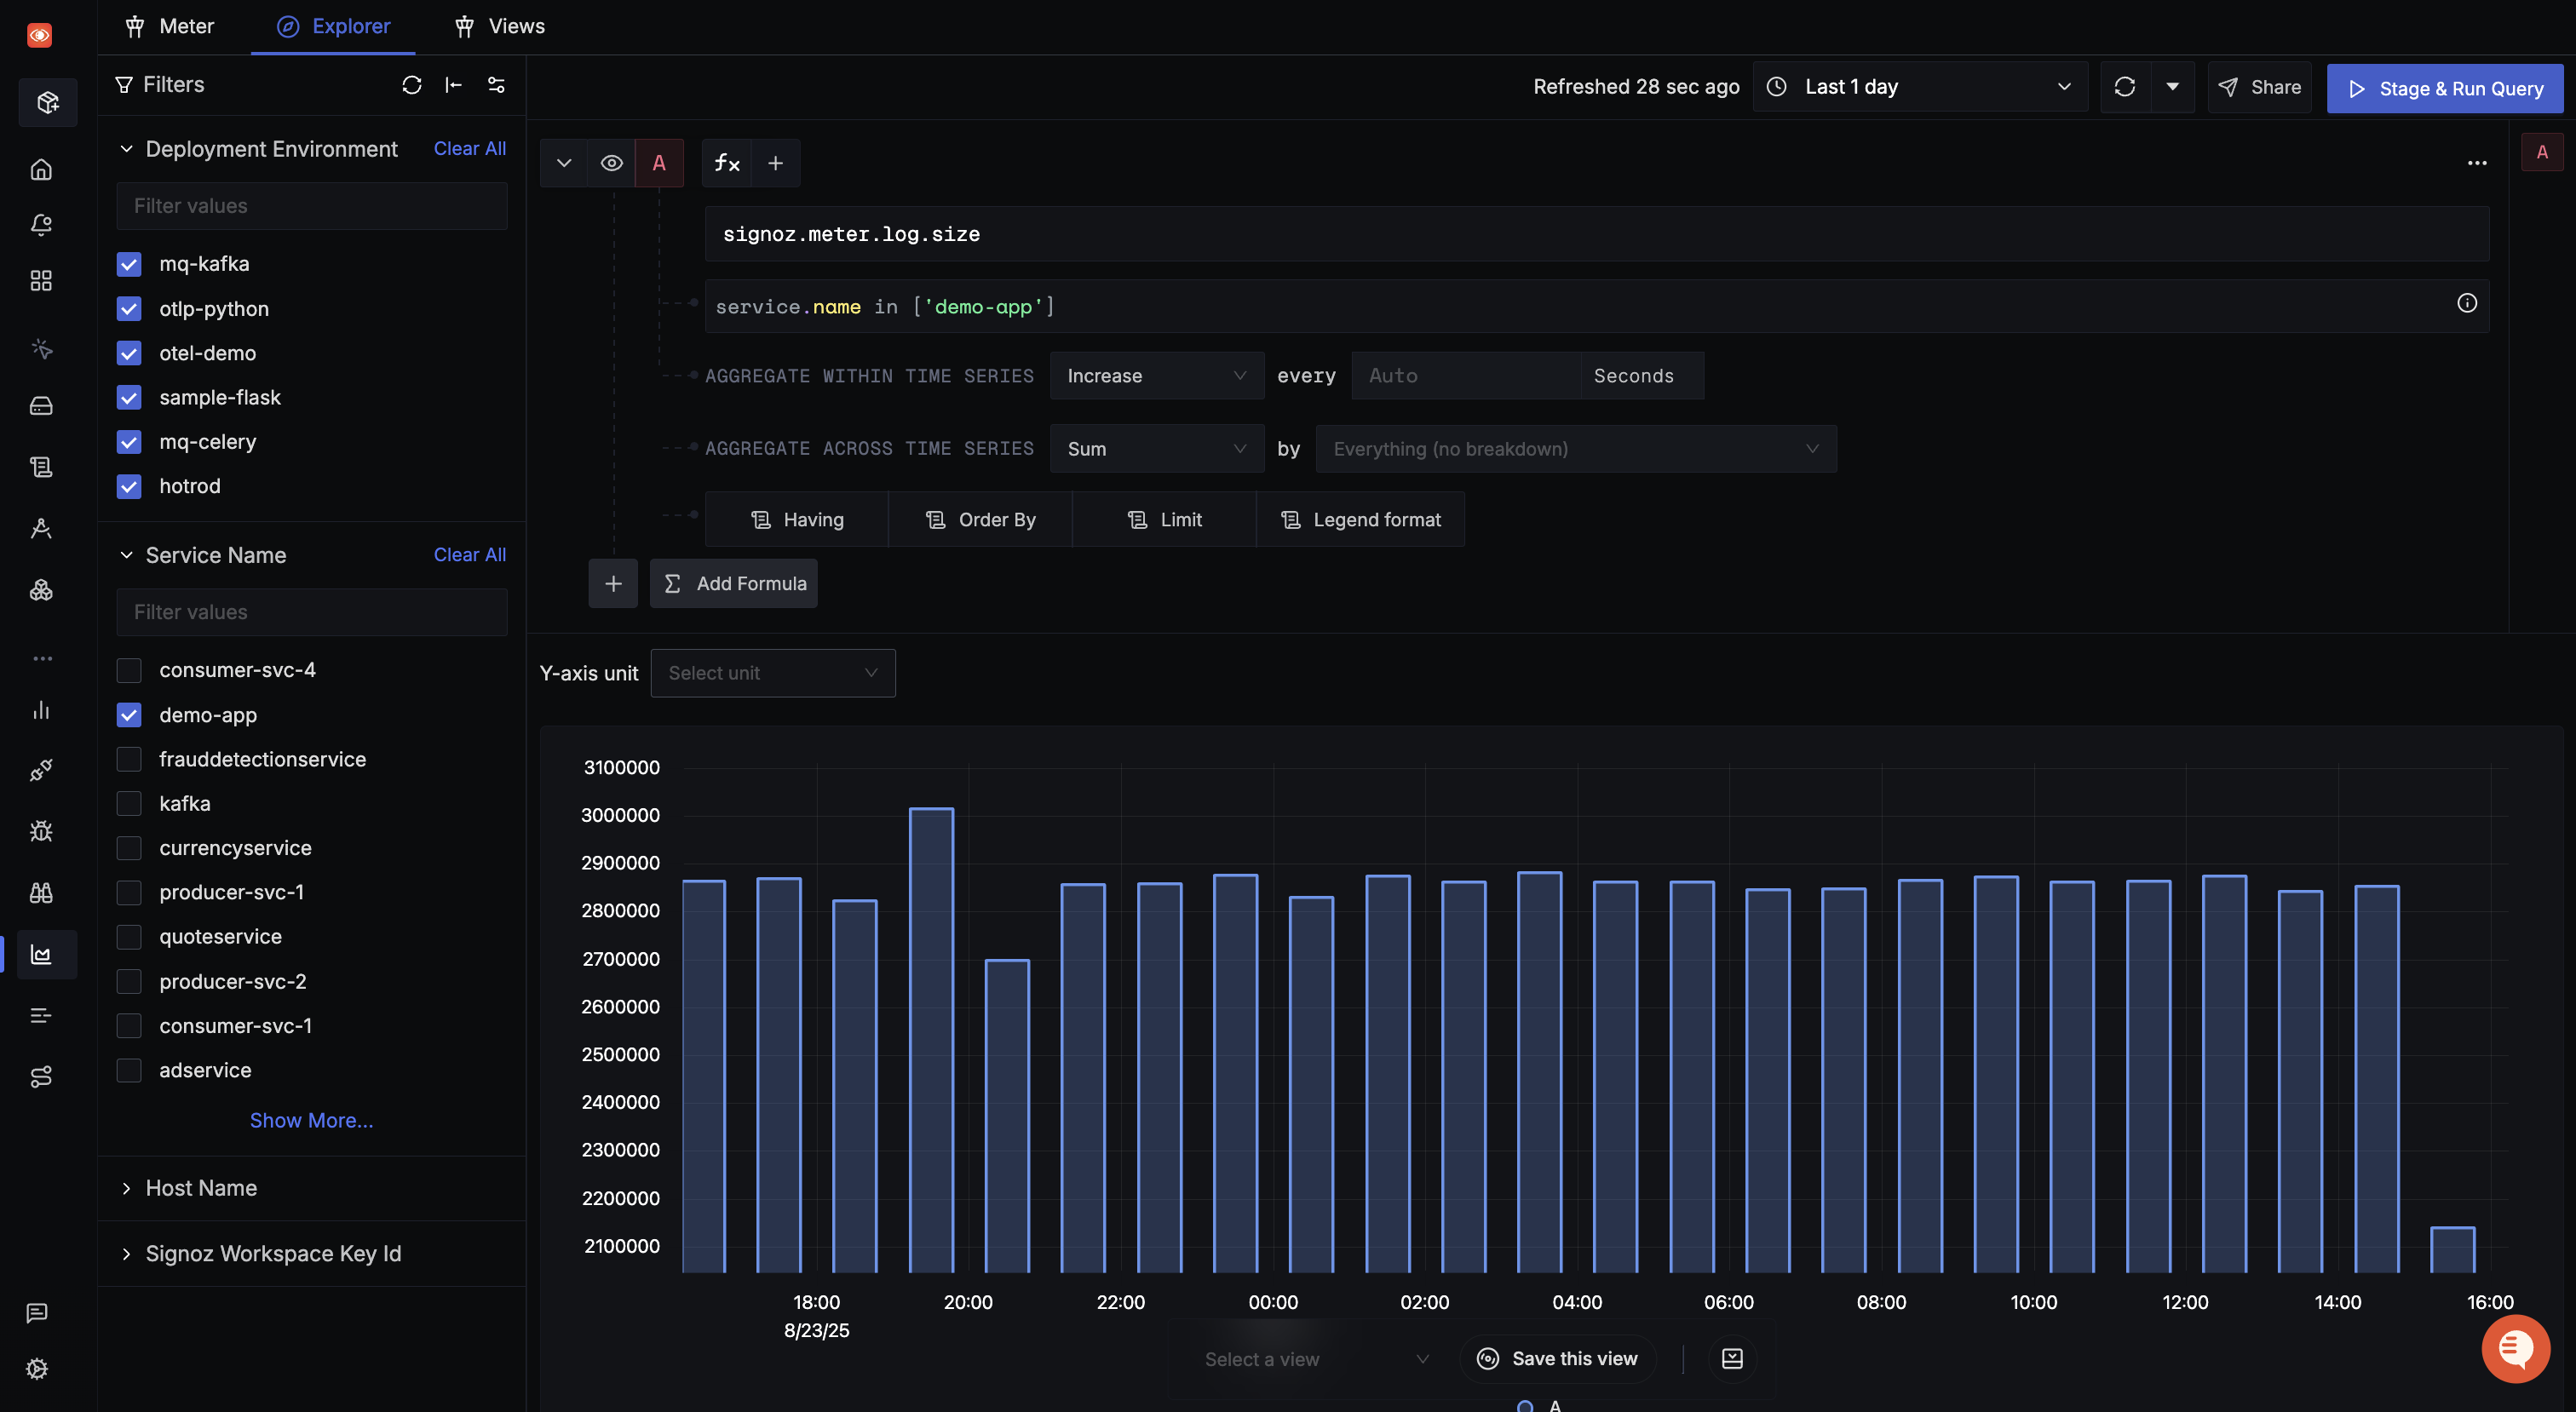
1. Log Size Analysis by Service
To find the total size of log records ingested by a specific service over the last day:
signoz.meter.log.size{service.name="demo-app"}
This query will show you the total log size for the demo-app service, helping you understand which services are generating the most log data.
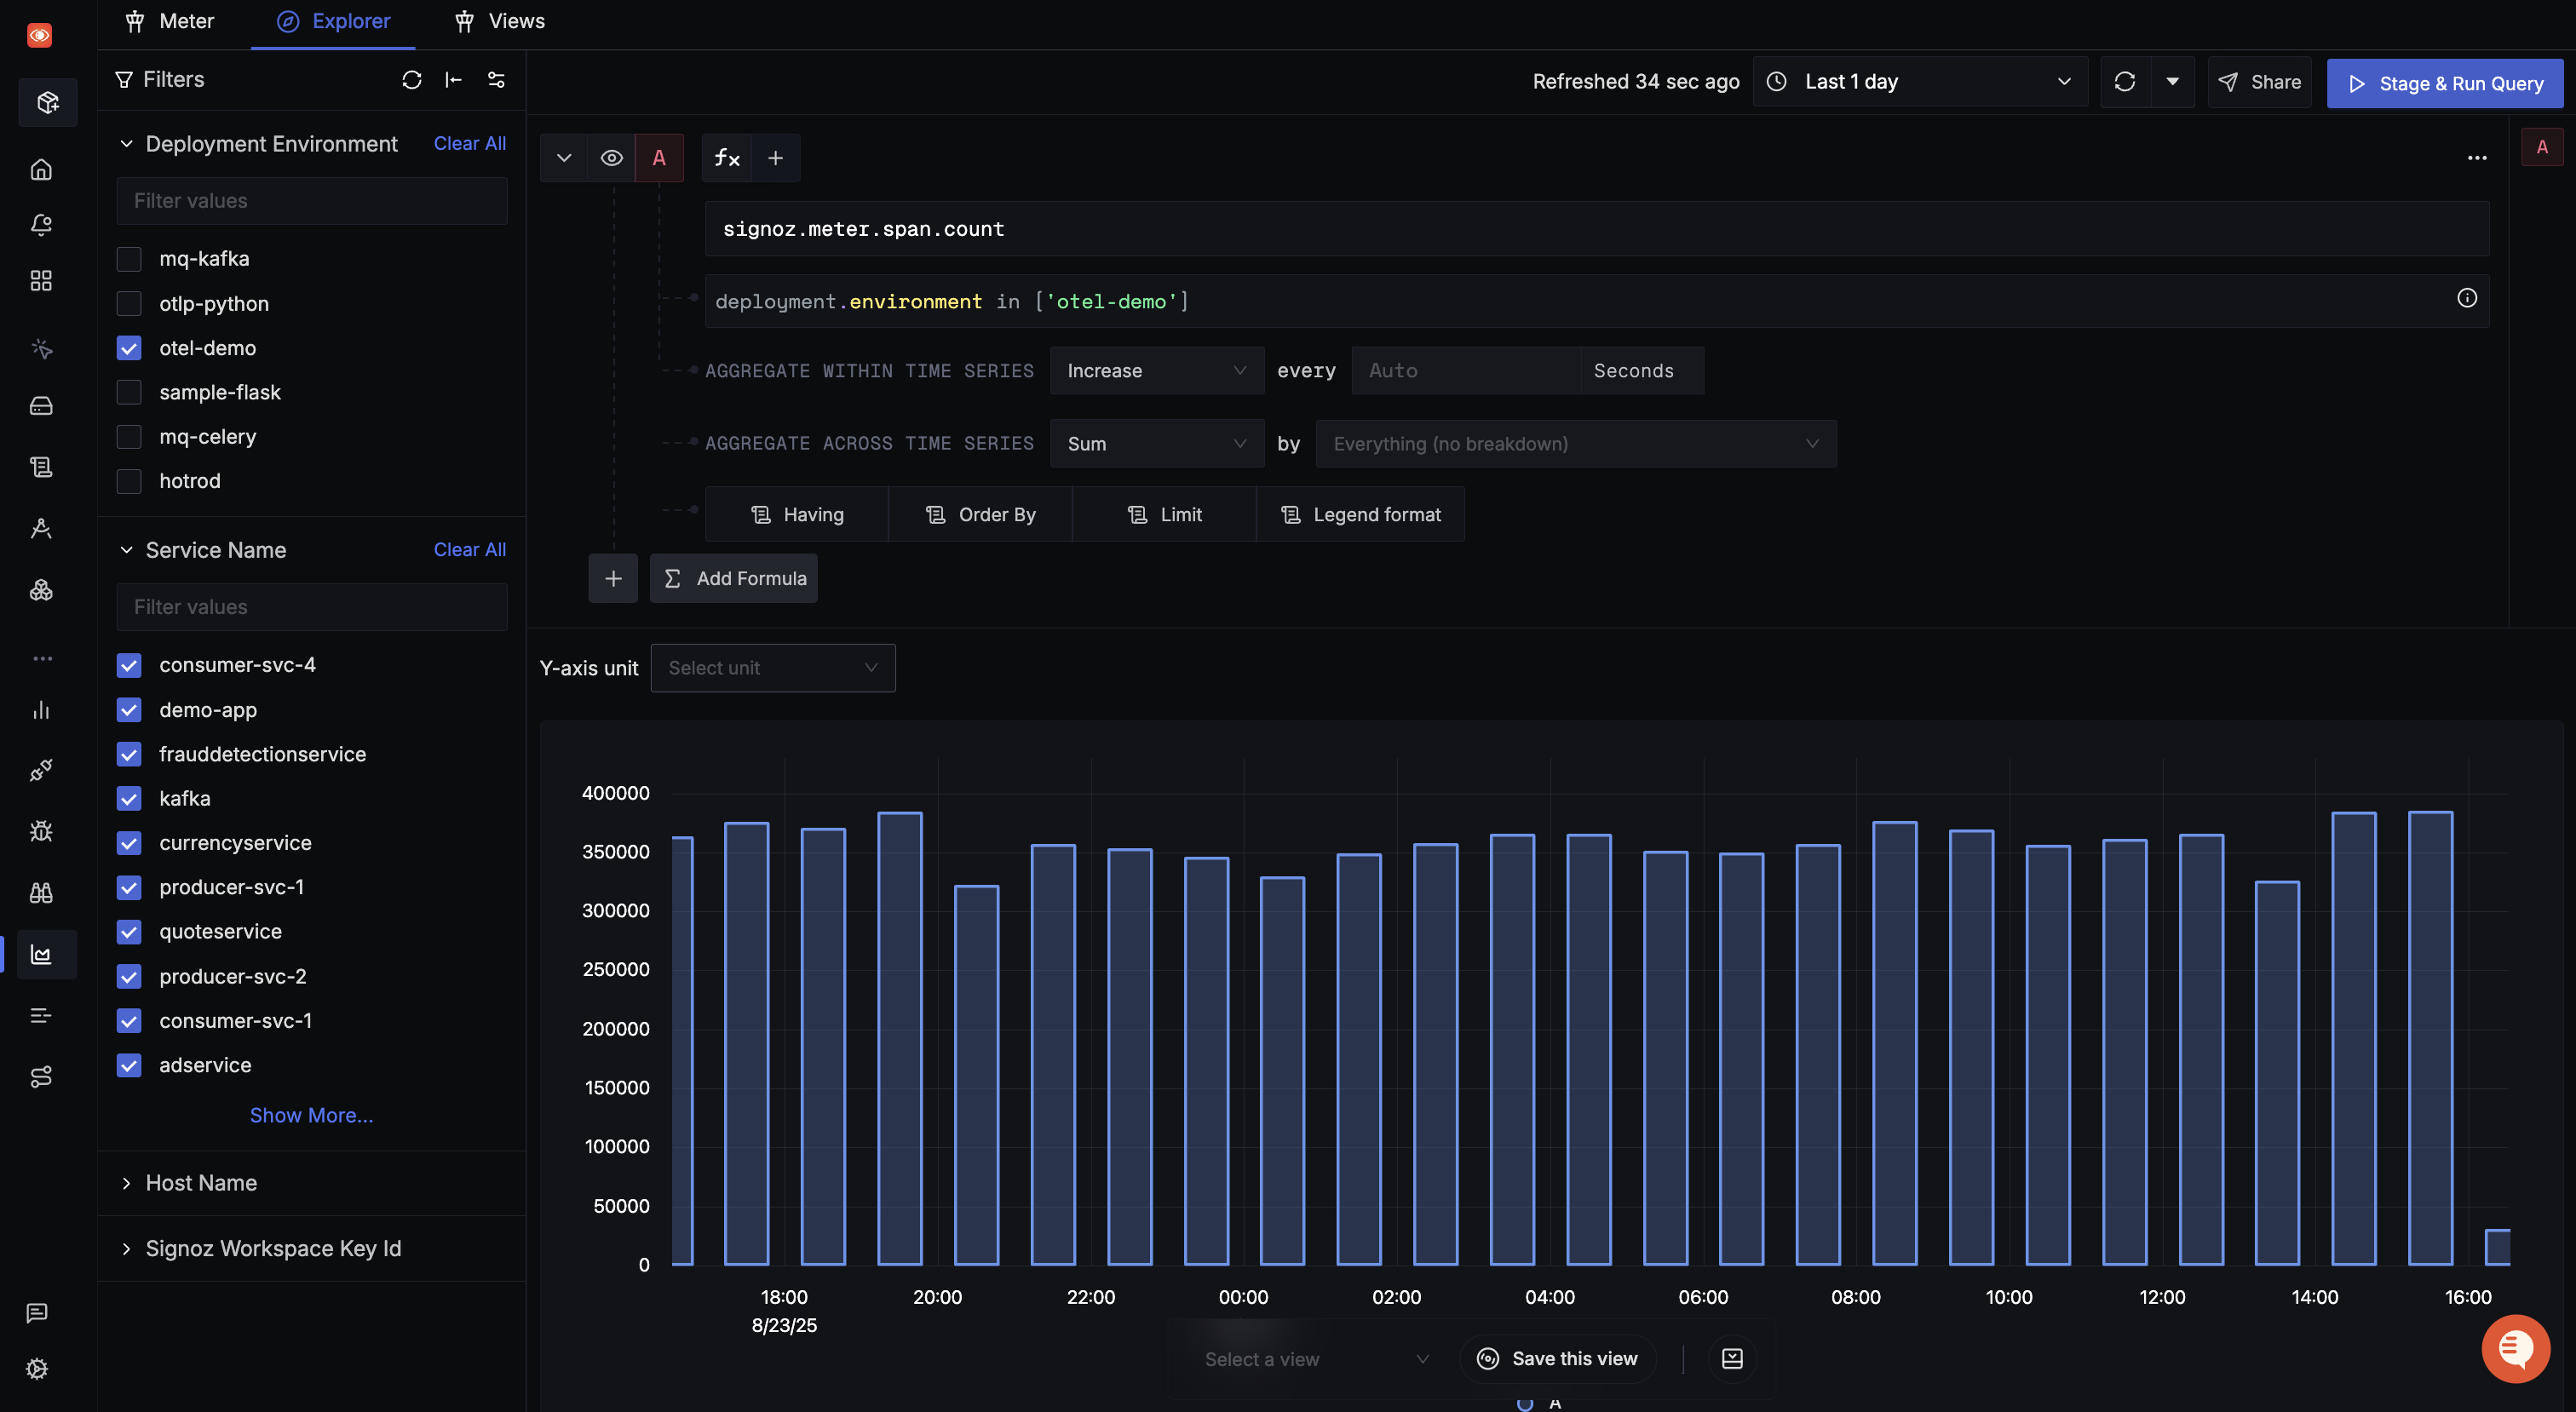
2. Span Count by Environment
To analyze span ingestion across different environments:
signoz.meter.span.count{deployment.environment="otel-demo"}
This helps you understand the volume of trace data being generated in your environment.
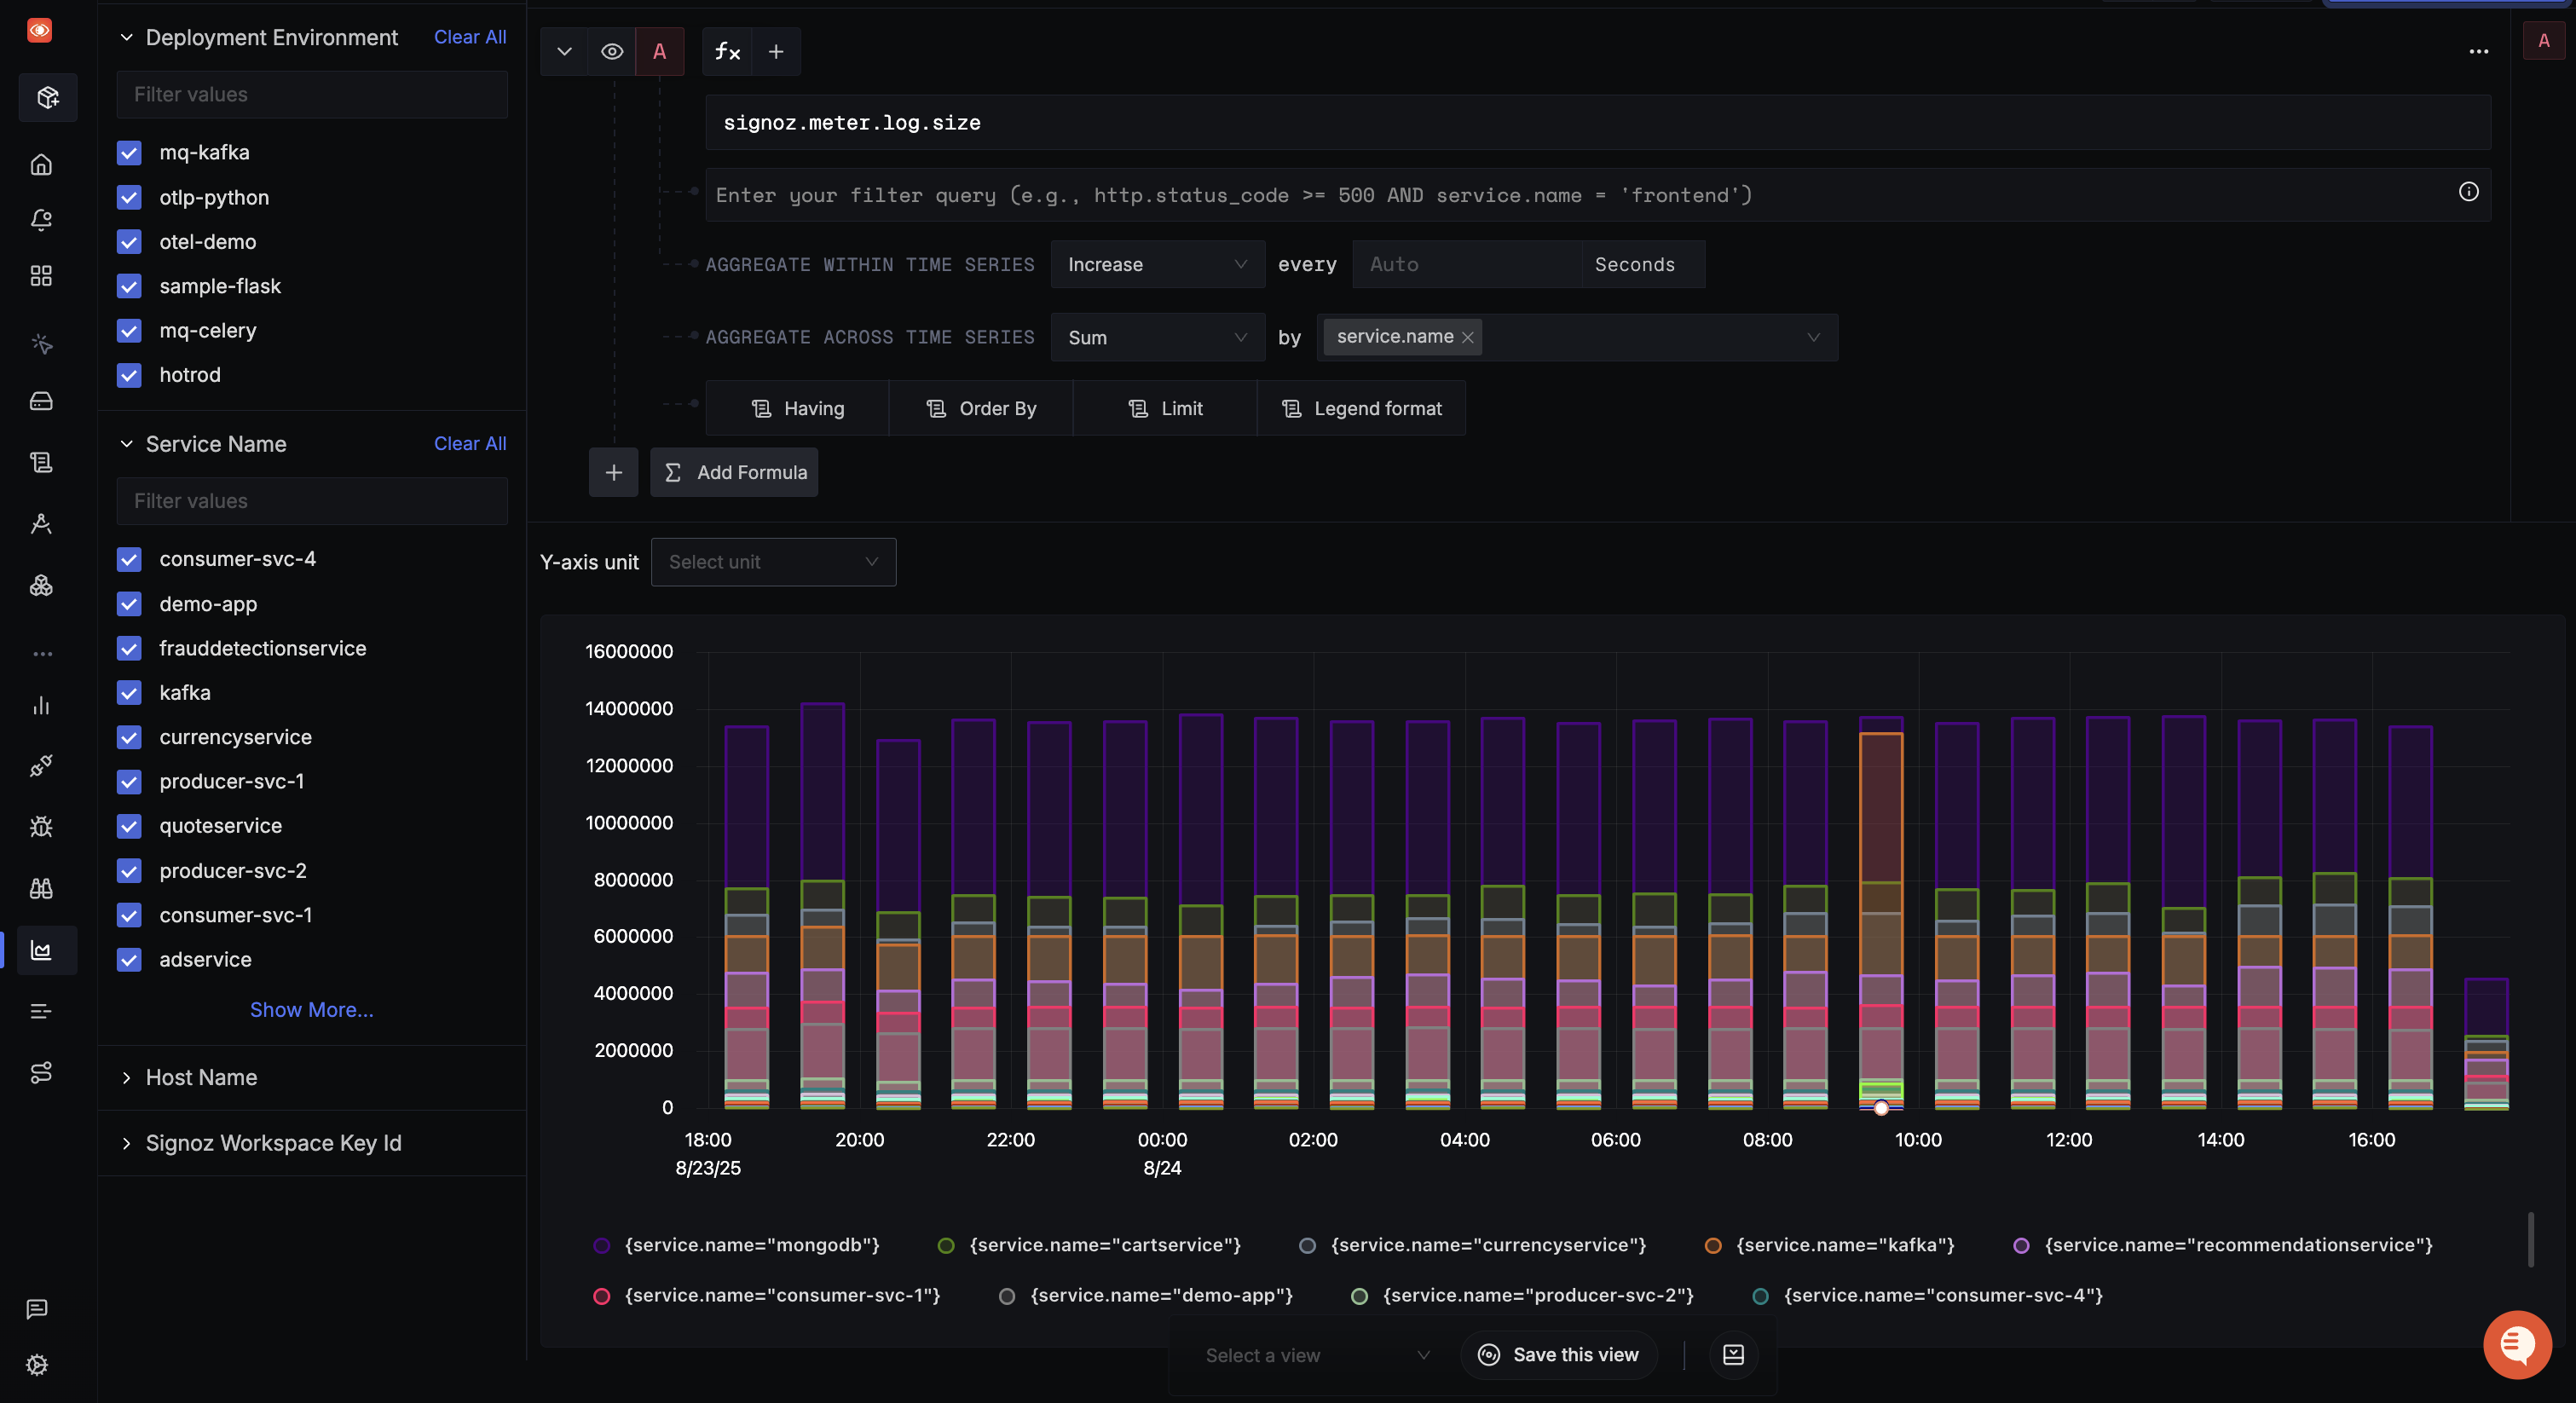
3. Multi-Service Cost Comparison
To compare log ingestion across multiple services:
signoz.meter.log.size{group-by:service.name}
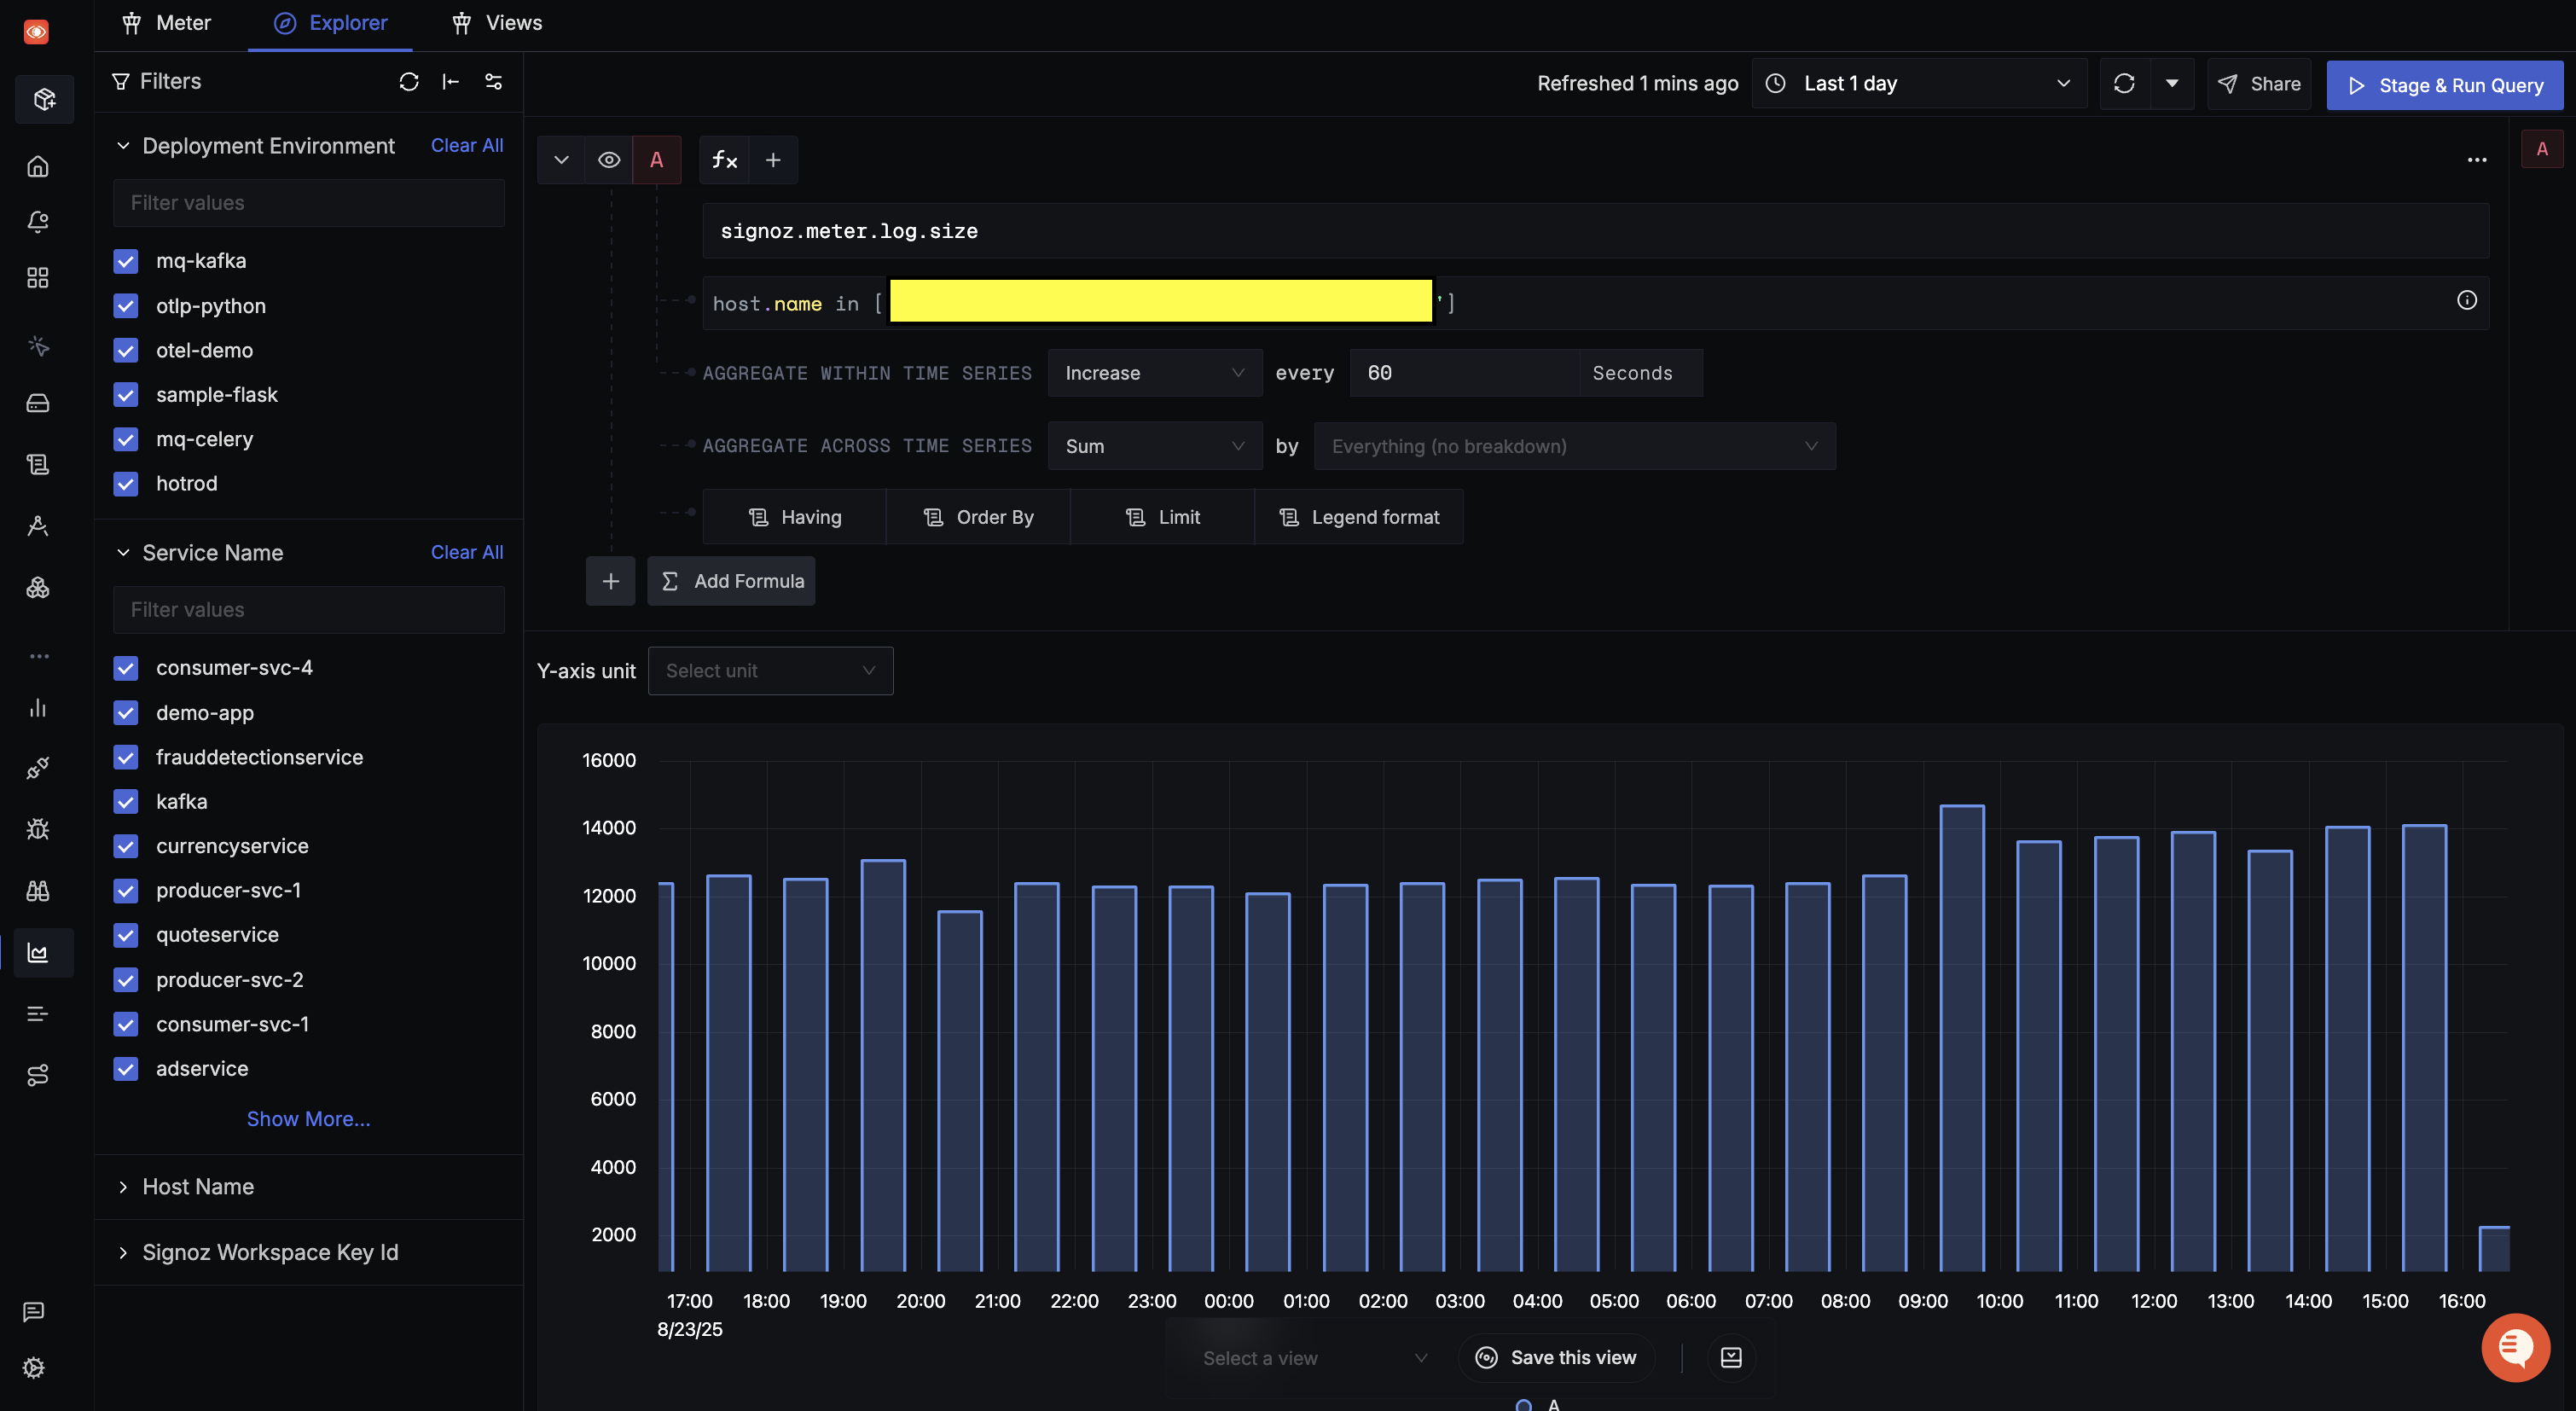
4. Host-Level Analysis
To identify which hosts are generating the most telemetry data:
signoz.meter.log.size{host.name = "x"}
This aggregation helps you identify hosts that might be generating excessive log data.
5. Ingestion ID-Based Analysis
To analyze telemetry data based on specific ingestion IDs:
signoz.meter.log.size{signoz.workspace.key.id = "01963e56-0bbb-7df5-b26c-2c4aa48b291a"}
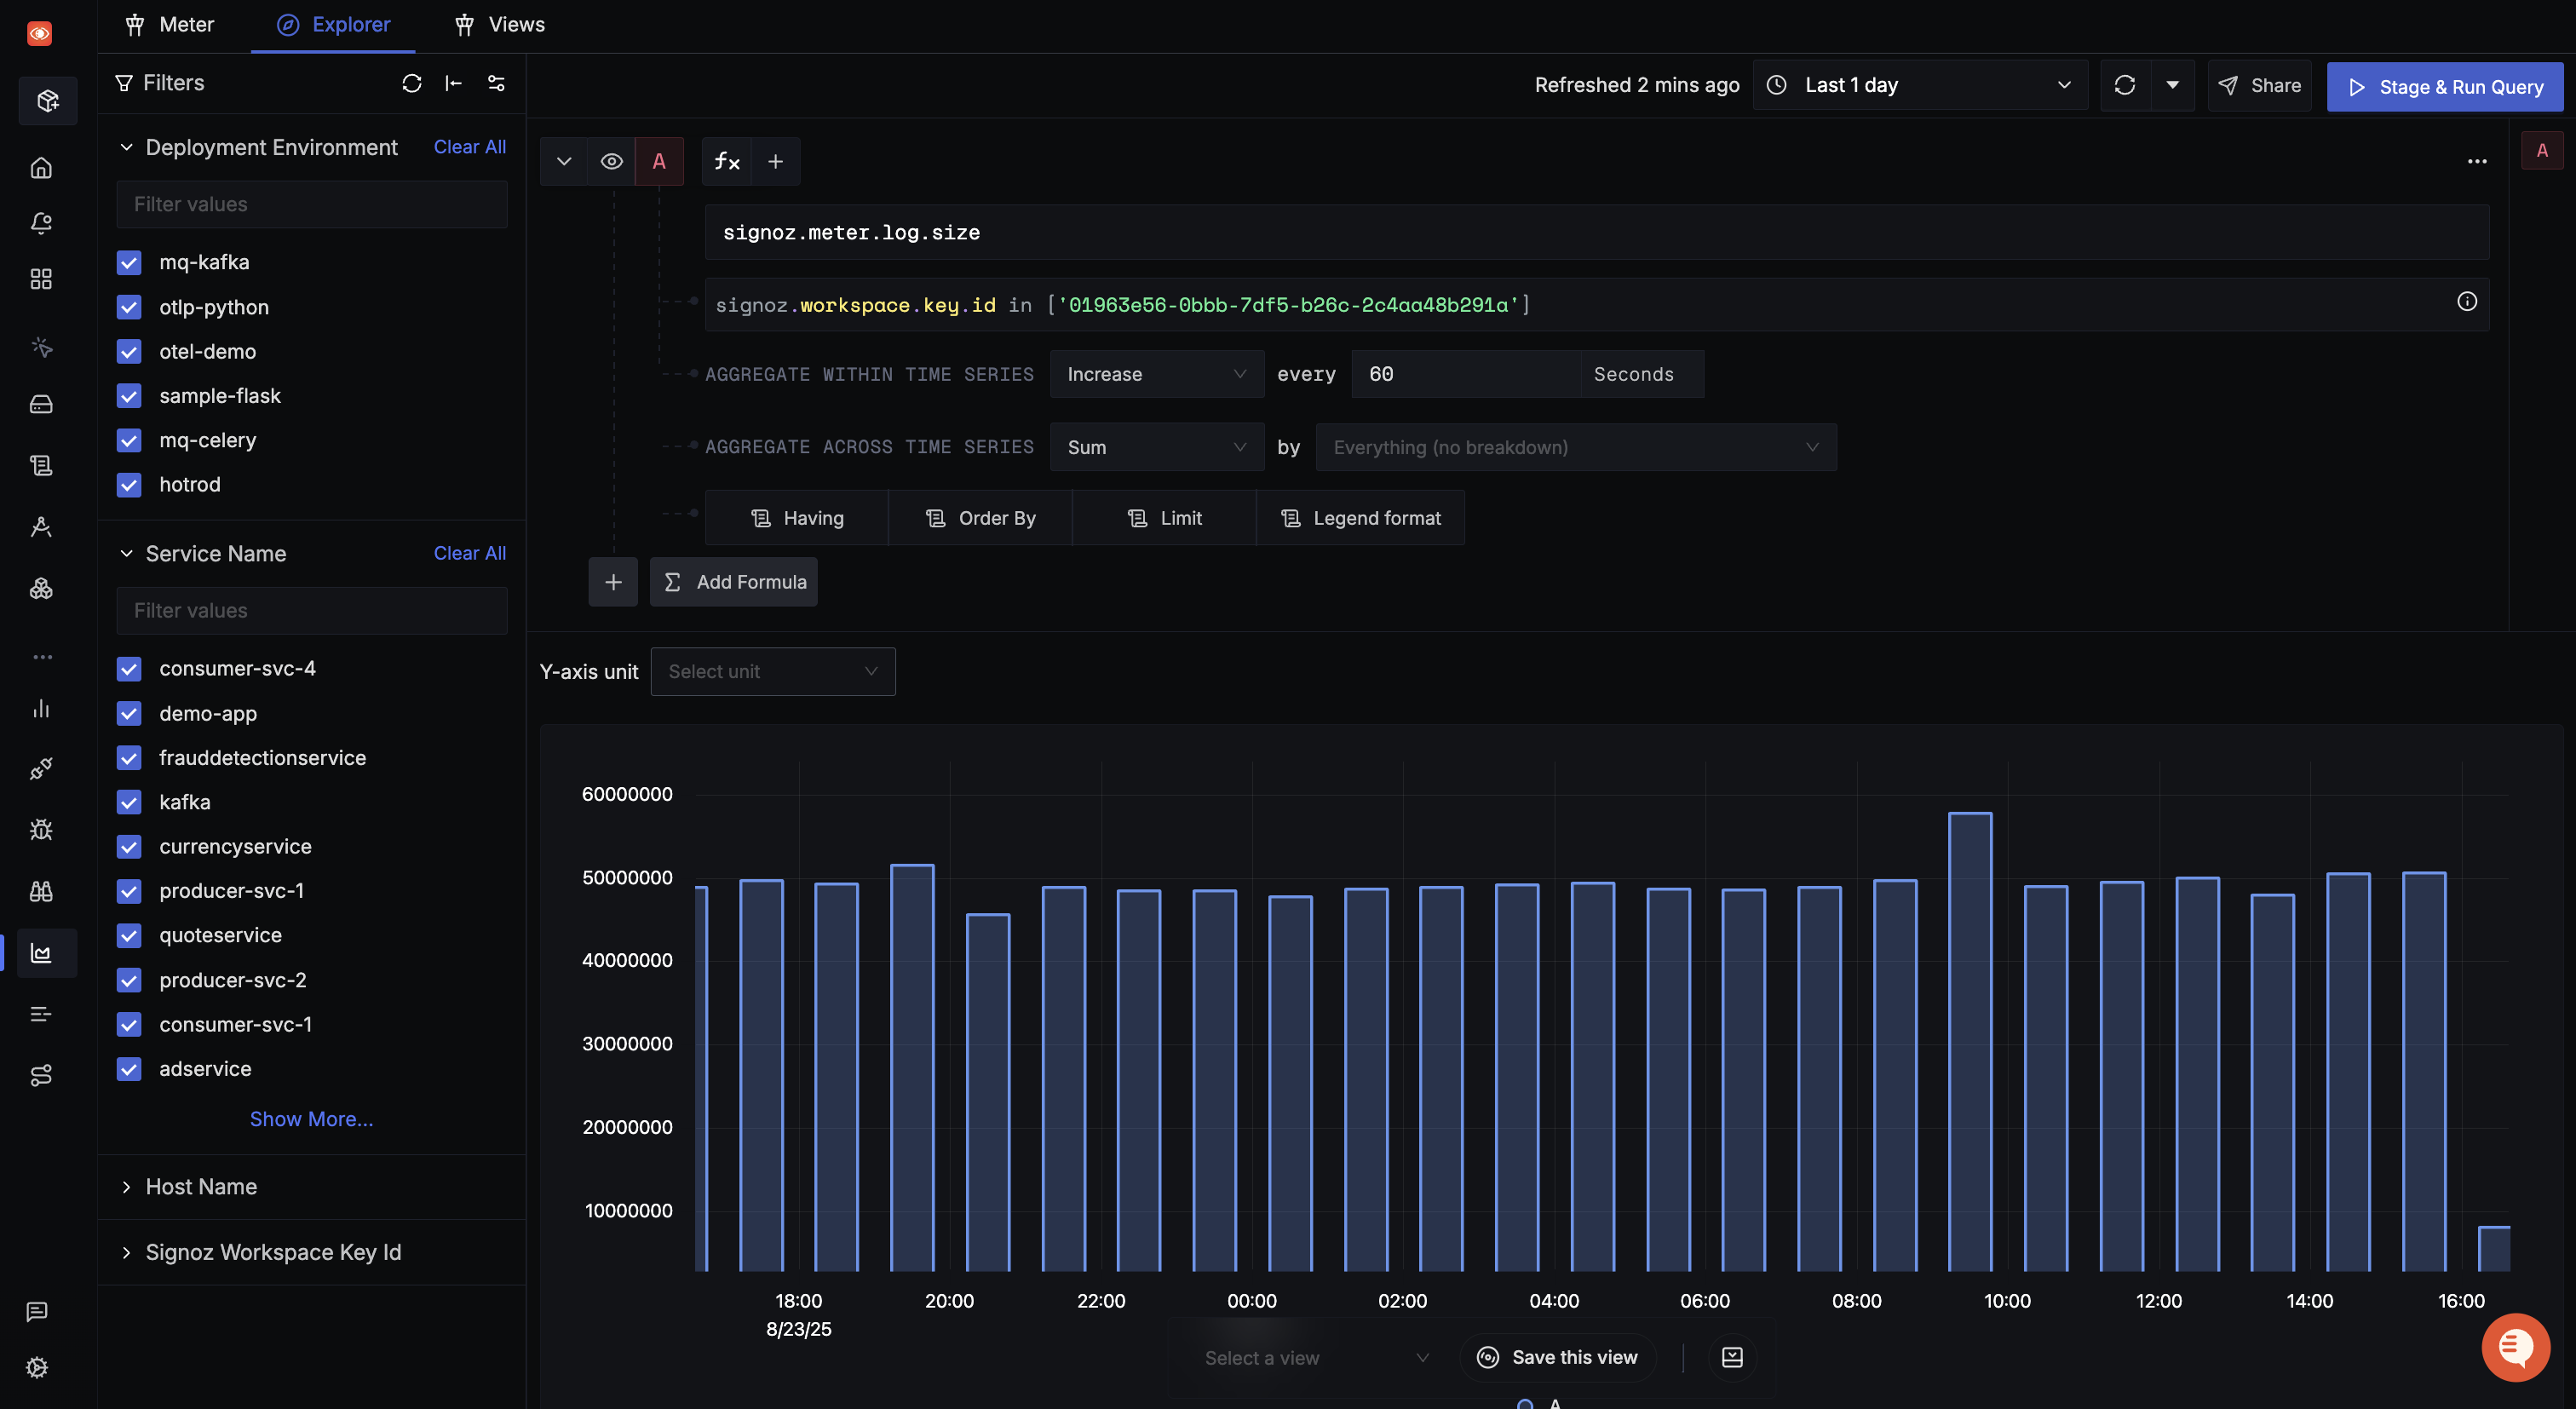
Example: Log size analysis for ingestion key id: 01963e56-0bbb-7df5-b26c-2c4aa48b291a over the last day
Creating Saved Views
Meter Explorer supports saved views, allowing you to create and reuse common queries for recurring cost analysis.
You can checkout the Saved View Documentation for more details on creating and managing saved views.
For additional support and discussion, visit our Community Forum. For advanced topics and comprehensive guides, explore our Documentation.
