This dashboard provides comprehensive monitoring of OpenAI Codex usage patterns, performance metrics, and team adoption, offering detailed visibility into token consumption, costs, success rates, developer engagement, and resource utilization for optimal AI-assisted development workflow monitoring.
To use this dashboard, you need to set up the data source and send telemetry to SigNoz. Follow the OpenAI Codex Monitoring guide to get started.
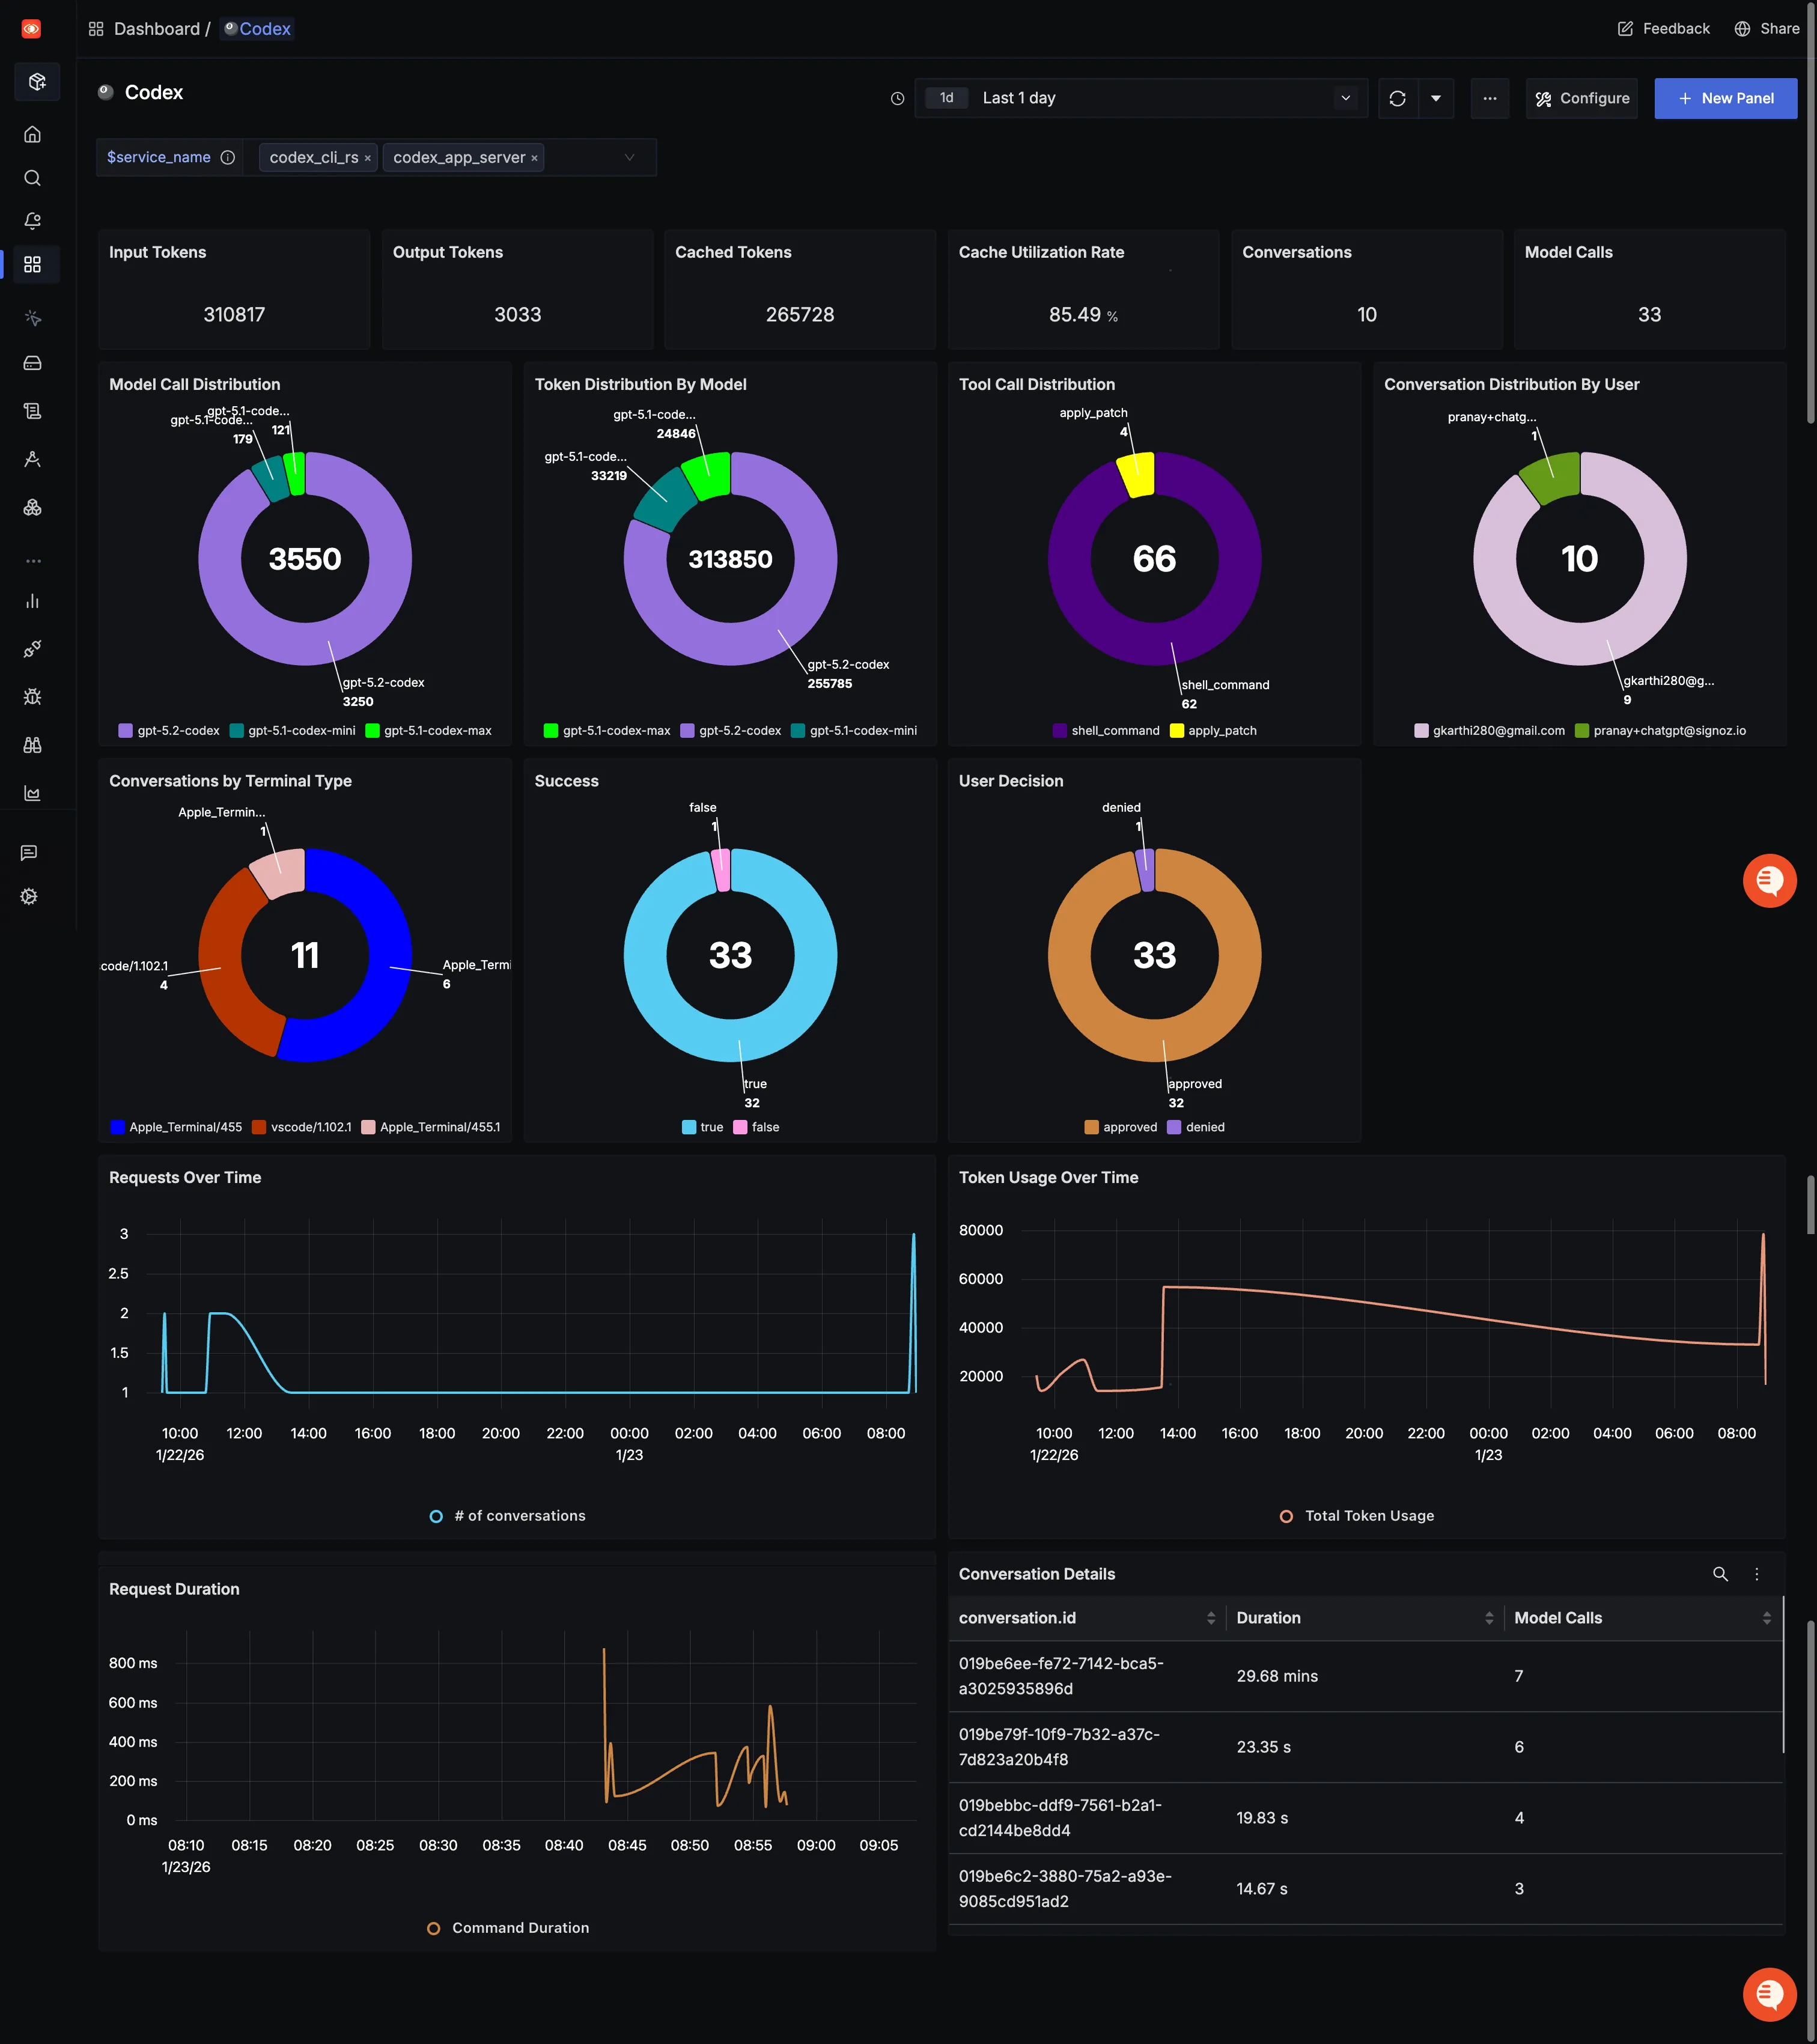
Dashboard Preview
Dashboards → + New dashboard → Import JSON
What This Dashboard Monitors
This comprehensive dashboard provides deep visibility into OpenAI Codex usage patterns and performance metrics across your development teams. It enables you to:
- Monitor AI Usage Costs: Track token consumption and associated costs to optimize budget allocation
- Measure Team Adoption: Understand how developers are engaging with OpenAI Codex across different environments
- Performance Monitoring: Track response times, success rates, and system reliability
- Usage Analytics: Analyze which tools, models, and features are most valuable to your team
- Resource Management: Monitor quota usage and prevent service interruptions
Metrics Included
Total Token Usage (Input & Output) (Numerical panel)
Tokens are the currency of AI coding assistants. By splitting input tokens (developer prompts) and output tokens (Codex's responses), this panel shows exactly how much work Codex is doing. Over time, you can see whether usage is ramping up, stable, or dropping off—and keep an eye on efficiency.
Cached Tokens (Numerical Panel)
Cached tokens show how much of the prompt or context was served from cache instead of recomputed. Higher cached usage usually means faster responses and lower costs.
Cache Utilization Rate (Numerical Panel)
This measures the percentage of total tokens that were cached. It's a quick health check for whether caching is working as expected and improving efficiency.
Conversations and Model Calls (Numerical panel)
This panel tracks how many conversations and model calls are happening. Conversations show how often developers are turning to Codex, while model calls capture depth of interaction. Together, they reveal adoption and engagement.
Command Duration (P95) (Time series line chart)
How long do Codex-assisted commands actually take? This chart tracks the 95th percentile duration, helping you catch slowdowns, spikes, or performance regressions. Developers want Codex to be fast—this view keeps latency in check.
Token Usage Over Time (Time series line chart)
Instead of looking at total tokens in a snapshot, this time series shows usage trends. Are developers spiking usage during sprints? Is there a steady upward adoption curve? This view is perfect for spotting both growth and anomalies.
Success Rate of Requests (Pie chart)
Not every request to Codex is successful. This panel highlights how often requests succeed vs. fail, helping you spot reliability issues—whether from the model, connectivity, or developer inputs. A healthy success rate means smooth workflows.
Terminal Type (Pie chart)
OpenAI Codex is flexible, but developers use it differently depending on environment. This pie chart shows where developers are working—VS Code, Apple Terminal, or elsewhere. Great for understanding adoption across dev setups.
Requests per User (Pie Chart)
Usage isn't always evenly distributed. This chart breaks down requests by user, making it clear who's leaning on Codex heavily and who's barely touching it. Perfect for identifying champions, training needs, or power users.
Model Distribution (Pie chart)
Codex ships with multiple models, and not all usage is equal. This panel shows which models developers are actually calling. It's a handy way to track preferences and see if newer models are gaining traction.
Token Distribution By Model (Pie Chart)
This panel breaks down token usage by model, not just request counts. It shows which models consume the most tokens and drive the majority of cost.
Tool Types (Pie chart)
Codex can call on different tools like shell_command, apply_patch, and more. This breakdown shows which tools are most frequently used, shining a light on the kinds of coding tasks developers are trusting Codex with.
User Decisions (Pie chart)
AI suggestions only matter if developers use them. This panel tracks accept vs. reject decisions, showing how much developers trust Codex's output. High acceptance is a sign of quality; high rejection is a signal to dig deeper.
