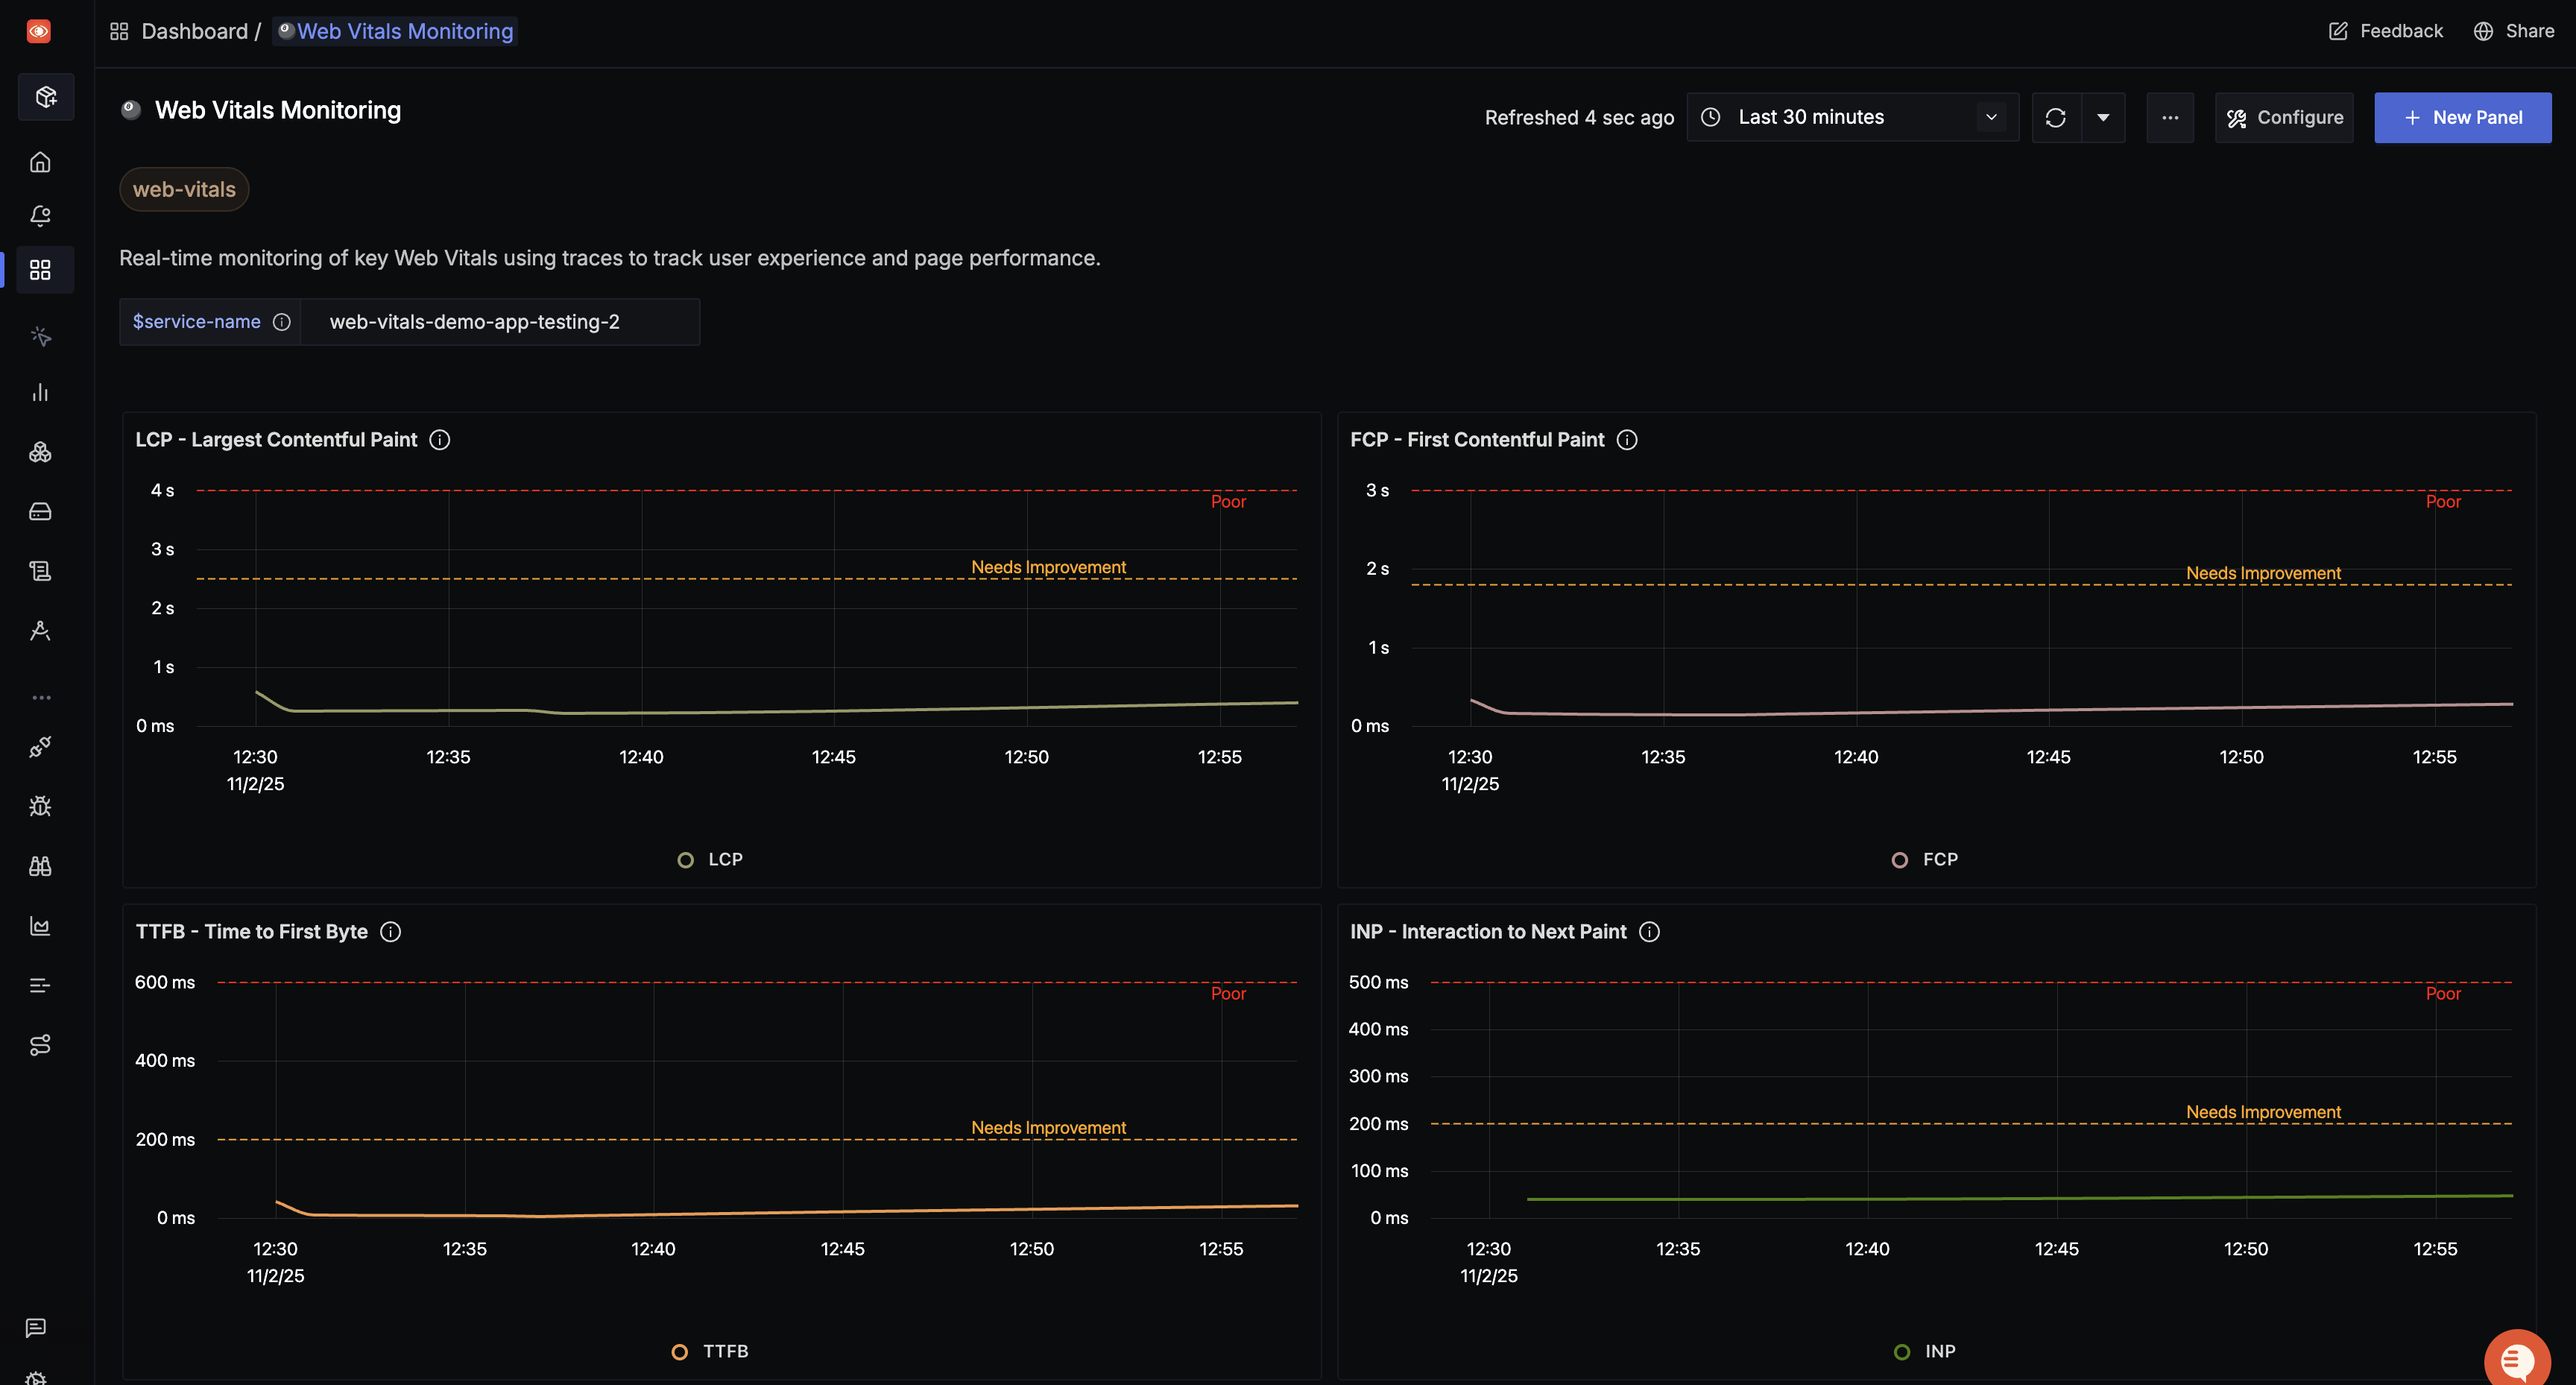
SigNoz provides comprehensive frontend monitoring capabilities through Core Web Vitals tracking. These dashboards help you measure real user experience by capturing essential performance metrics from actual user sessions across your web applications.
Dashboard Preview

Available Dashboard Templates
We provide two dashboard templates based on how you choose to export your web vitals data:
Web Vitals with Metrics
Dashboards → + New dashboard → Import JSON
Best for: Large-scale deployments requiring sampling and aggregated statistical analysis
- Learn how to set up: Web Vitals Monitoring with Metrics
Web Vitals with Traces
Dashboards → + New dashboard → Import JSON
Best for: Debugging specific user issues and detailed performance analysis
- Learn how to set up: Web Vitals Monitoring with Traces
What These Dashboards Monitor
Both dashboard templates track the Core Web Vitals—essential metrics for measuring user experience on your website:
Core Web Vitals
- Largest Contentful Paint (LCP): Measures loading performance. Marks the time when the largest content element becomes visible.
- Interaction to Next Paint (INP): Measures interactivity. Assesses page responsiveness to user interactions.
- Cumulative Layout Shift (CLS): Measures visual stability. Quantifies unexpected layout shifts during page load.
Additional Web Vitals
- Time to First Byte (TTFB): Measures server response time. The time from request to first byte received.
- First Contentful Paint (FCP): Measures when the first content element renders on screen.
Choosing Between Metrics and Traces
Both approaches capture the same web vitals but differ in how they're exported and analyzed:
Metrics Approach
- Ideal for: Production environments with high traffic
- Benefits:
- Efficient aggregation with percentiles and histograms
- Better for trend analysis and alerting
- Supports sampling strategies for cost optimization
- Lower storage requirements
- Use when: You need to monitor overall performance trends across your user base
Traces Approach
- Ideal for: Development and debugging scenarios
- Benefits:
- Granular visibility into individual user experiences
- Easier correlation with other trace data
- Rich context with custom attributes (browser, user ID, device type)
- Better for investigating specific user issues
- Use when: You need detailed insights for troubleshooting or development
Learn more about choosing the right approach: Web Vitals Overview
Dashboard Features
Both dashboard templates include:
- Real-time monitoring: Track web vitals as users interact with your site
- Filtering capabilities: Segment data by page, browser, device, or custom attributes
- Historical trends: Analyze performance changes over time
