Value
Value panels are used to display a single value of a metric, APM, or log.
Data Formats
Supported signals
- Logs
- Traces
- Metrics
This panel type supports any time series data that can be aggregated to a single value. The time series data can be from logs, traces, or metrics.
Setup
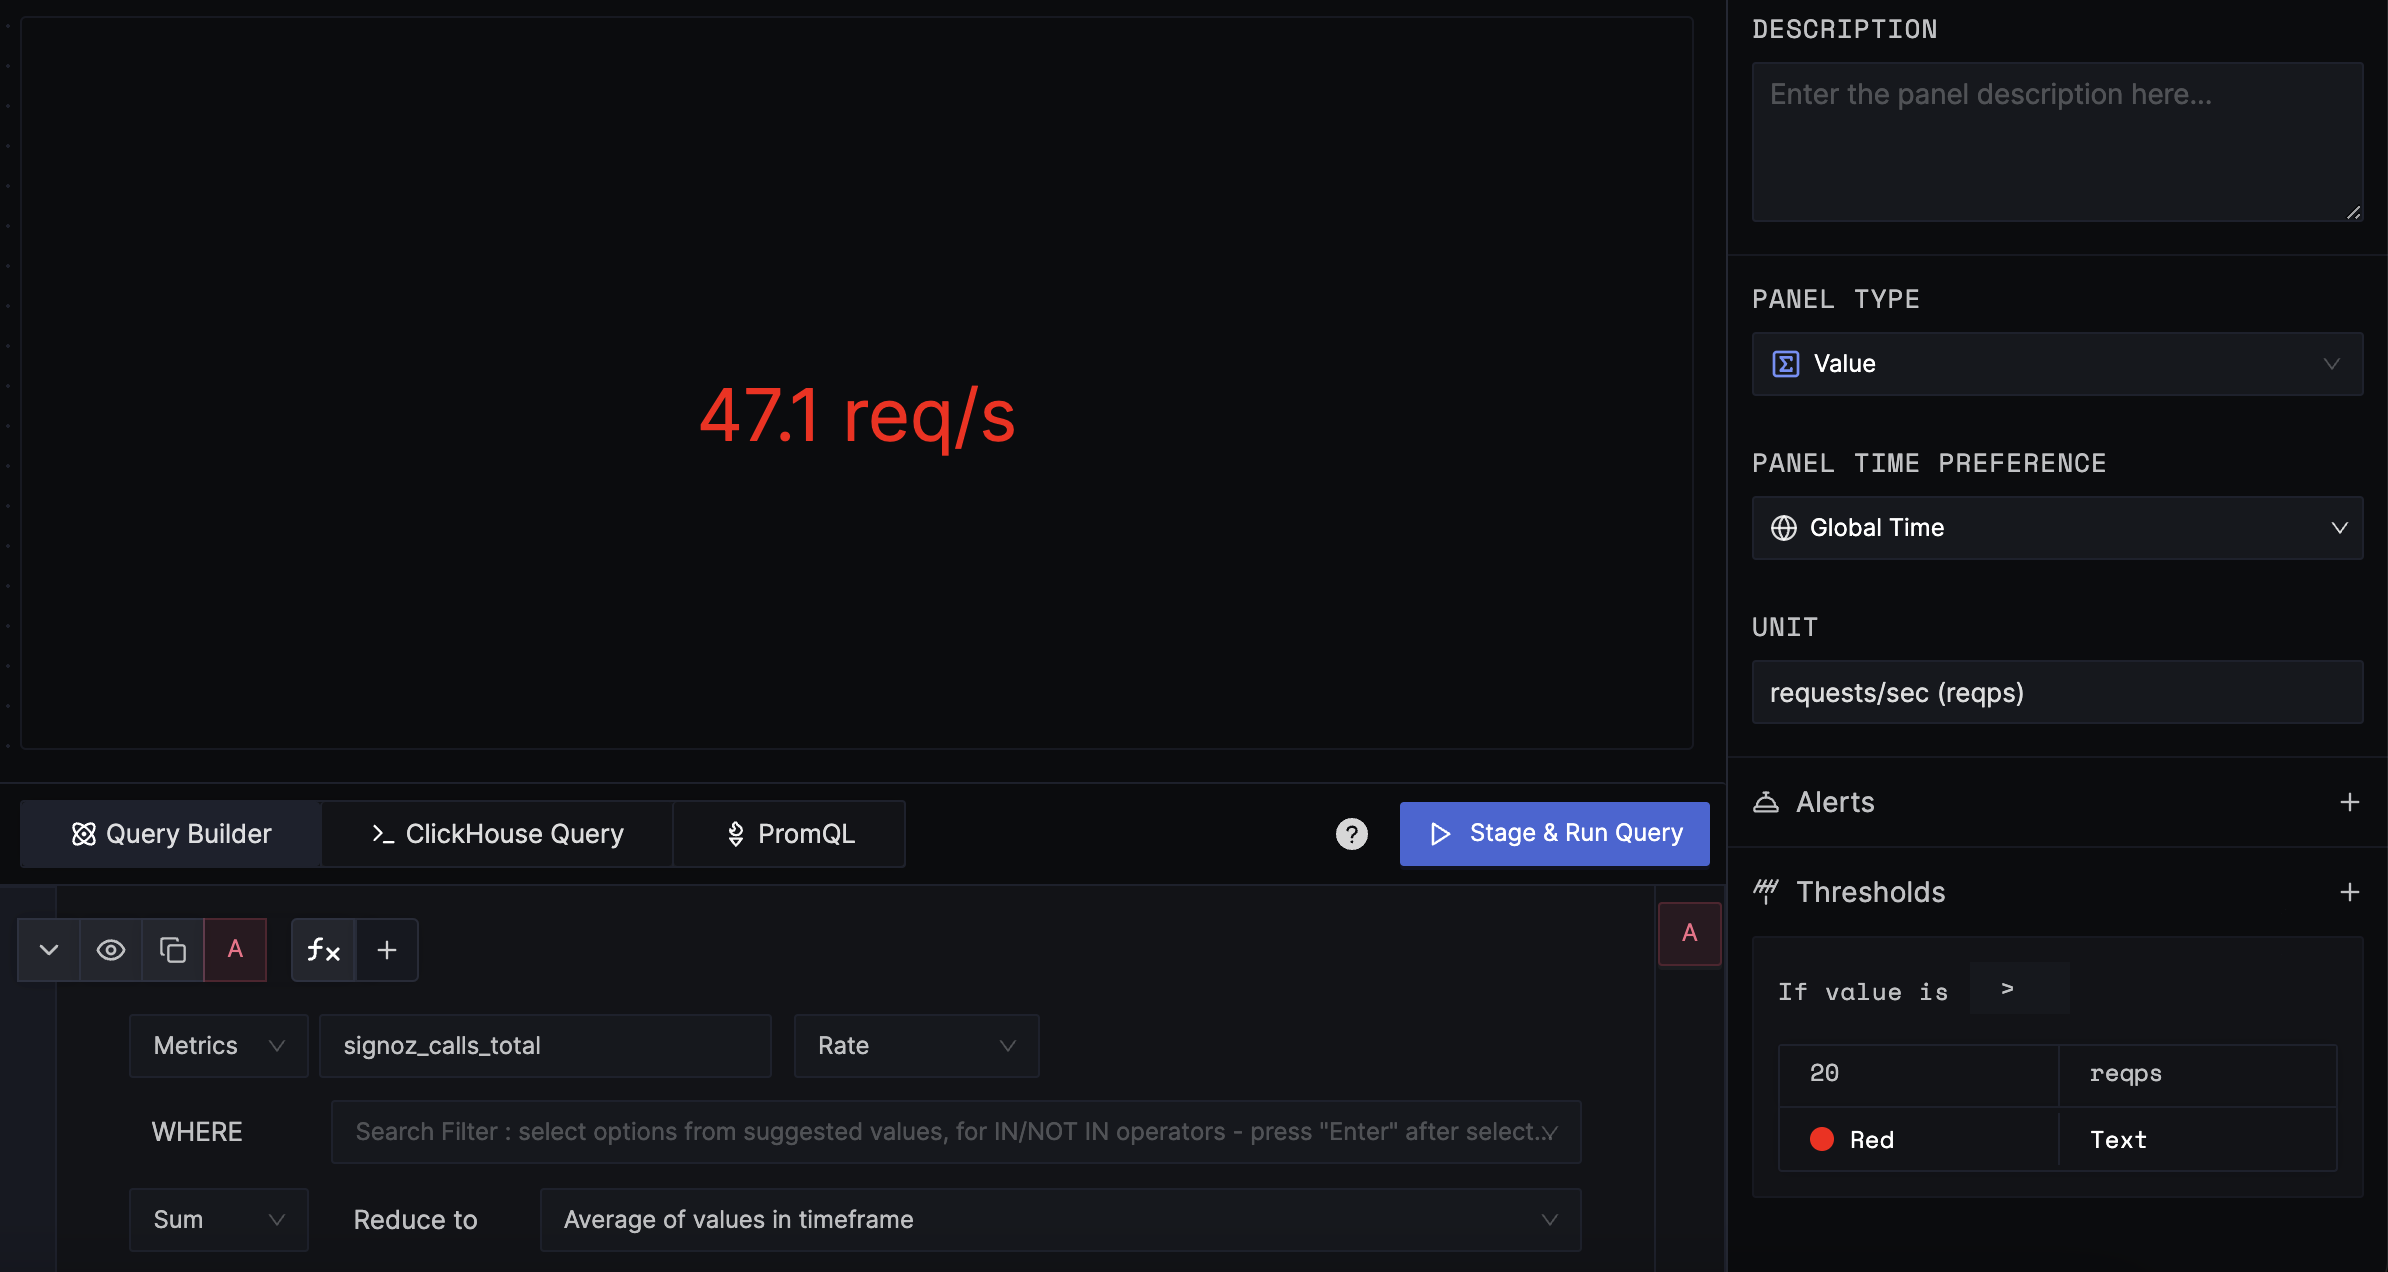
The following graph shows the combined average requests per second (req/s) for all services over a period of time.

Configuration
- Choose the signal type (logs, traces, metrics)
- Choose the metric, APM, or log to display
- Metric: see the Metrics query builder documentation to configure metric query
- Log: see the Logs query builder documentation to configure log query
- Trace: see the Traces query builder documentation to configure trace query
- Reduce: choose the function to reduce the data (e.g.
avg,sum,max,min, orlatest). This step aggregates the data over the selected time period and returns a single value. For example, if you have a request rate over a period of time, theavgfunction will return the average of per-minute request rate over the period.
Options
Unit
The unit of the value. The default unit is None.
Thresholds
Thresholds are used to configure the color of the value. The thresholds are defined as a list of tuples. Each tuple contains the value and the color. The color is optional and if not provided, the default color will be used.
Get Help
If you need help with the steps in this topic, please reach out to us on SigNoz Community Slack.
If you are a SigNoz Cloud user, please use in product chat support located at the bottom right corner of your SigNoz instance or contact us at cloud-support@signoz.io.
