Overview
This documentation provides a step-by-step guide to setting up web vitals monitoring with OpenTelemetry metrics on SigNoz.
Already sending frontend metrics?
If you've followed the Sending Metrics from your frontend application guide, you can skip Steps 1 and 2 below as your instrumentation file is already set up. Jump straight to Step 3 to add web vitals capture to your existing setup.
Prerequisites
- SigNoz Cloud or self-hosted account
- A web application from where you want to send web vitals
Setup
Step 1: Install dependencies
npm install web-vitals
npm install @opentelemetry/api
npm install @opentelemetry/exporter-metrics-otlp-http
npm install @opentelemetry/sdk-metrics
npm install @opentelemetry/resources
yarn add web-vitals
yarn add @opentelemetry/api
yarn add @opentelemetry/exporter-metrics-otlp-http
yarn add @opentelemetry/sdk-metrics
yarn add @opentelemetry/resources
Read more about the dependencies
web-vitals: Core library for measuring and reporting web vitals metrics (LCP, INP, CLS, TTFB, FCP)@opentelemetry/api: Provides the core OpenTelemetry API for creating metrics and meters@opentelemetry/exporter-metrics-otlp-http: Exports metrics to OpenTelemetry Protocol (OTLP) over HTTP@opentelemetry/sdk-metrics: Provides the OpenTelemetry metrics SDK implementation@opentelemetry/resources: Defines service metadata and attributes for your application
Step 2: Create an instrumentation file
The instrumentation file is required to setup the MeterProvider which is used to create custom metrics.
import {
  MeterProvider,
  PeriodicExportingMetricReader,
} from '@opentelemetry/sdk-metrics';
import { OTLPMetricExporter } from '@opentelemetry/exporter-metrics-otlp-http';
import { resourceFromAttributes } from '@opentelemetry/resources';
import { metrics } from '@opentelemetry/api';

// Define your resource, e.g., service name, environment.
const resource = resourceFromAttributes({
  'service.name': '<SERVICE_NAME>',
});

// Create a metric reader with OTLP exporter configured to send metrics to a local collector.
const metricReader = new PeriodicExportingMetricReader({
  exporter: new OTLPMetricExporter({
    // For the self-hosted version, please use the collector url instead.
    url: `https://ingest.<INGESTION_REGION>.signoz.cloud:443/v1/metrics`,
    headers: {
      // Optional for the self-hosted version
      'signoz-ingestion-key': '<INGESTION_KEY>',
    },
  }),
  exportIntervalMillis: 10000, // Export metrics every 10 seconds.
});

// Initialize a MeterProvider with the above configurations.
const myServiceMeterProvider = new MeterProvider({
  resource,
  readers: [metricReader],
});

// Set the initialized MeterProvider as global to enable metric collection across the app.
metrics.setGlobalMeterProvider(myServiceMeterProvider);
- Set the
<INGESTION_REGION>to match your SigNoz Cloud region - Replace
<INGESTION_KEY>with your SigNoz ingestion key <SERVICE_NAME>is the name of your service
For self-hosted deployments, add the following CORS configuration to your OpenTelemetry Collector config file to allow browser requests from your frontend domain. Also, update the endpoint and remove the ingestion key header as shown in Cloud → Self-Hosted.
receivers:
  otlp:
    protocols:
      grpc:
        endpoint: 0.0.0.0:4317
      http:
        endpoint: 0.0.0.0:4318
        cors:
          allowed_origins:
            - <YOUR_FRONTEND_URL>
          allowed_headers: ['*']
This configures the OTel Collector to export traces to SigNoz Cloud using the OTLP/HTTP protocol. Read more about OTel Collector configuration here.
Step 3: Capture and export Web Vitals
Use the web-vitals library to capture key performance metrics like CLS, INP, LCP, TTFB, and FCP. These are captured through callback functions that you define and exported as metrics.
import { metrics } from '@opentelemetry/api';
import { onCLS, onFCP, onINP, onLCP, onTTFB, type Metric } from 'web-vitals';

const meter = metrics.getMeter('web-vitals');
const lcp = meter.createHistogram('lcp');
const cls = meter.createObservableGauge('cls');
const inp = meter.createHistogram('inp');
const ttfb = meter.createHistogram('ttfb');
const fcp = meter.createHistogram('fcp');

function sendToAnalytics(metric: Metric) {
  switch (metric.name) {
    case 'LCP': {
      lcp.record(metric.value);
      break;
    }
    case 'CLS': {
      cls.addCallback(result => {
        result.observe(metric.value);
      });
      break;
    }
    case 'INP': {
      inp.record(metric.value);
      break;
    }
    case 'TTFB': {
      ttfb.record(metric.value);

      break;
    }
    case 'FCP': {
      fcp.record(metric.value);
      break;
    }
    default: {
      console.log('unexpected metric name');
    }
  }
}

onCLS(sendToAnalytics);
onINP(sendToAnalytics);
onLCP(sendToAnalytics);
onTTFB(sendToAnalytics);
onFCP(sendToAnalytics);
import { metrics } from '@opentelemetry/api';
import { onCLS, onFCP, onINP, onLCP, onTTFB } from 'web-vitals';

const meter = metrics.getMeter('web-vitals');
const lcp = meter.createHistogram('lcp');
const cls = meter.createObservableGauge('cls');
const inp = meter.createHistogram('inp');
const ttfb = meter.createHistogram('ttfb');
const fcp = meter.createHistogram('fcp');

function sendToAnalytics(metric) {
  switch (metric.name) {
    case 'LCP': {
      lcp.record(metric.value);
      break;
    }
    case 'CLS': {
      cls.addCallback((result) => {
        result.observe(metric.value);
      });
      break;
    }
    case 'INP': {
      inp.record(metric.value);
      break;
    }
    case 'TTFB': {
      ttfb.record(metric.value);
      break;
    }
    case 'FCP': {
      fcp.record(metric.value);
      break;
    }
    default: {
      console.log('unexpected metric name');
    }
  }
}

onCLS(sendToAnalytics);
onINP(sendToAnalytics);
onLCP(sendToAnalytics);
onTTFB(sendToAnalytics);
onFCP(sendToAnalytics);
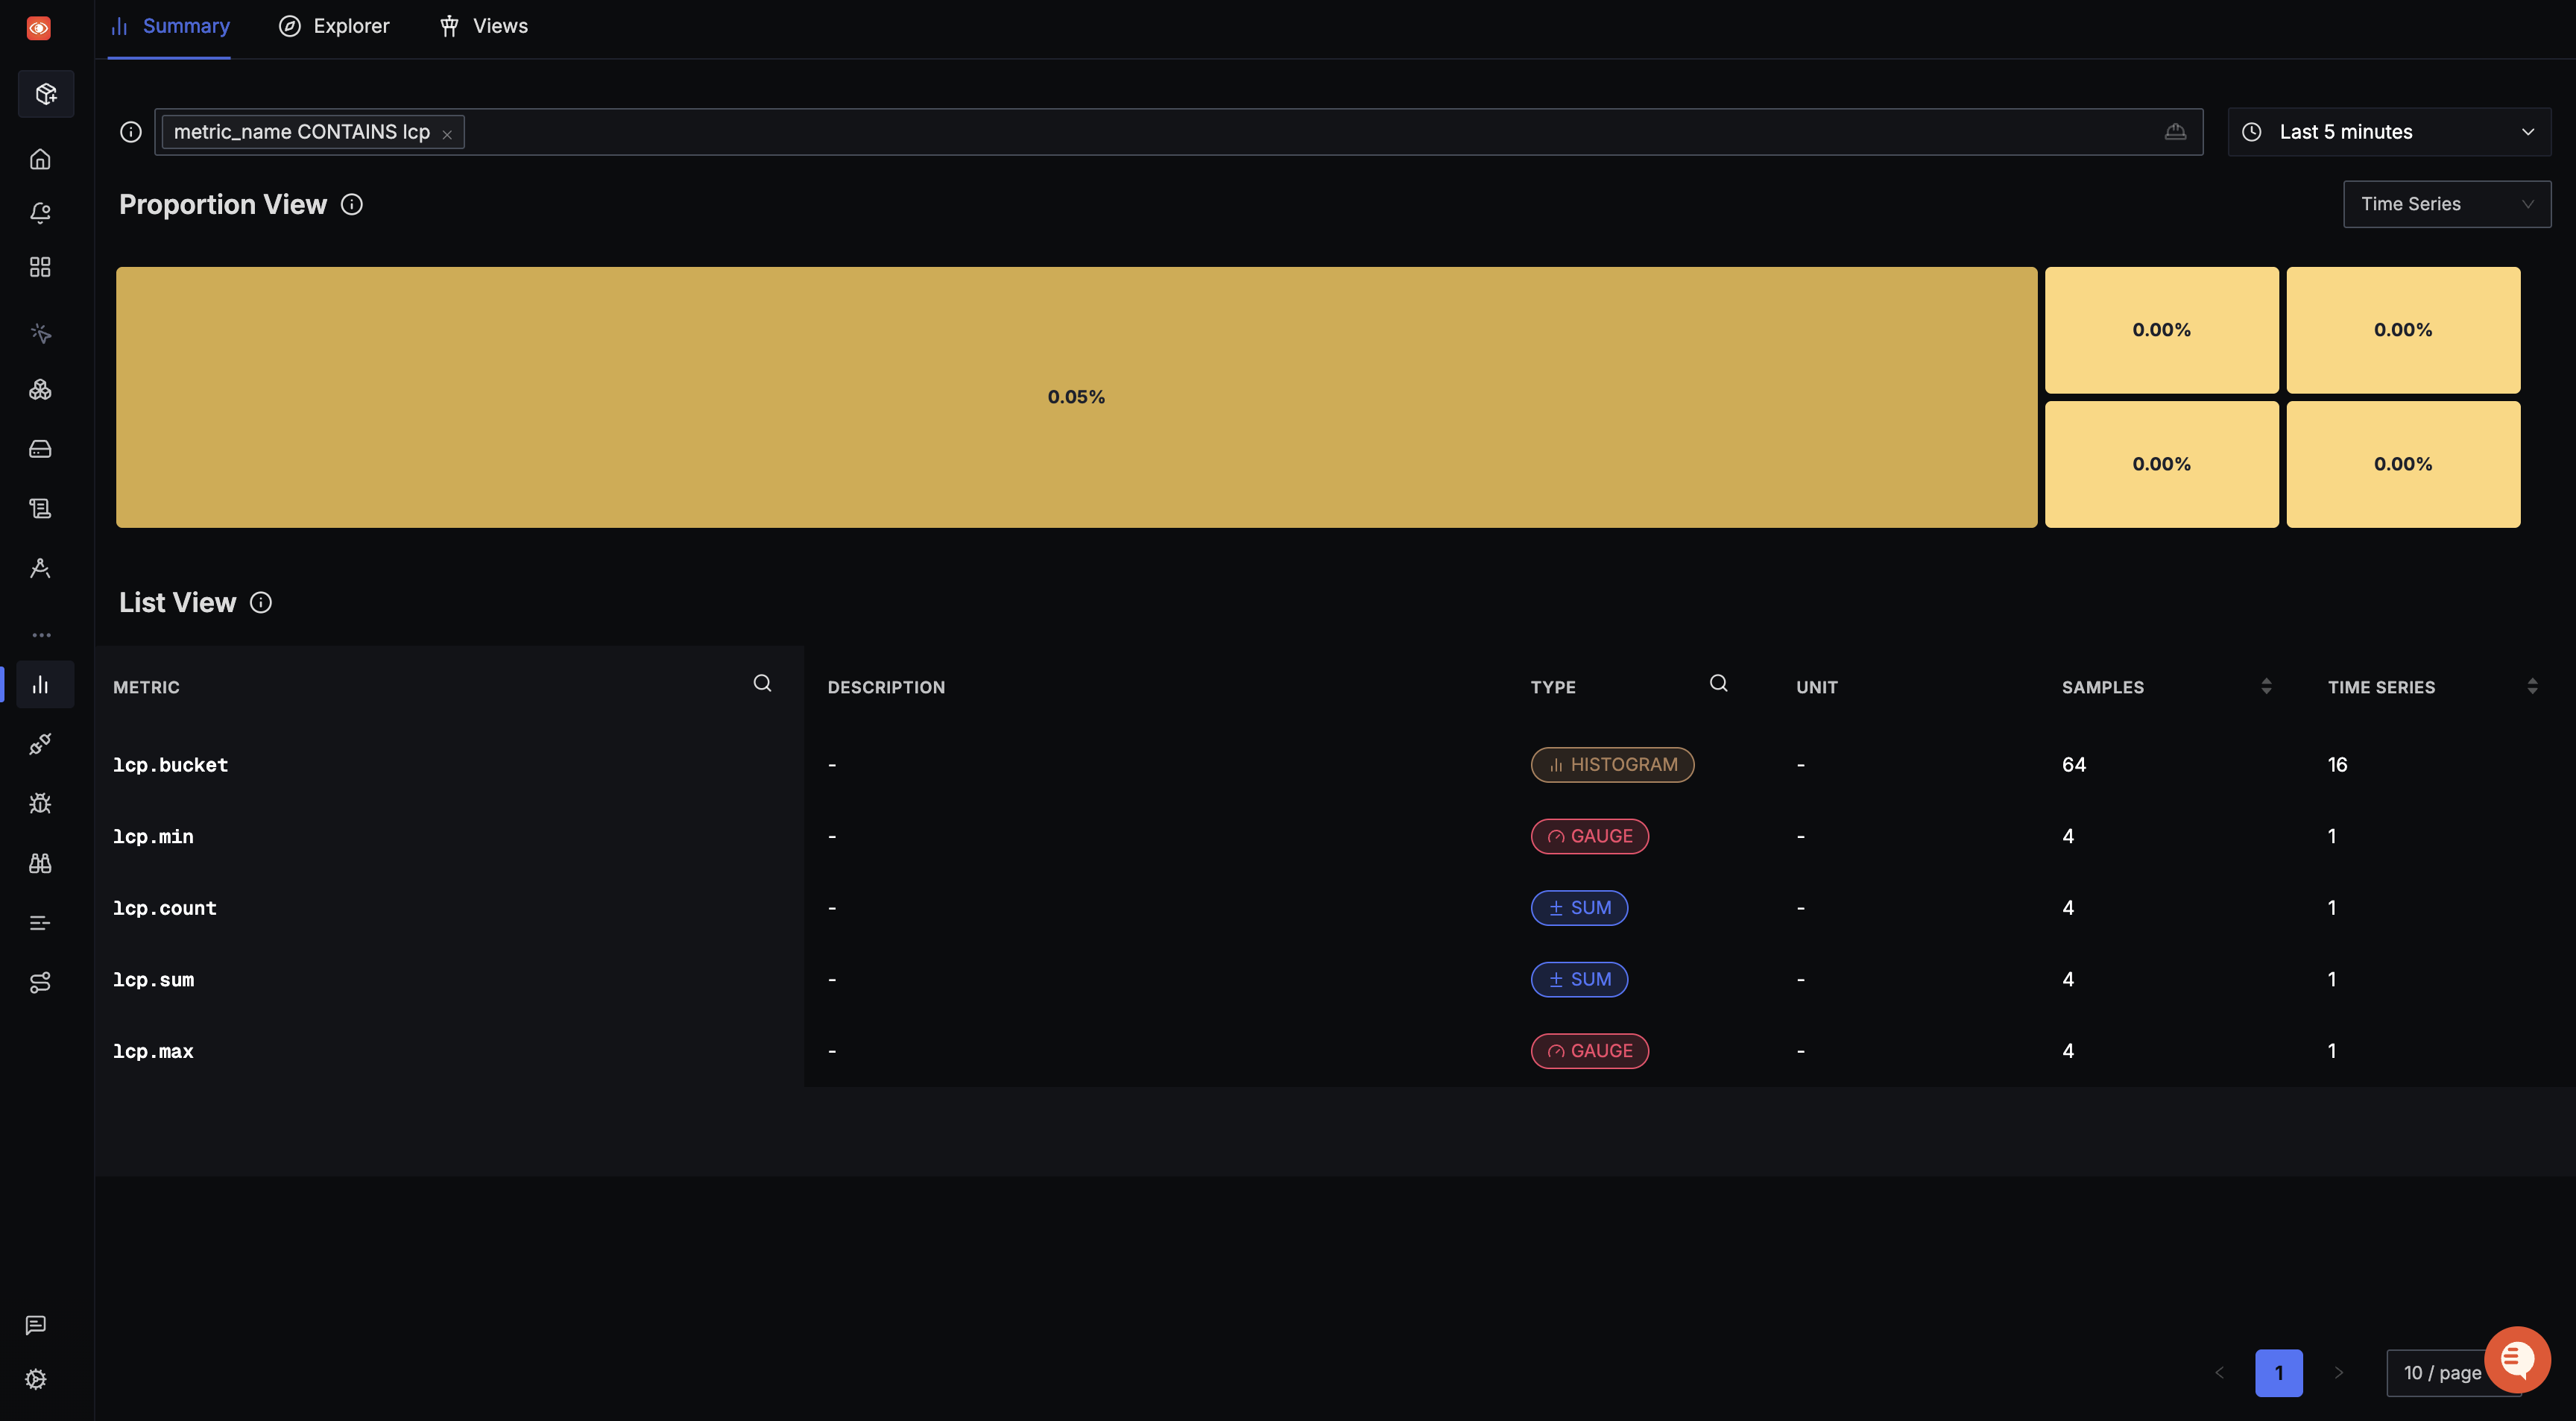
Validate
The captured web vitals can be viewed in the Metrics Explorer.
Attaching additional identifiers to your Web Vitals
You can enrich web vitals with additional metadata like browser type, user ID, page URL etc. to enable real user monitoring (RUM)-like insights.
import { metrics } from '@opentelemetry/api';
import { UAParser } from 'ua-parser-js';
import { onCLS, onFCP, onINP, onLCP, onTTFB, type Metric } from 'web-vitals';

const pageUrl = window.location.pathname
  .replace(/\?.*$/, '') // remove query params
  .replace(/\/\d+/g, '/:id'); // normalize numeric IDs

export const CONSTANTS = {
  USER_ID: 'user.id',
  USER_AGENT_NAME: 'user_agent.name',
  PAGE_URL: 'url.path_template',
};

function getBrowserInfo() {
  // You can add your custom browser tracking logic here as well.
  // This example uses the ua-parser-js package.
  const parser = new UAParser();
  const result = parser.getResult();
  return result.browser.name || '';
}

function getUserId() {
  // You can add your custom user ID tracking logic here as well.
  // This example uses localStorage.
  const userId = localStorage.getItem('userId');
  return userId || '';
}

const customAttributes = {
  [CONSTANTS.USER_ID]: getUserId(),
  [CONSTANTS.USER_AGENT_NAME]: getBrowserInfo(),
  [CONSTANTS.PAGE_URL]: pageUrl,
};

const meter = metrics.getMeter('web-vitals');
const lcp = meter.createHistogram('lcp');
const cls = meter.createObservableGauge('cls');
const inp = meter.createHistogram('inp');
const ttfb = meter.createHistogram('ttfb');
const fcp = meter.createHistogram('fcp');

function sendToAnalytics(metric: Metric) {
  switch (metric.name) {
    case 'LCP': {
      lcp.record(metric.value, customAttributes);
      break;
    }
    case 'CLS': {
      cls.addCallback(result => {
        result.observe(metric.value, customAttributes);
      });
      break;
    }
    case 'INP': {
      inp.record(metric.value, customAttributes);
      break;
    }
    case 'TTFB': {
      ttfb.record(metric.value, customAttributes);

      break;
    }
    case 'FCP': {
      fcp.record(metric.value, customAttributes);
      break;
    }
    default: {
      console.log('unexpected metric name');
    }
  }
}

onCLS(sendToAnalytics);
onINP(sendToAnalytics);
onLCP(sendToAnalytics);
onTTFB(sendToAnalytics);
onFCP(sendToAnalytics);
import { metrics } from '@opentelemetry/api';
import { UAParser } from 'ua-parser-js';
import { onCLS, onFCP, onINP, onLCP, onTTFB } from 'web-vitals';

const pageUrl = window.location.pathname
  .replace(/\?.*$/, '') // remove query params
  .replace(/\/\d+/g, '/:id'); // normalize numeric IDs

export const CONSTANTS = {
  USER_ID: 'user.id',
  USER_AGENT_NAME: 'user_agent.name',
  PAGE_URL: 'url.path_template',
};

function getBrowserInfo() {
  // You can add your custom browser tracking logic here as well.
  // This example uses the ua-parser-js package.
  const parser = new UAParser();
  const result = parser.getResult();
  return result.browser.name || '';
}

function getUserId() {
  // You can add your custom user ID tracking logic here as well.
  // This example uses localStorage.
  const userId = localStorage.getItem('userId');
  return userId || '';
}

const customAttributes = {
  [CONSTANTS.USER_ID]: getUserId(),
  [CONSTANTS.USER_AGENT_NAME]: getBrowserInfo(),
  [CONSTANTS.PAGE_URL]: pageUrl,
};

const meter = metrics.getMeter('web-vitals');
const lcp = meter.createHistogram('lcp');
const cls = meter.createObservableGauge('cls');
const inp = meter.createHistogram('inp');
const ttfb = meter.createHistogram('ttfb');
const fcp = meter.createHistogram('fcp');

function sendToAnalytics(metric) {
  switch (metric.name) {
    case 'LCP': {
      lcp.record(metric.value, customAttributes);
      break;
    }
    case 'CLS': {
      cls.addCallback(result => {
        result.observe(metric.value, customAttributes);
      });
      break;
    }
    case 'INP': {
      inp.record(metric.value, customAttributes);
      break;
    }
    case 'TTFB': {
      ttfb.record(metric.value, customAttributes);

      break;
    }
    case 'FCP': {
      fcp.record(metric.value, customAttributes);
      break;
    }
    default: {
      console.log('unexpected metric name');
    }
  }
}

onCLS(sendToAnalytics);
onINP(sendToAnalytics);
onLCP(sendToAnalytics);
onTTFB(sendToAnalytics);
onFCP(sendToAnalytics);
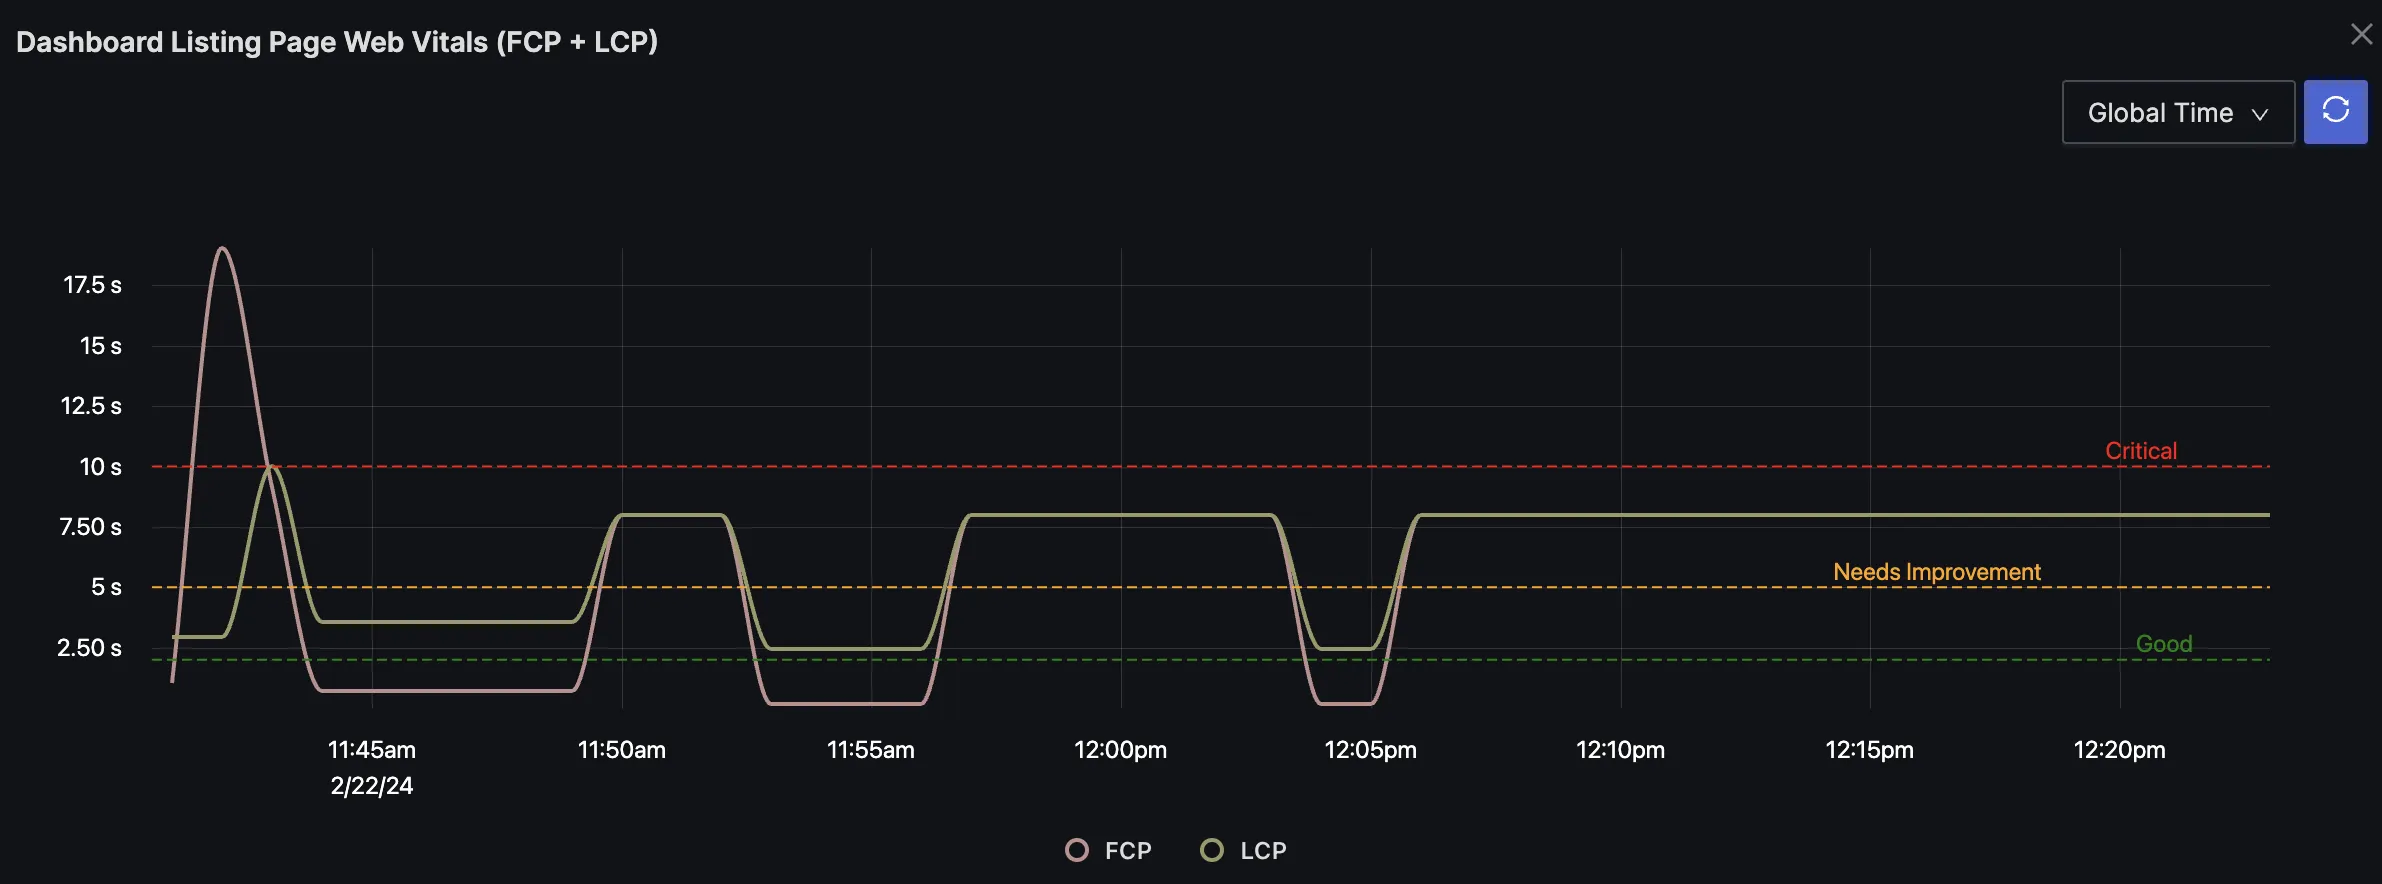
Setup Dashboard and alerts
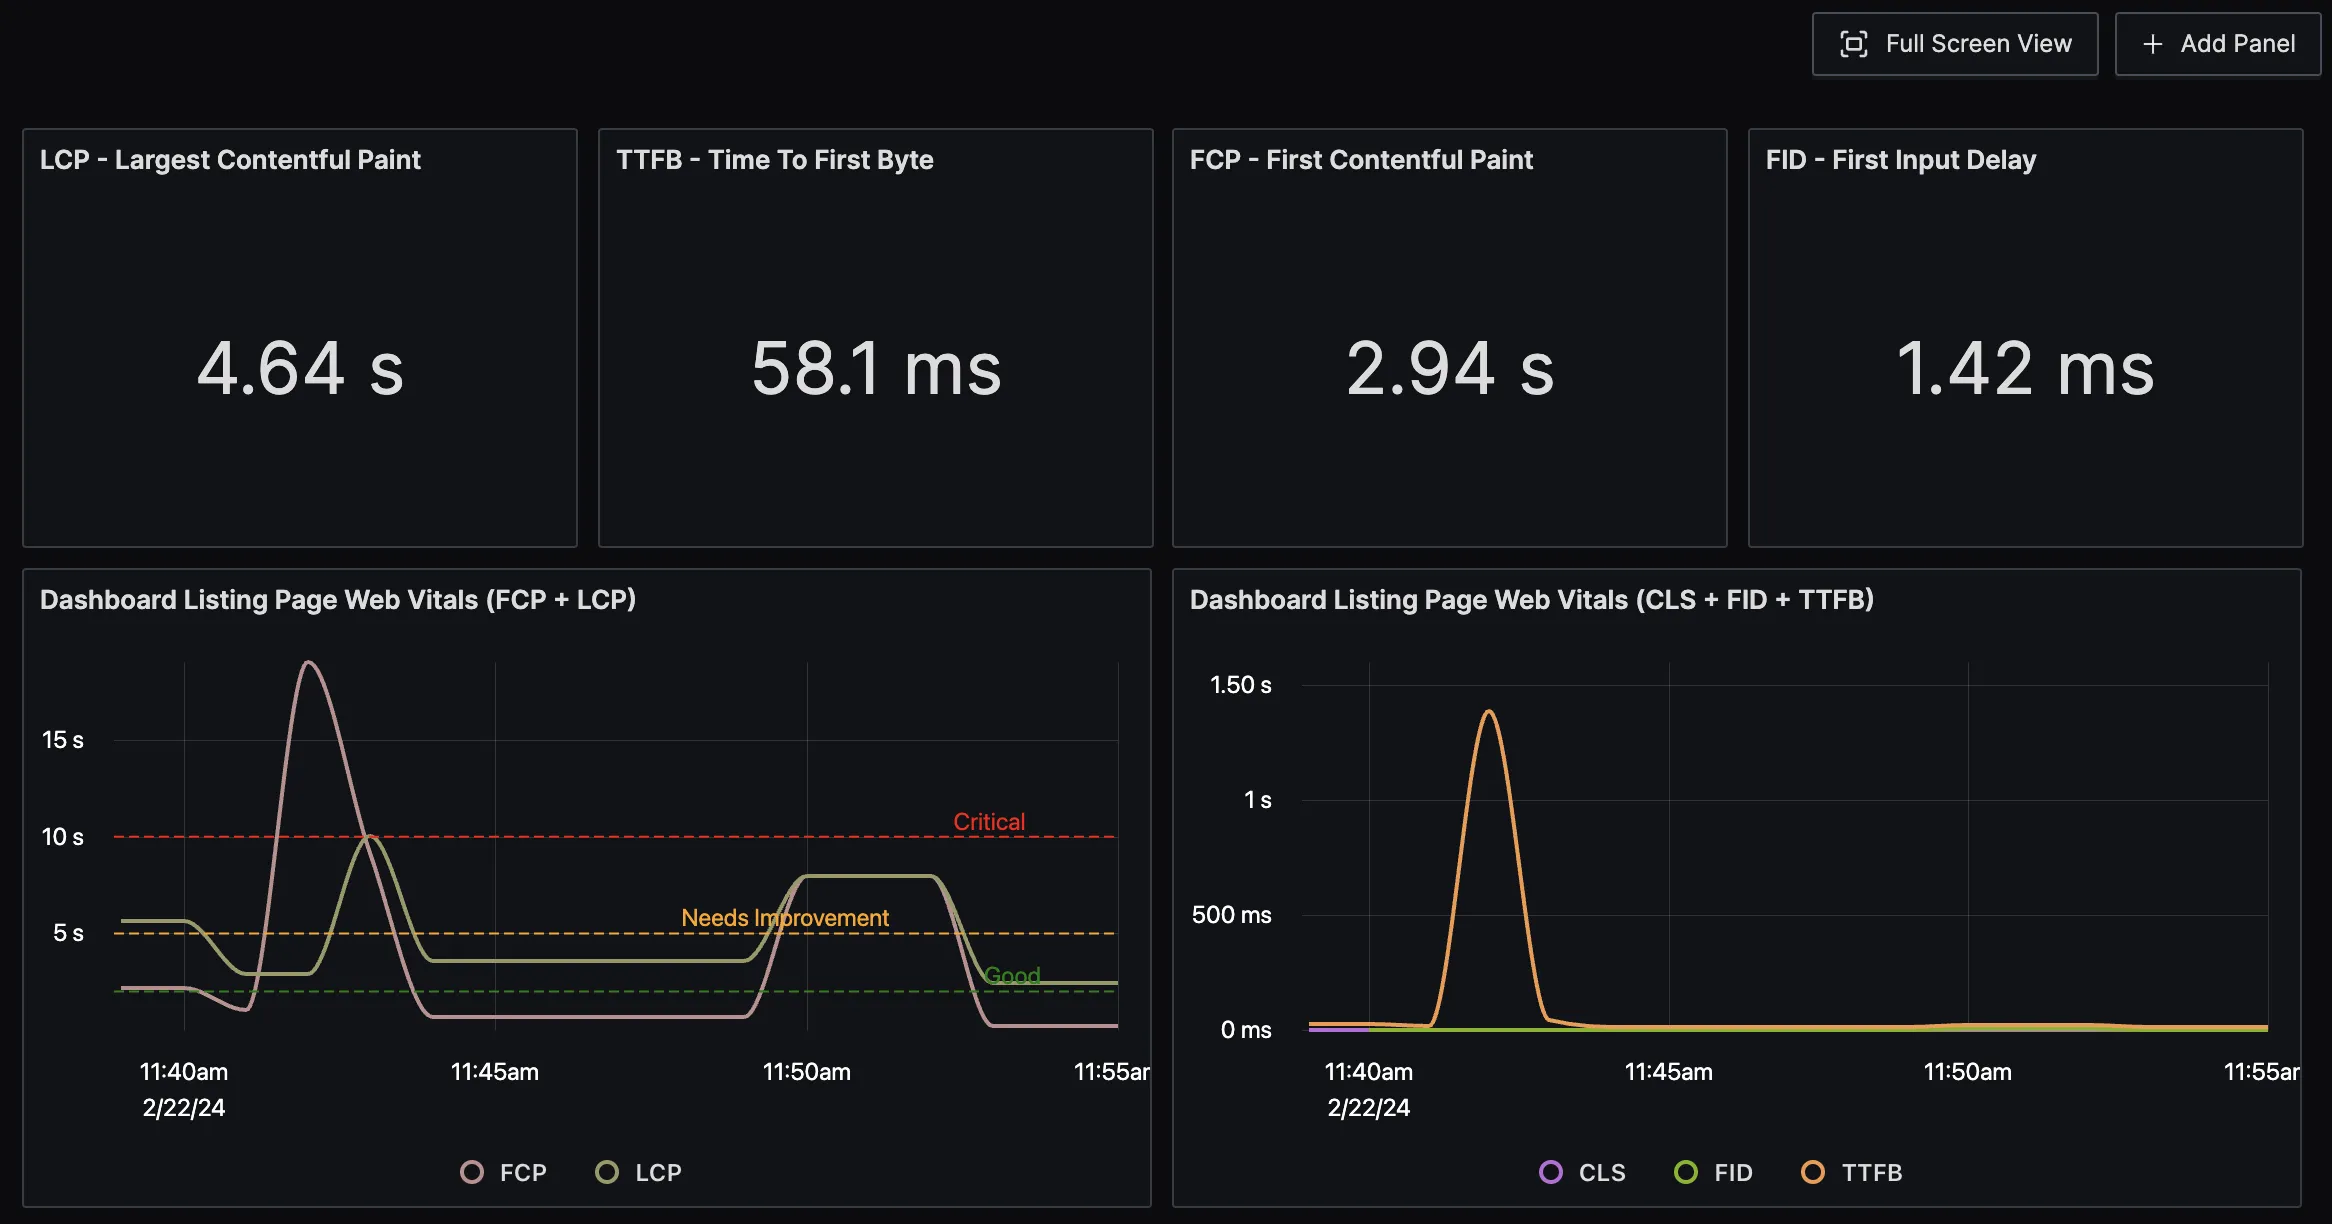
SigNoz charts support thresholds with color coding. For example, the graph below shows three thresholds for good, needs improvement, and critical levels.
Out of Box Dashboard
You can import our out-of-the-box Dashboard for web vitals monitoring
Demo Application
We have set up a Demo React application that demonstrates monitoring Core Web Vitals with metrics using OpenTelemetry and sending them to SigNoz.
