Overview
This documentation provides a detailed walkthrough to send the Google Compute Engine traces directly to SigNoz. By the end of this guide, you will have a setup that automatically sends your Compute Engine traces to SigNoz.
Here's a quick summary of what we will be doing in this guide
- Create and configure Compute Engine
- Create an application on Compute Engine with tracing auto-intrumentation
- Send and Visualize the logs in SigNoz Cloud
Prerequisites
- Google Cloud account with administrative privilege or Compute Instance Admin privilege.
- SigNoz Cloud Account (we are using SigNoz Cloud for this demonstration, we will also need ingestion details. To get your Ingestion Key and Ingestion URL, sign-in to your SigNoz Cloud Account and go to Settings >> Ingestion Settings)
- Access to a project in GCP
Get started with Compute Engine Configuration
Create the Compute Engine instance using the following steps:
Step 1: Go to your GCP console and search for Compute Engine, go to Compute Engine service and click on CREATE INSTANCE.
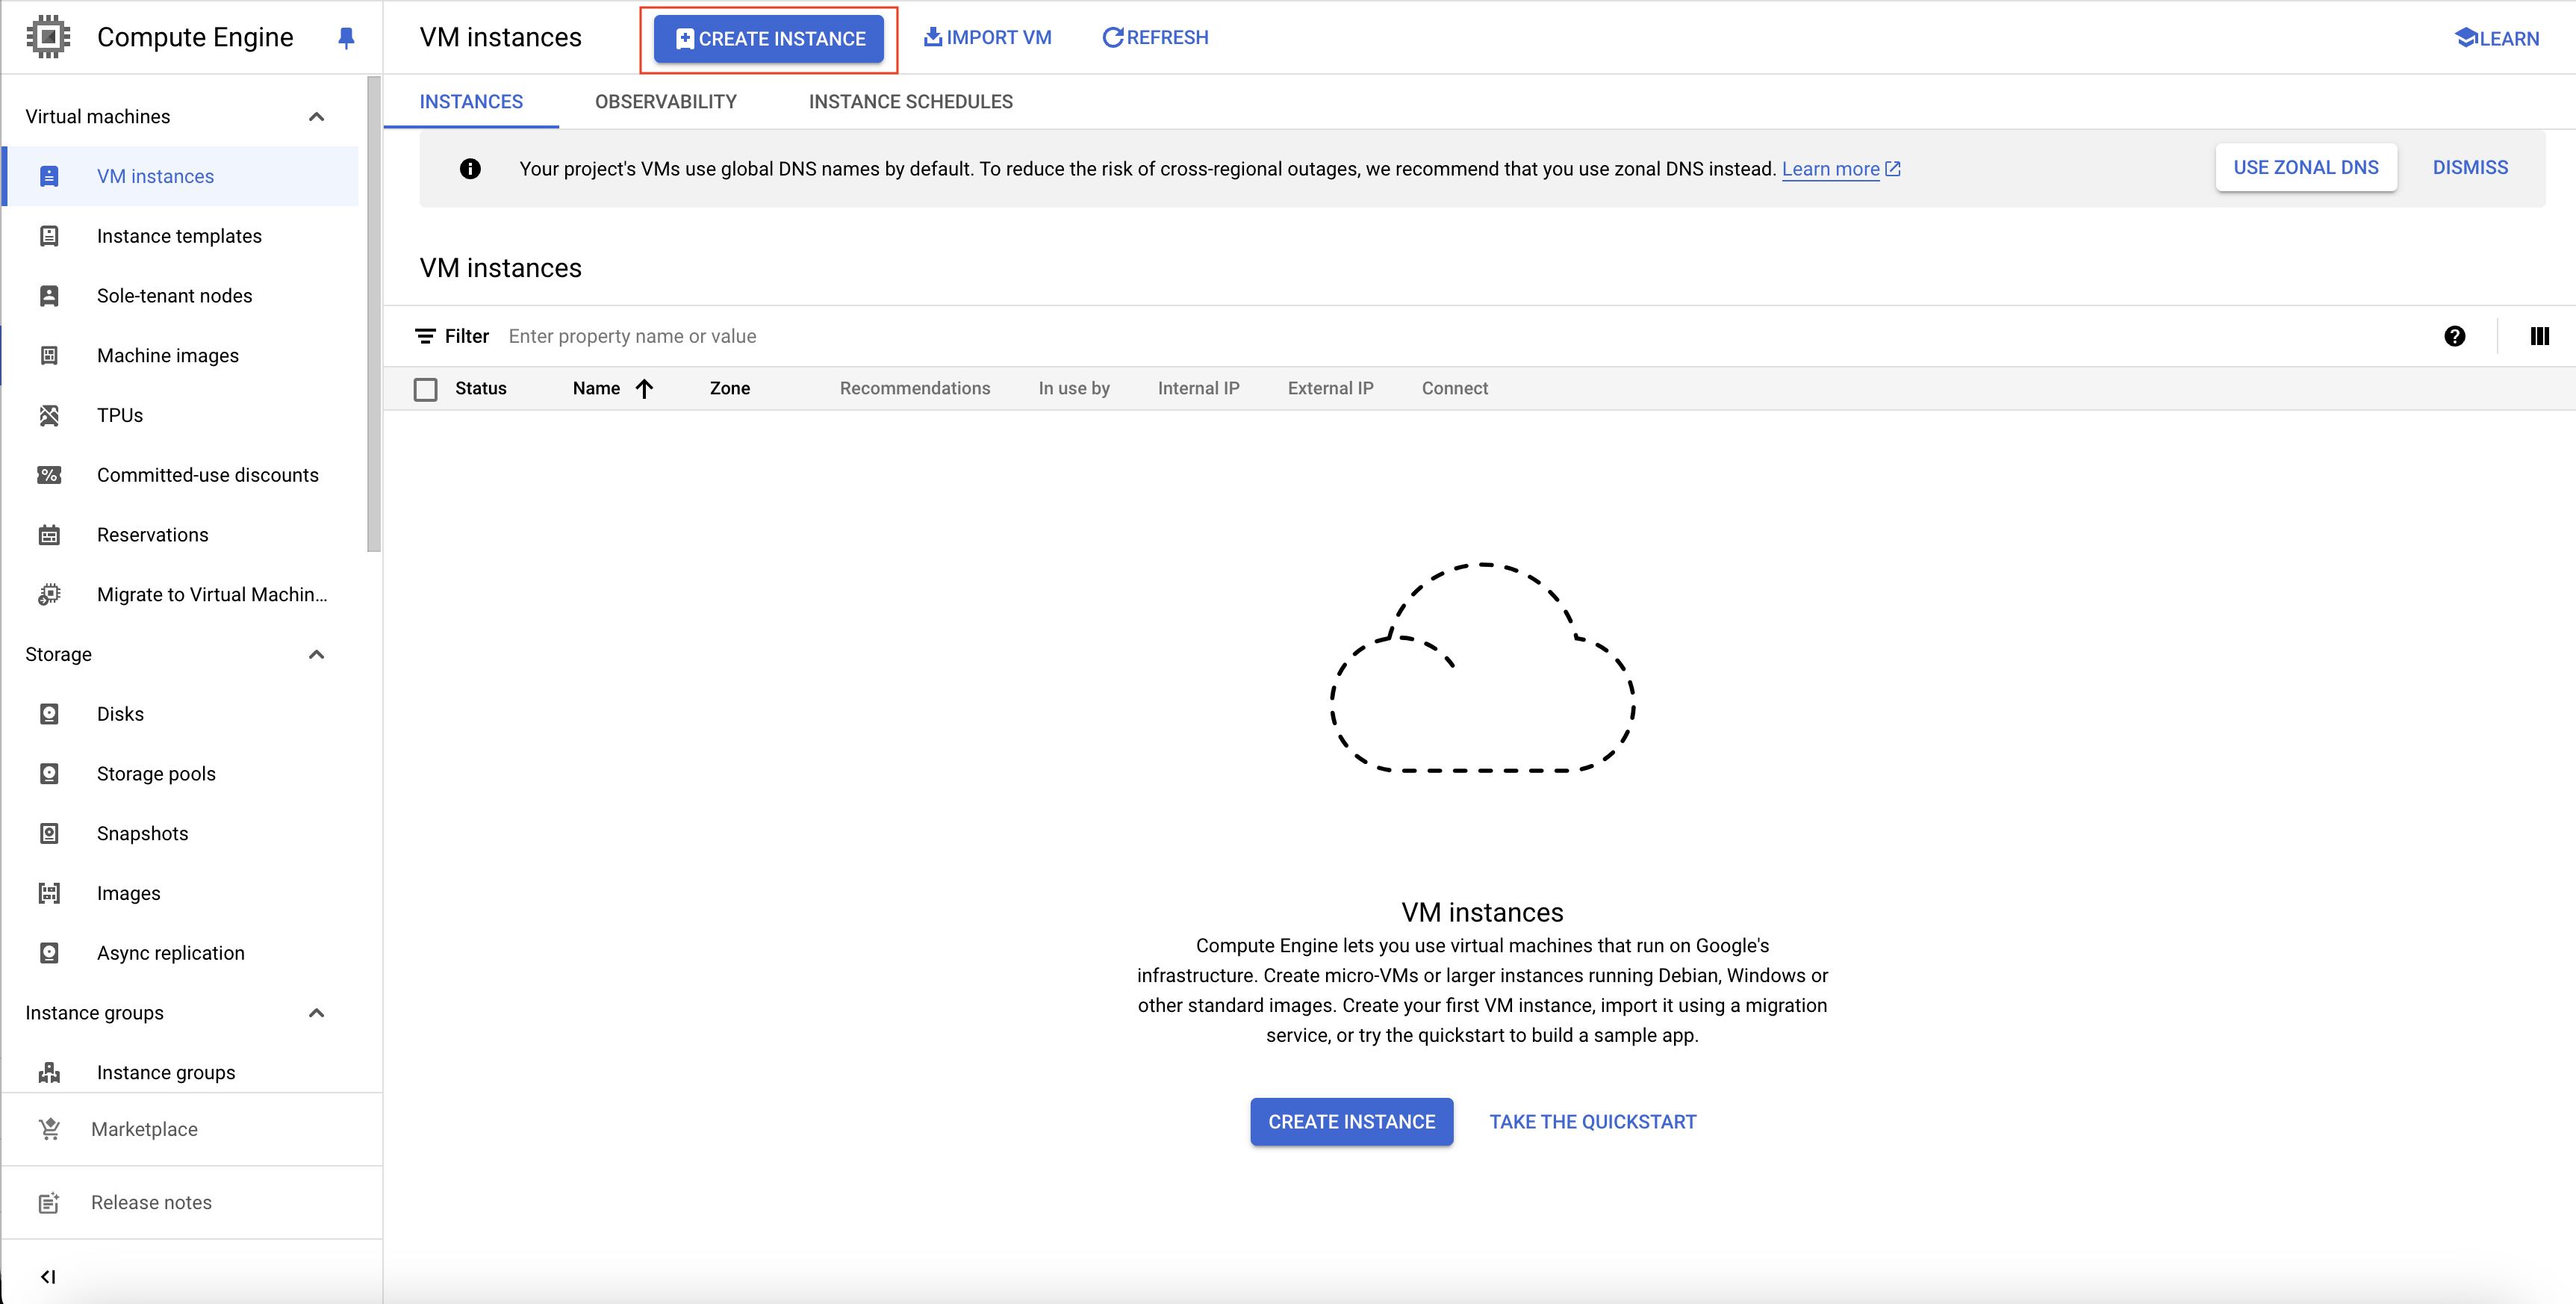
Create Compute Engine Instance
Step 2: Give an apprpriate name for the Compute Engine instance. Select an appropriate region and zone. You can choose a machine as per your requirements. After choosing all the appropriate settings, click on CREATE button at the bottom of the page.
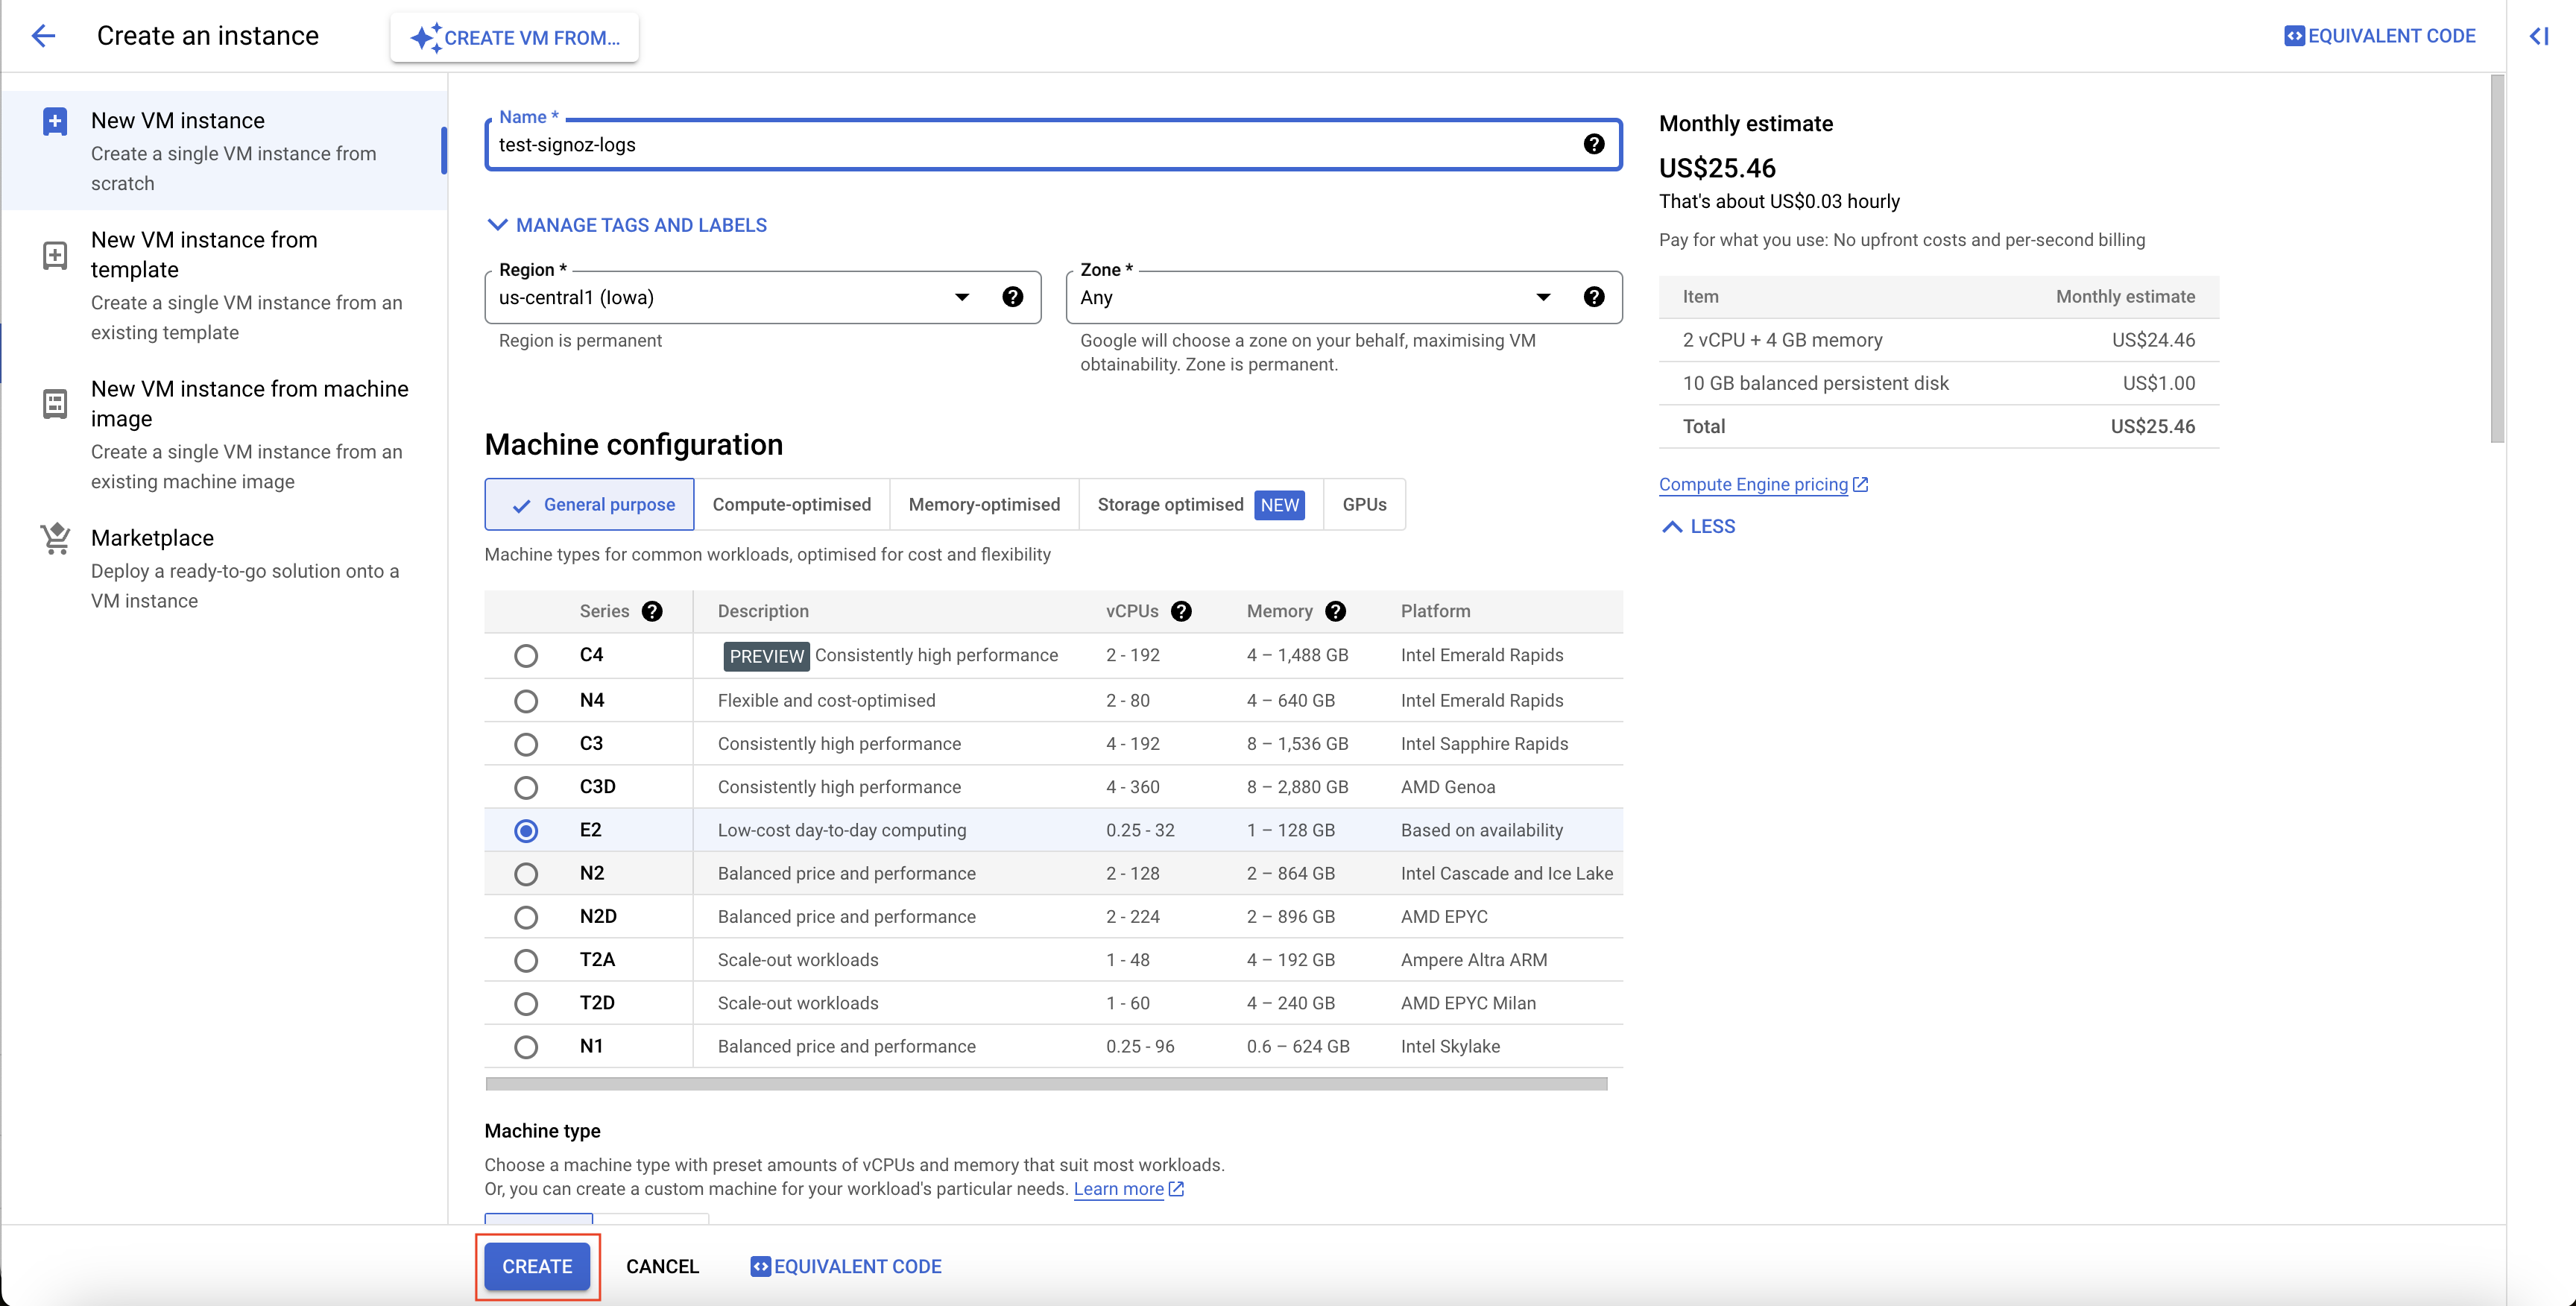
Compute Engine Instance Settings
With this, the Compute Engine instance is created.
Create an application on Compute Engine
Please refer to our SigNoz Tutorials or Blog to find information on how to instrument your application like Spring, FastAPI, NextJS, Langchain, Node.js, Flask, Django, etc. with OpenTelemetry.
Here, we will be creating a NodeJS application.
Step 1: Please refer to this document to install Node.js and npm.
Step 2: Once the NodeJS and npm are installed, create a folder with an appropriate NodeJS service name, and change directory to that folder.
mkdir my-nodejs-service
cd my-nodejs-service
Step 3: Create the npm application using npm init.
Step 4: Install OpenTelemetry packages and express dependency.
npm install --save @opentelemetry/api@^1.6.0
npm install --save @opentelemetry/sdk-node@^0.45.0
npm install --save @opentelemetry/auto-instrumentations-node@^0.39.4
npm install --save @opentelemetry/exporter-trace-otlp-http@^0.45.0
npm install --save express
Step 5: Create server.js file
const express = require('express');
const app = express();

app.get('/', (req, res) => {
  res.send('Hello from Compute Engine!');
});

// Listen to the App Engine-specified port, or 8080 otherwise
const PORT = process.env.PORT || 8080;
app.listen(PORT, () => {
  console.log(`Server listening on port ${PORT}...`);
});
This file contains the actual application logic. Here, we have created a very simple application that opens a GET endpoint at / which sends out a statement "Hello from Compute Engine!" in the response.
Step 6: Create tracing.js file
You need to configure the endpoint for SigNoz cloud in this file. You can find your ingestion key from SigNoz cloud account details sent on your email.
// tracing.js
'use strict'
const process = require('process')
const opentelemetry = require('@opentelemetry/sdk-node')
const { getNodeAutoInstrumentations } = require('@opentelemetry/auto-instrumentations-node')
const { OTLPTraceExporter } = require('@opentelemetry/exporter-trace-otlp-http')
const { Resource } = require('@opentelemetry/resources')
const { SemanticResourceAttributes } = require('@opentelemetry/semantic-conventions')

// do not set headers in exporterOptions, the OTel spec recommends setting headers through ENV variables
// https://github.com/open-telemetry/opentelemetry-specification/blob/main/specification/protocol/exporter.md#specifying-headers-via-environment-variables

// highlight-start
const exporterOptions = {
  url: 'https://ingest.{region}.signoz.cloud:443/v1/traces',
}
// highlight-end

const traceExporter = new OTLPTraceExporter(exporterOptions)
const sdk = new opentelemetry.NodeSDK({
  traceExporter,
  instrumentations: [getNodeAutoInstrumentations()],
  resource: new Resource({
    // highlight-next-line
    [SemanticResourceAttributes.SERVICE_NAME]: 'computeengine_nodejs_app',
  }),
})

// initialize the SDK and register with the OpenTelemetry API
// this enables the API to record telemetry
sdk.start()

// gracefully shut down the SDK on process exit
process.on('SIGTERM', () => {
  sdk
    .shutdown()
    .then(() => console.log('Tracing terminated'))
    .catch((error) => console.log('Error terminating tracing', error))
    .finally(() => process.exit(0))
})
In this example, we have used computeengine_nodejs_app as the service name. You can feel free to change it appropriately as per your use-case.
Depending on the choice of your region for SigNoz cloud, the ingest endpoint will vary according to this table.
| Region | Endpoint |
|---|---|
| US | ingest.us.signoz.cloud:443 |
| IN | ingest.in.signoz.cloud:443 |
| EU | ingest.eu.signoz.cloud:443 |
Step 7: Run the NodeJS applicaiton using the following command:
OTEL_EXPORTER_OTLP_HEADERS="signoz-ingestion-key=<your-ingestion-key>" node -r ./tracing.js app.js
<your-ingestion-key> is the API token provided by SigNoz. You can find your ingestion key from SigNoz cloud account ingestion settings.
The application is now up and running on port 8080.
Open up the port on Compute Engine instance
In order to invoke the application, we need to open the port 8080 on the Compute Engine instance.
- On the GCP console, navigate to the Compute Engine page. Click on the instance where the NodeJS application is running.
- Scroll down to the
Network interfacessection, and click on the network interface name. - From the left side navigation menu, click on
Firewall. On the Firewall Policies page, click on CREATE FIREWALL RULE button at the top. - Put an appropraite name for the firewall rule, say
port-8080, and an appropriate description. - In the
Targetsdropdown, you can selectAll instances in the network, and in theSource IPv4 rangestextbox, put0.0.0.0/0. This will allow the incoming requests from any host. - In the
Protocols and portssection, tick theTCPcheckbox, and mention the port8080in the textbox. - Click on CREATE button at the bottom of the page.
With this, we have opened up incoming requests from any host to this VM instance at port 8080.
Invoking the NodeJS application
On the Compute Engine page on the GCP console, copy the External IP of the instance where the NodeJS application is running.
Now, on a new tab in your browser, invoke the URL: http://{external-ip-address}:8080/. You should receive the response Hello from Compute Engine! on your browser.
Also, this would have resulted in a trace which should now start appearing in the SigNoz Cloud.
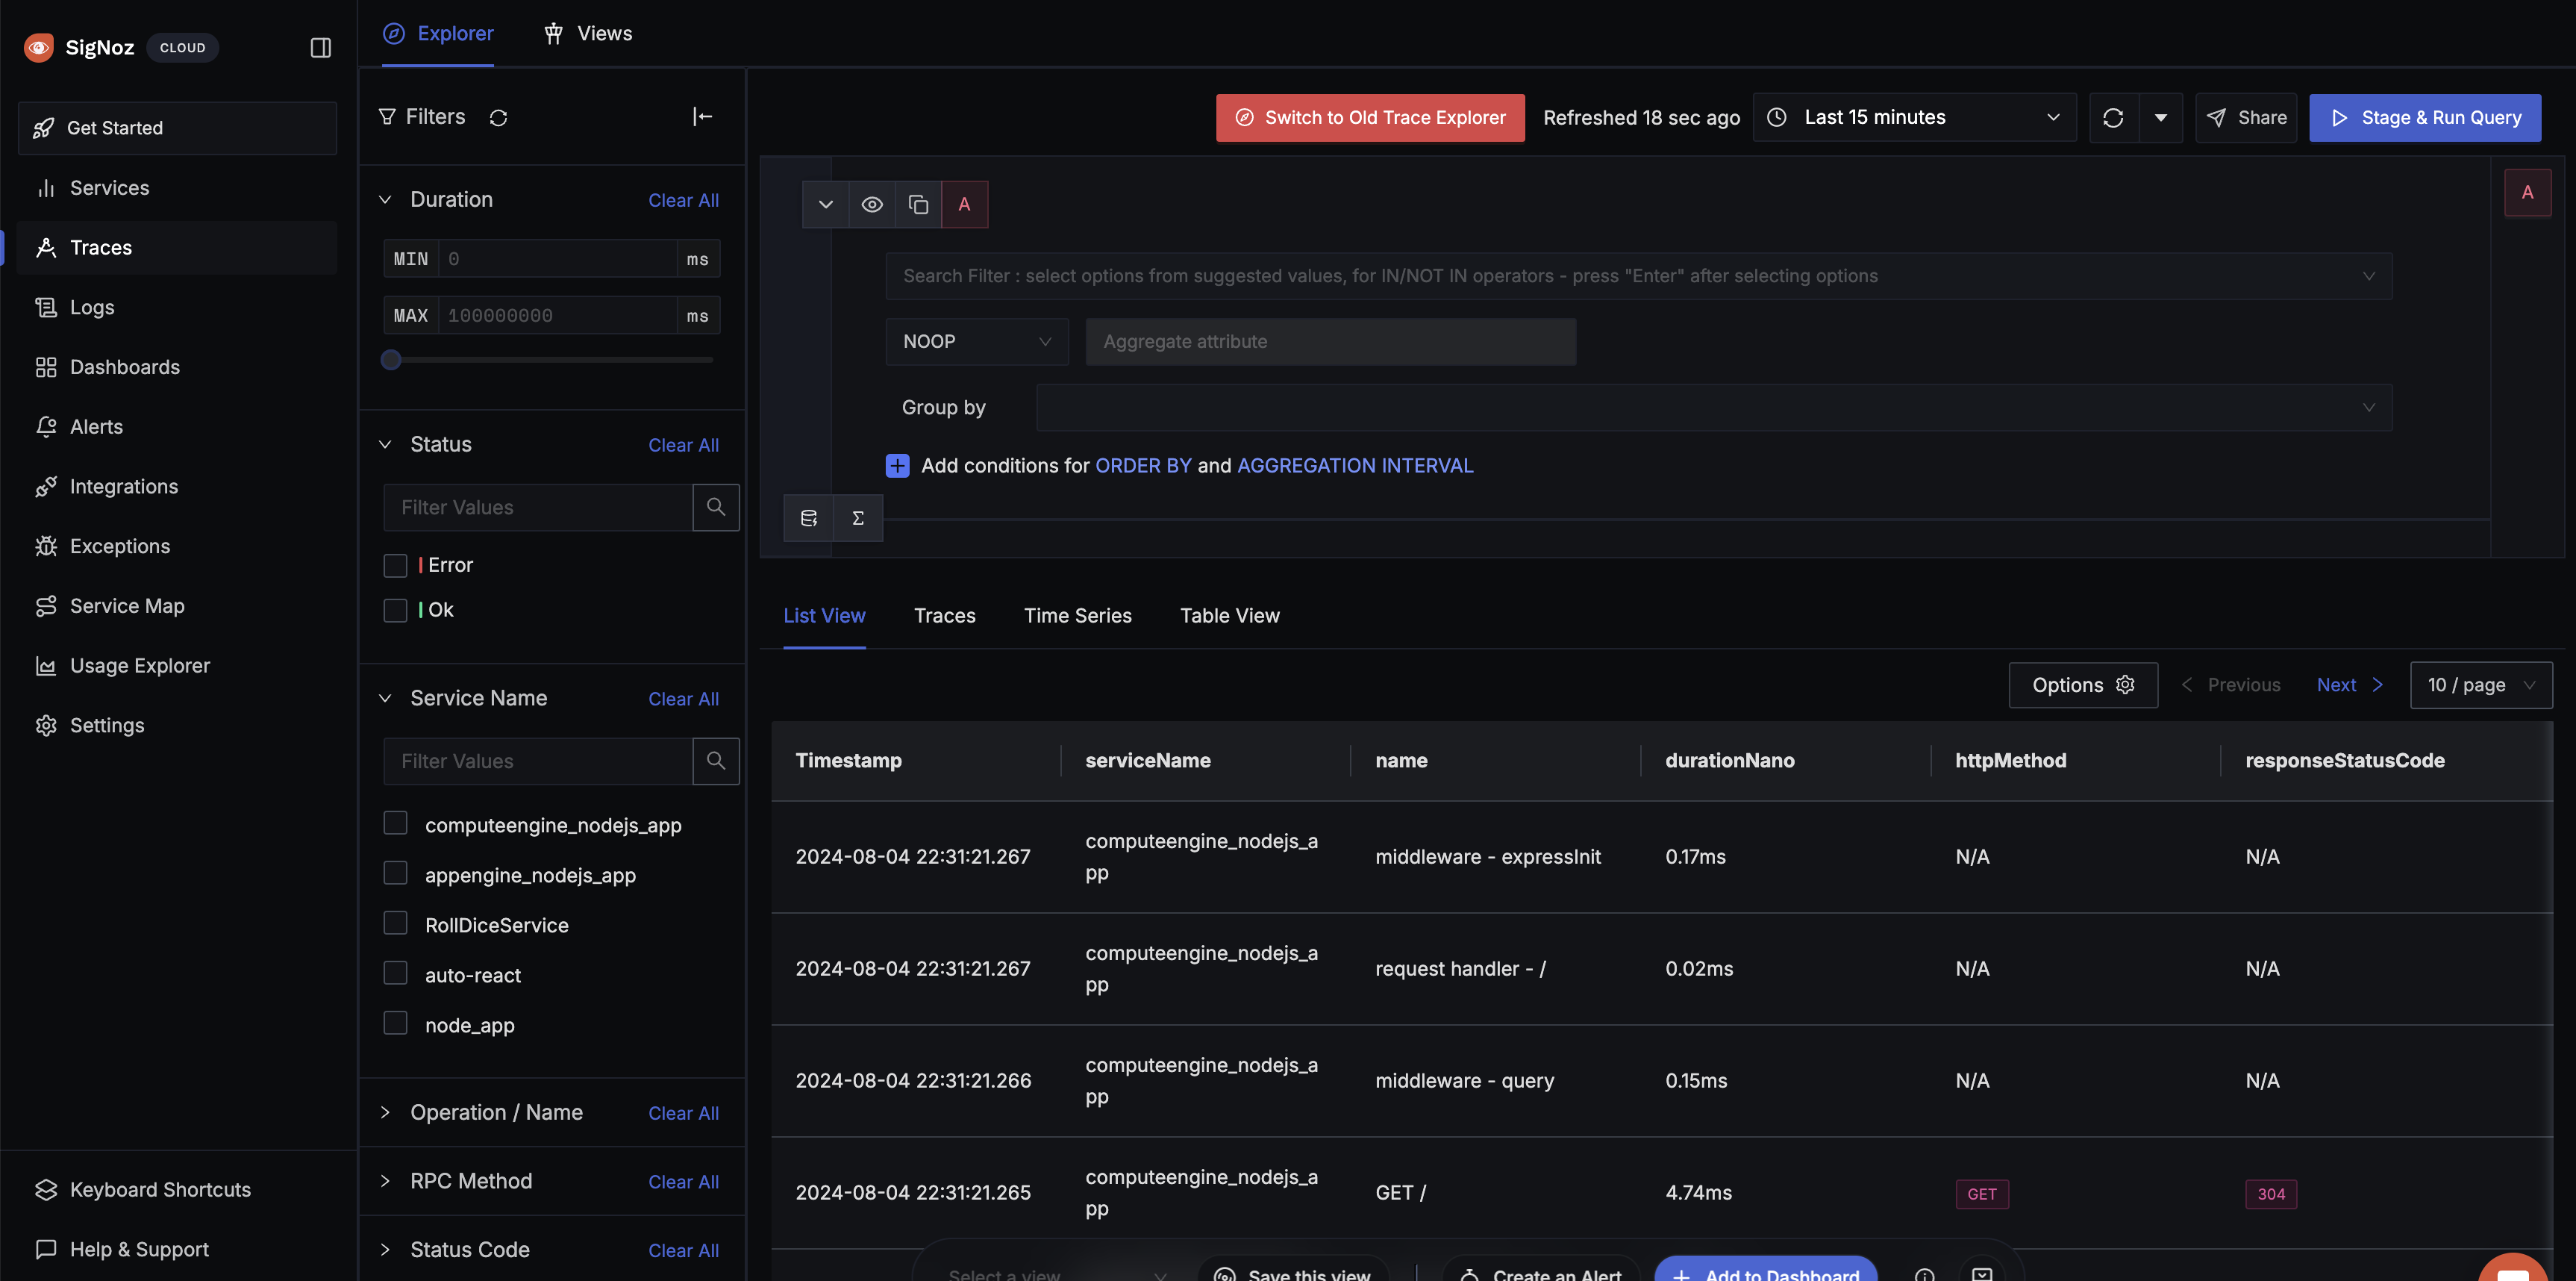
Compute Engine Traces
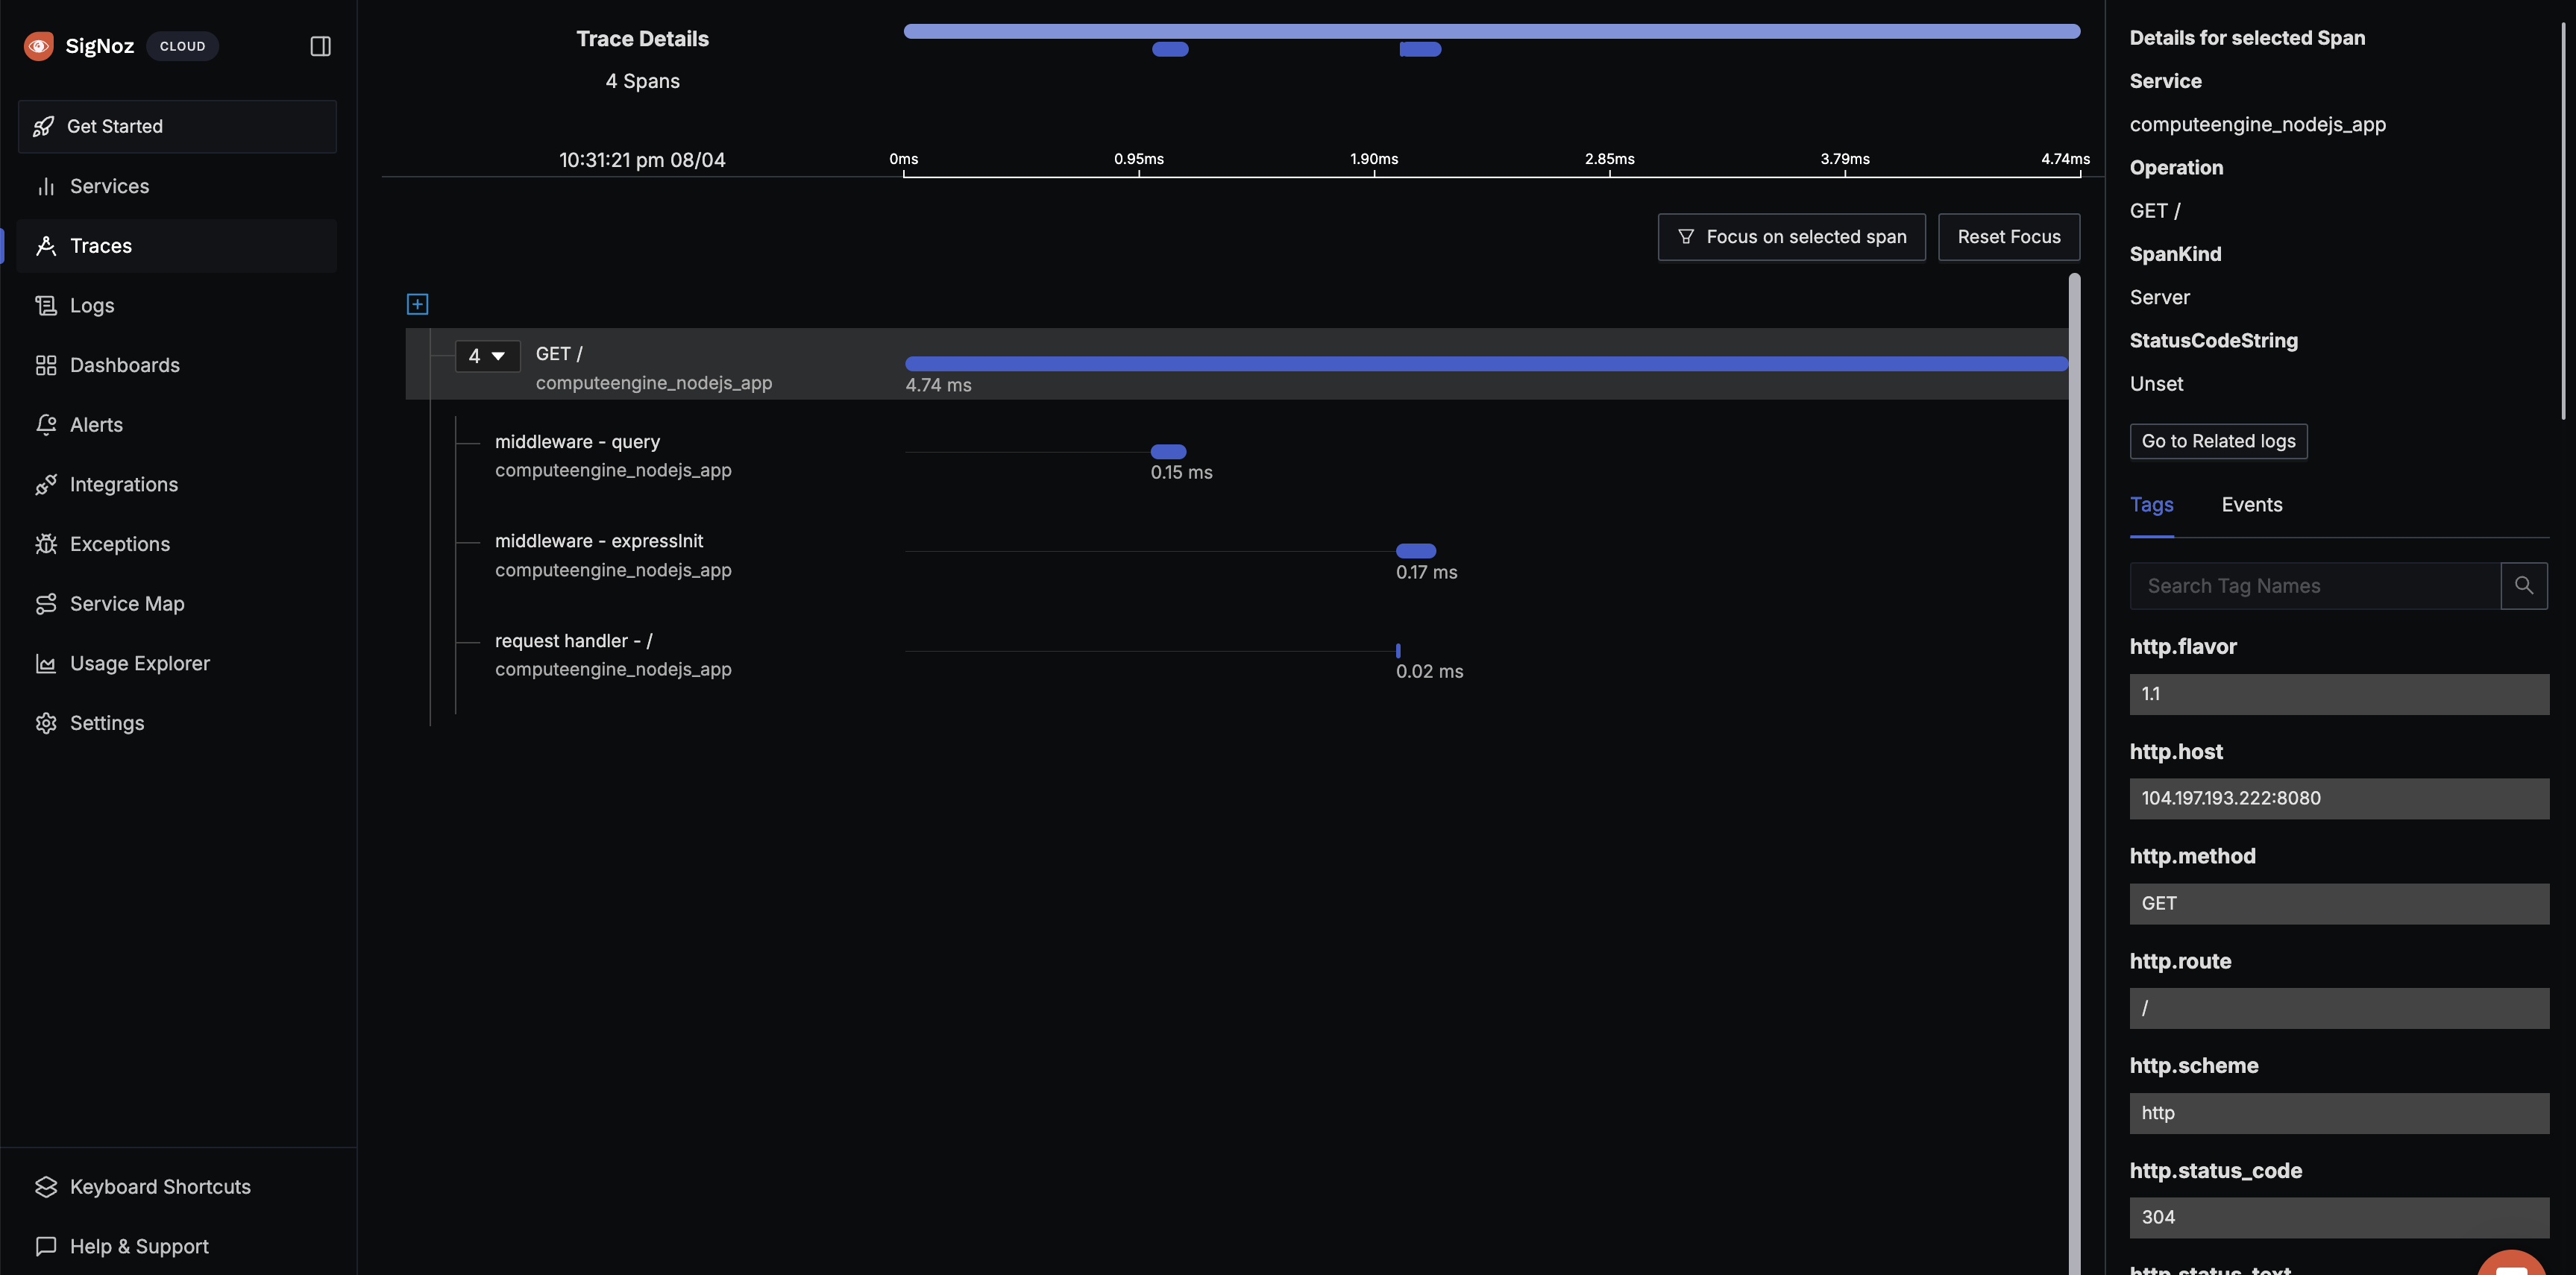
Compute Engine Detailed Trace
Here's a quick summary of what we will be doing in this guide
- Create and configure Compute Engine
- Create an application on Compute Engine with tracing auto-intrumentation
- Self-Host SigNoz
- Send and Visualize the logs in SigNoz
Prerequisites
- Google Cloud account with administrative privilege or Compute Instance Admin privilege.
- Access to a project in GCP
- Self-Hosted SigNoz
For more details on how to configure Self-Hosted SigNoz for Logs, check official documentation by Self-Hosted SigNoz and navigate to the "Send Logs to Self-Hosted SigNoz" section.
Get started with Compute Engine Configuration
Create the Compute Engine instance using the following steps:
Step 1: Go to your GCP console and search for Compute Engine, go to Compute Engine service and click on CREATE INSTANCE.
Create Compute Engine Instance
Step 2: Give an apprpriate name for the Compute Engine instance. Select an appropriate region and zone. You can choose a machine as per your requirements. After choosing all the appropriate settings, click on CREATE button at the bottom of the page.
Compute Engine Instance Settings
With this, the Compute Engine instance is created.
Create an application on Compute Engine
Please refer to our SigNoz Tutorials or Blog to find information on how to instrument your application like Spring, FastAPI, NextJS, Langchain, Node.js, Flask, Django, etc. with OpenTelemetry.
Here, we will be creating a NodeJS application.
Step 1: Please refer to this document to install Node.js and npm.
Step 2: Once the NodeJS and npm are installed, create a folder with an appropriate NodeJS service name, and change directory to that folder.
mkdir my-nodejs-service
cd my-nodejs-service
Step 3: Create the npm application using npm init.
Step 4: Install OpenTelemetry packages and express dependency.
npm install --save @opentelemetry/api@^1.6.0
npm install --save @opentelemetry/sdk-node@^0.45.0
npm install --save @opentelemetry/auto-instrumentations-node@^0.39.4
npm install --save @opentelemetry/exporter-trace-otlp-http@^0.45.0
npm install --save express
Step 5: Create server.js file
const express = require('express');
const app = express();

app.get('/', (req, res) => {
  res.send('Hello from Compute Engine!');
});

// Listen to the App Engine-specified port, or 8080 otherwise
const PORT = process.env.PORT || 8080;
app.listen(PORT, () => {
  console.log(`Server listening on port ${PORT}...`);
});
This file contains the actual application logic. Here, we have created a very simple application that opens a GET endpoint at / which sends out a statement "Hello from Compute Engine!" in the response.
Step 6: Create tracing.js file
You need to configure the endpoint for SigNoz cloud in this file. You can find your ingestion key from SigNoz cloud account details sent on your email.
// tracing.js
'use strict'
const process = require('process')
const opentelemetry = require('@opentelemetry/sdk-node')
const { getNodeAutoInstrumentations } = require('@opentelemetry/auto-instrumentations-node')
const { OTLPTraceExporter } = require('@opentelemetry/exporter-trace-otlp-http')
const { Resource } = require('@opentelemetry/resources')
const { SemanticResourceAttributes } = require('@opentelemetry/semantic-conventions')

// do not set headers in exporterOptions, the OTel spec recommends setting headers through ENV variables
// https://github.com/open-telemetry/opentelemetry-specification/blob/main/specification/protocol/exporter.md#specifying-headers-via-environment-variables

// highlight-start
const exporterOptions = {
  url: 'http://localhost:4318/v1/traces',
}
// highlight-end

const traceExporter = new OTLPTraceExporter(exporterOptions)
const sdk = new opentelemetry.NodeSDK({
  traceExporter,
  instrumentations: [getNodeAutoInstrumentations()],
  resource: new Resource({
    // highlight-next-line
    [SemanticResourceAttributes.SERVICE_NAME]: 'computeengine_nodejs_app',
  }),
})

// initialize the SDK and register with the OpenTelemetry API
// this enables the API to record telemetry
sdk.start()

// gracefully shut down the SDK on process exit
process.on('SIGTERM', () => {
  sdk
    .shutdown()
    .then(() => console.log('Tracing terminated'))
    .catch((error) => console.log('Error terminating tracing', error))
    .finally(() => process.exit(0))
})
In this example, we have used computeengine_nodejs_app as the service name. You can feel free to change it appropriately as per your use-case.
http://localhost:4318/v1/traces is the default url for sending your tracing data. We are assuming you have installed SigNoz on your localhost. Based on your environment, you can update it accordingly. It should be in the following format:
http://<IP of SigNoz backend>:4318/v1/traces
Step 7: Run the NodeJS applicaiton using the following command:
node -r ./tracing.js app.js
The application is now up and running on port 8080.
Open up the port on Compute Engine instance
In order to invoke the application, we need to open the port 8080 on the Compute Engine instance.
- On the GCP console, navigate to the Compute Engine page. Click on the instance where the NodeJS application is running.
- Scroll down to the
Network interfacessection, and click on the network interface name. - From the left side navigation menu, click on
Firewall. On the Firewall Policies page, click on CREATE FIREWALL RULE button at the top. - Put an appropraite name for the firewall rule, say
port-8080, and an appropriate description. - In the
Targetsdropdown, you can selectAll instances in the network, and in theSource IPv4 rangestextbox, put0.0.0.0/0. This will allow the incoming requests from any host. - In the
Protocols and portssection, tick theTCPcheckbox, and mention the port8080in the textbox. - Click on CREATE button at the bottom of the page.
With this, we have opened up incoming requests from any host to this VM instance at port 8080.
Invoking the NodeJS application
On the Compute Engine page on the GCP console, copy the External IP of the instance where the NodeJS application is running.
Now, on a new tab in your browser, invoke the URL: http://{external-ip-address}:8080/. You should receive the response Hello from Compute Engine! on your browser.
Also, this would have resulted in a trace which should now start appearing in SigNoz.
