Overview
This integration helps you monitor key AWS Elasticache (Redis) metrics and logs, view them with an out-of-the-box dashboard, and parse Redis logs for better querying and aggregation.
SigNoz Cloud users: You can also use the One-Click AWS Integration for automated setup with pre-built dashboards.
Prerequisites
Before you begin, ensure you have:
AWS Credentials and Permissions:
- Set up proper AWS credentials (e.g.,
AWS_ACCESS_KEY_IDandAWS_SECRET_ACCESS_KEYenvironment variables) - Required IAM permissions:
cloudwatch:ListMetricscloudwatch:GetMetricStatisticscloudwatch:GetMetricDatatag:GetResources(if aws_tag_select feature is used)logs:DescribeLogGroupslogs:FilterLogEvents
- Set up proper AWS credentials (e.g.,
Java Runtime Environment (JRE) version 11 or newer for the CloudWatch Exporter (Not required if using the Docker container)
An OpenTelemetry (OTEL) Collector (v0.88.0+):
- Install the OTEL Collector (v0.88.0+) if not already done
- Ensure you can provide config files and set environment variables for the collector
To collect Redis native metrics, the collector must be able to access the Redis server as a client (optional).
Collecting Elasticache Metrics
Step 1: Set up the Prometheus CloudWatch Exporter
- Download the exporter:
curl -sLSO https://github.com/prometheus/cloudwatch_exporter/releases/download/v0.15.5/cloudwatch_exporter-0.15.5-jar-with-dependencies.jar - Configure the Prometheus exporter Save the following config for collecting AWS ElastiCache metrics in a file named
aws-elasticache-metrics.yamland update the region key with relevant value.
---
region: us-east-1
metrics:
 - aws_namespace: AWS/ElastiCache
   aws_metric_name: CPUUtilization
   aws_dimensions: [CacheClusterId, CacheNodeId]
   aws_statistics: [Average, Maximum]

 - aws_namespace: AWS/ElastiCache
   aws_metric_name: FreeableMemory
   aws_dimensions: [CacheClusterId, CacheNodeId]
   aws_statistics: [Average, Maximum]

 - aws_namespace: AWS/ElastiCache
   aws_metric_name: NetworkBytesIn
   aws_dimensions: [CacheClusterId, CacheNodeId]
   aws_statistics: [Sum, Average]

 - aws_namespace: AWS/ElastiCache
   aws_metric_name: NetworkBytesOut
   aws_dimensions: [CacheClusterId, CacheNodeId]
   aws_statistics: [Sum, Average]

 - aws_namespace: AWS/ElastiCache
   aws_metric_name: NetworkPacketsIn
   aws_dimensions: [CacheClusterId, CacheNodeId]
   aws_statistics: [Sum, Average]

 - aws_namespace: AWS/ElastiCache
   aws_metric_name: NetworkPacketsOut
   aws_dimensions: [CacheClusterId, CacheNodeId]
   aws_statistics: [Sum, Average]

 - aws_namespace: AWS/ElastiCache
   aws_metric_name: SwapUsage
   aws_dimensions: [CacheClusterId, CacheNodeId]
   aws_statistics: [Average, Maximum]

 - aws_namespace: AWS/ElastiCache
   aws_metric_name: BytesUsedForCache
   aws_dimensions: [CacheClusterId, CacheNodeId]
   aws_statistics: [Sum, Maximum]

 - aws_namespace: AWS/ElastiCache
   aws_metric_name: CacheHits
   aws_dimensions: [CacheClusterId, CacheNodeId]
   aws_statistics: [Sum]

 - aws_namespace: AWS/ElastiCache
   aws_metric_name: CacheMisses
   aws_dimensions: [CacheClusterId, CacheNodeId]
   aws_statistics: [Sum]

 - aws_namespace: AWS/ElastiCache
   aws_metric_name: CacheHitRate
   aws_dimensions: [CacheClusterId, CacheNodeId]
   aws_statistics: [Average]

 - aws_namespace: AWS/ElastiCache
   aws_metric_name: CurrConnections
   aws_dimensions: [CacheClusterId, CacheNodeId]
   aws_statistics: [Average, Maximum]

 - aws_namespace: AWS/ElastiCache
   aws_metric_name: CurrItems
   aws_dimensions: [CacheClusterId, CacheNodeId]
   aws_statistics: [Average, Maximum]

 - aws_namespace: AWS/ElastiCache
   aws_metric_name: CurrVolatileItems
   aws_dimensions: [CacheClusterId, CacheNodeId]
   aws_statistics: [Average, Maximum]

 - aws_namespace: AWS/ElastiCache
   aws_metric_name: ReplicationLag
   aws_dimensions: [CacheClusterId, CacheNodeId]
   aws_statistics: [Maximum]

 - aws_namespace: AWS/ElastiCache
   aws_metric_name: ReplicationLag
   aws_dimensions: [CacheClusterId, CacheNodeId]
   aws_statistics: [Maximum]

 - aws_namespace: AWS/ElastiCache
   aws_metric_name: SaveInProgress
   aws_dimensions: [CacheClusterId, CacheNodeId]

 - aws_namespace: AWS/ElastiCache
   aws_metric_name: TrafficManagementActive
   aws_dimensions: [CacheClusterId, CacheNodeId]

 - aws_namespace: AWS/ElastiCache
   aws_metric_name: DatabaseCapacityUsagePercentage
   aws_dimensions: [CacheClusterId, CacheNodeId]
   aws_statistics: [Average, Maximum]

 - aws_namespace: AWS/ElastiCache
   aws_metric_name: DatabaseMemoryUsagePercentage
   aws_dimensions: [CacheClusterId, CacheNodeId]
   aws_statistics: [Average, Maximum]

 - aws_namespace: AWS/ElastiCache
   aws_metric_name: EngineCPUUtilization
   aws_dimensions: [CacheClusterId, CacheNodeId]
   aws_statistics: [Average, Maximum]

 - aws_namespace: AWS/ElastiCache
   aws_metric_name: Evictions
   aws_dimensions: [CacheClusterId, CacheNodeId]
   aws_statistics: [Sum, Average]

 - aws_namespace: AWS/ElastiCache
   aws_metric_name: GlobalDatastoreReplicationLag
   aws_dimensions: [CacheClusterId, CacheNodeId]
   aws_statistics: [Average, Maximum]

 - aws_namespace: AWS/ElastiCache
   aws_metric_name: MemoryFragmentationRatio
   aws_dimensions: [CacheClusterId, CacheNodeId]
   aws_statistics: [Average, Maximum]

 - aws_namespace: AWS/ElastiCache
   aws_metric_name: MemoryFragmentationRatio
   aws_dimensions: [CacheClusterId, CacheNodeId]
   aws_statistics: [Sum, Average]
- Run the following command:
java -jar cloudwatch_exporter-0.15.5-jar-with-dependencies.jar 9106 aws-elasticache-metrics.yaml
Step 2: Create the OTEL Collector Config File
Create redis-metrics-collection-config.yaml:
receivers:
  redis:
    # The hostname and port of the Redis instance, separated by a colon.
    endpoint: ${env:REDIS_ENDPOINT}
    # The frequency at which to collect metrics from the Redis instance.
    collection_interval: 60s
    # The password used to access the Redis instance; must match the password specified in the requirepass server configuration option.
    password: ${env:REDIS_PASSWORD}
    # # Defines the network to use for connecting to the server. Valid Values are `tcp` or `Unix`
    # transport: tcp
    # tls:
    #   insecure: false
    #   ca_file: /etc/ssl/certs/ca-certificates.crt
    #   cert_file: /etc/ssl/certs/redis.crt
    #   key_file: /etc/ssl/certs/redis.key
    metrics:
      redis.maxmemory:
        enabled: true
      redis.cmd.latency:
        enabled: true

  prometheus:
    config:
      scrape_configs:
        - job_name: 'aws-cloudwatch-metrics'
          scrape_timeout: 120s
          scrape_interval: 120s
          static_configs:
            - targets: ['0.0.0.0:9106']

exporters:
  # export to local collector
  otlp/local:
    endpoint: "localhost:4317"
    tls:
      insecure: true
  # export to SigNoz cloud
  otlp/signoz:
    endpoint: "${env:OTLP_DESTINATION_ENDPOINT}"
    tls:
      insecure: false
    headers:
      "signoz-ingestion-key": "${env:SIGNOZ_INGESTION_KEY}"

service:
  pipelines:
    metrics/redis:
      receivers: [redis, prometheus]
      processors: []
      exporters: [otlp/signoz]
Step 3: Set Environment Variables
# The accessible endpoint where redis server is running.
# The hostname and port of the Redis instance, separated by a colon.
export REDIS_ENDPOINT="<redis-server-endpoint>"

# The password to use for accessing redis instance
export REDIS_PASSWORD="<PASSWORD>"

# region specific SigNoz cloud ingestion endpoint
export OTLP_DESTINATION_ENDPOINT="ingest.<region>.signoz.cloud:443"

# your SigNoz ingestion key
export SIGNOZ_INGESTION_KEY="<your-ingestion-key>"
Verify these values:
<redis-server-endpoint>: The hostname and port of your ElastiCache Redis instance (e.g.,my-redis.xxxx.cache.amazonaws.com:6379)<PASSWORD>: Your Redis AUTH password (if configured)<region>: Your SigNoz Cloud region<your-ingestion-key>: Your SigNoz ingestion key
Step 4: Use the Collector Config File
Add the following flag to your collector run command:
--config redis-metrics-collection-config.yaml
Note: The collector can use multiple config files by specifying multiple --config flags.
Collecting ElastiCache Logs
Use the log delivery instructions to send Redis logs to CloudWatch Logs.
The log collection of ElastiCache instance requires specifying the list of log group names. From the AWS CloudWatch console, please find the log group(s) relevant to the integration.
Step 1: Create the Collector Config File
Create redis-logs-collection-config.yaml:
receivers:
  awscloudwatch:
    region: us-east-1
    logs:
      poll_interval: 1m
      groups:
        named:
          # replace the following name with your log group for elasticache logs
          /aws/elasticache/:

processors:
  attributes/add_source:
    actions:
      - key: source
        value: "elasticache_redis"
        action: insert
  batch:
    send_batch_size: 10000
    send_batch_max_size: 11000
    timeout: 10s

exporters:
  # export to SigNoz cloud
  otlp/redis-logs:
    endpoint: "${env:OTLP_DESTINATION_ENDPOINT}"
    tls:
      insecure: false
    headers:
      "signoz-ingestion-key": "${env:SIGNOZ_INGESTION_KEY}"

  # export to local collector
  otlp/local:
    endpoint: "localhost:4317"
    tls:
      insecure: true

service:
  pipelines:
    logs/redis:
      receivers: [awscloudwatch]
      processors: [attributes/add_source, batch]
      exporters: [otlp/redis-logs]
Step 2: Set Environment Variables
# region specific SigNoz cloud ingestion endpoint
export OTLP_DESTINATION_ENDPOINT="ingest.<region>.signoz.cloud:443"

# your SigNoz ingestion key
export SIGNOZ_INGESTION_KEY="<your-ingestion-key>"
Verify the following:
<region>: Your SigNoz Cloud region<your-ingestion-key>: Your SigNoz ingestion key
Step 3: Run the Collector
Add to your collector run command:
--config redis-logs-collection-config.yaml
Note: The collector can use multiple config files by specifying multiple --config flags.
Connect AWS Elasticache (redis)
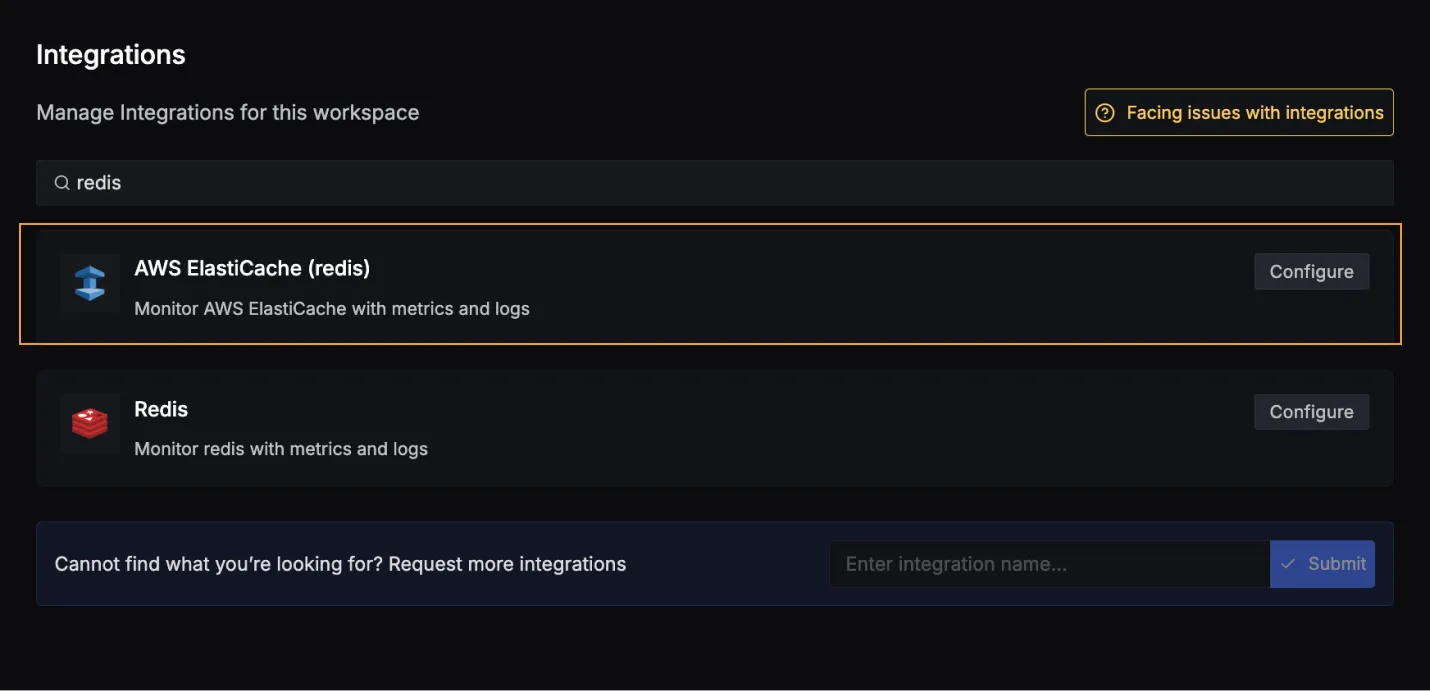
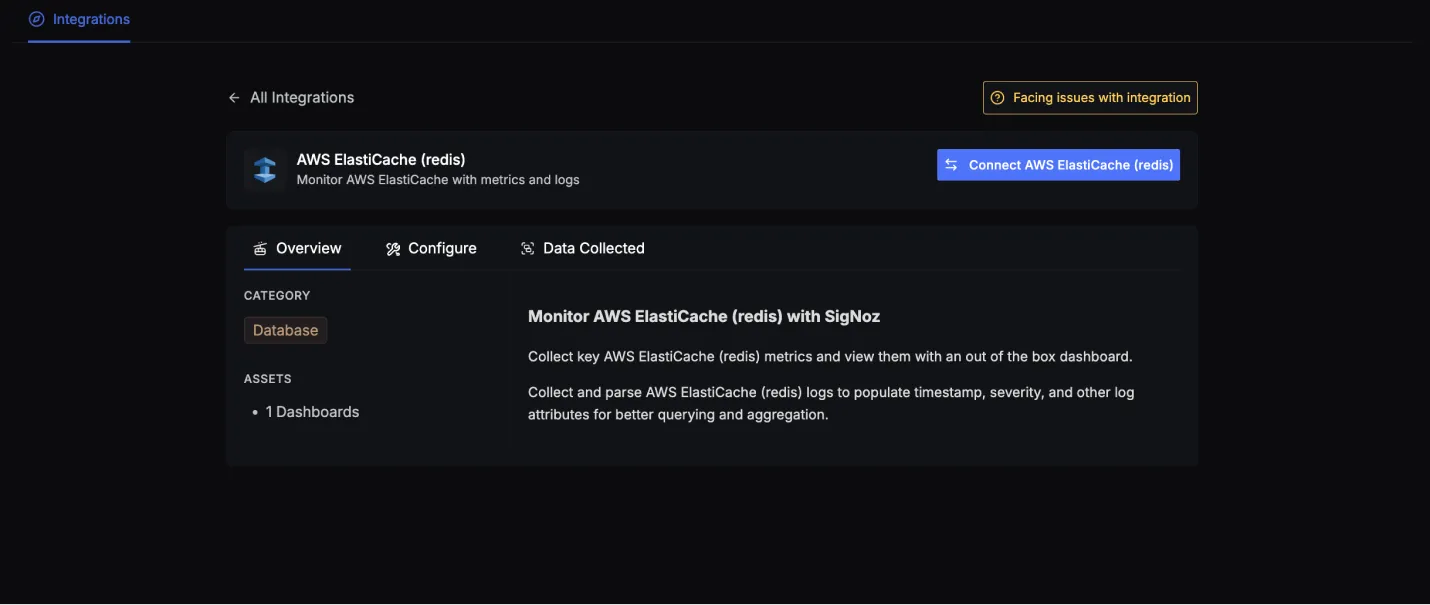
Once you're done with setting up AWS Elasticache (redis) for collecting metrics and logs, head over to the intergrations tab in SigNoz and search for the AWS Elasticache (redis) integration.
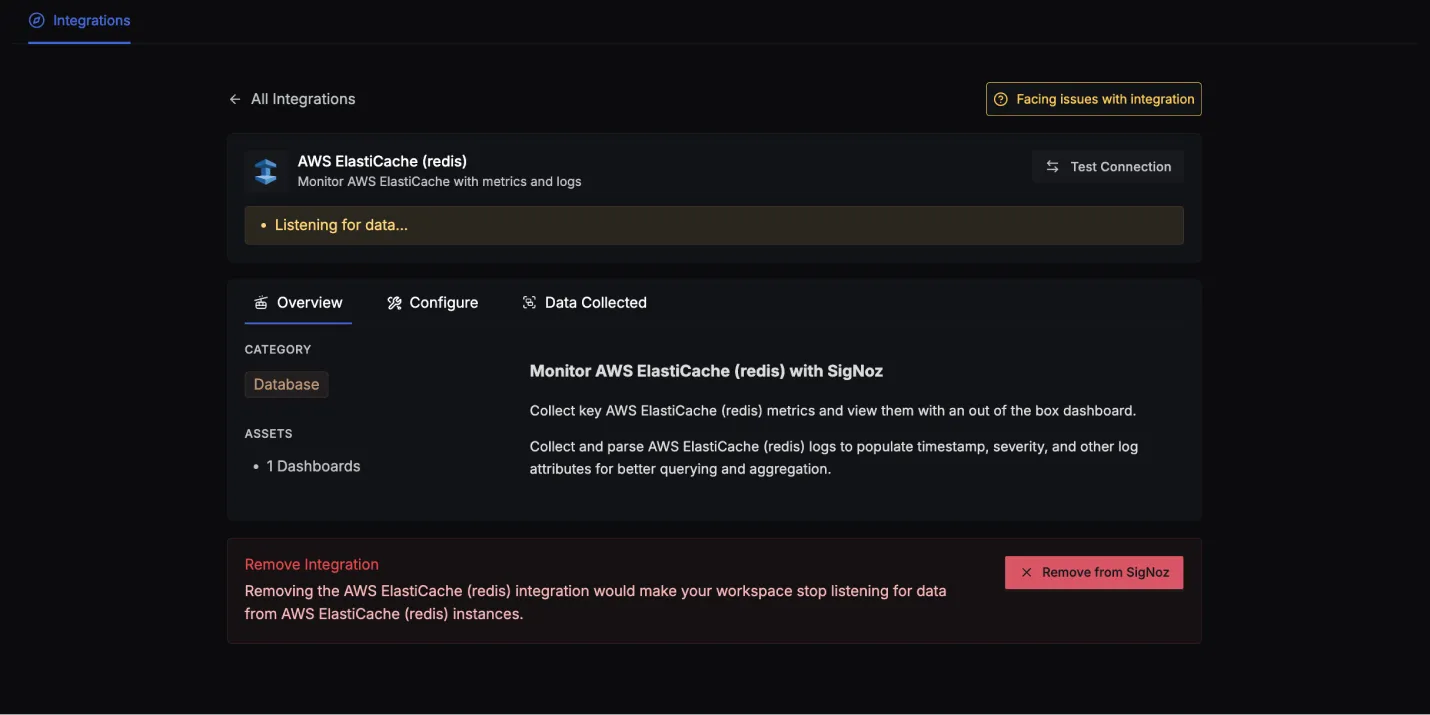
Click on the Connect AWS Elasticache (redis) Button, and select I have already configured, this will start listening for data from your AWS Elasticache (redis) instance. To stop this, you can select the Remove from SigNoz button.
AWS Elasticache (redis) dashboard
Once SigNoz has started listening to your AWS Elasticache (redis) data, head over to the Dashboards tab and search for redis, this will show you a newly created dashboard which shows different AWS Elasticache (redis) metrics.

Dashboard asset
You can also manually create the above Dashboards by importing the JSON file available here. To learn how to create Dashboards, checkout this documentation.
Data Collected
When you switch to the Data Collected tab of your AWS Elasticache (redis) Integrations, it shows you details about the different logs attributes and the metrics types that you can monitor for your AWS Elasticache (redis) instance. The tables below gives you a list of the different logs attributes and metrics available.
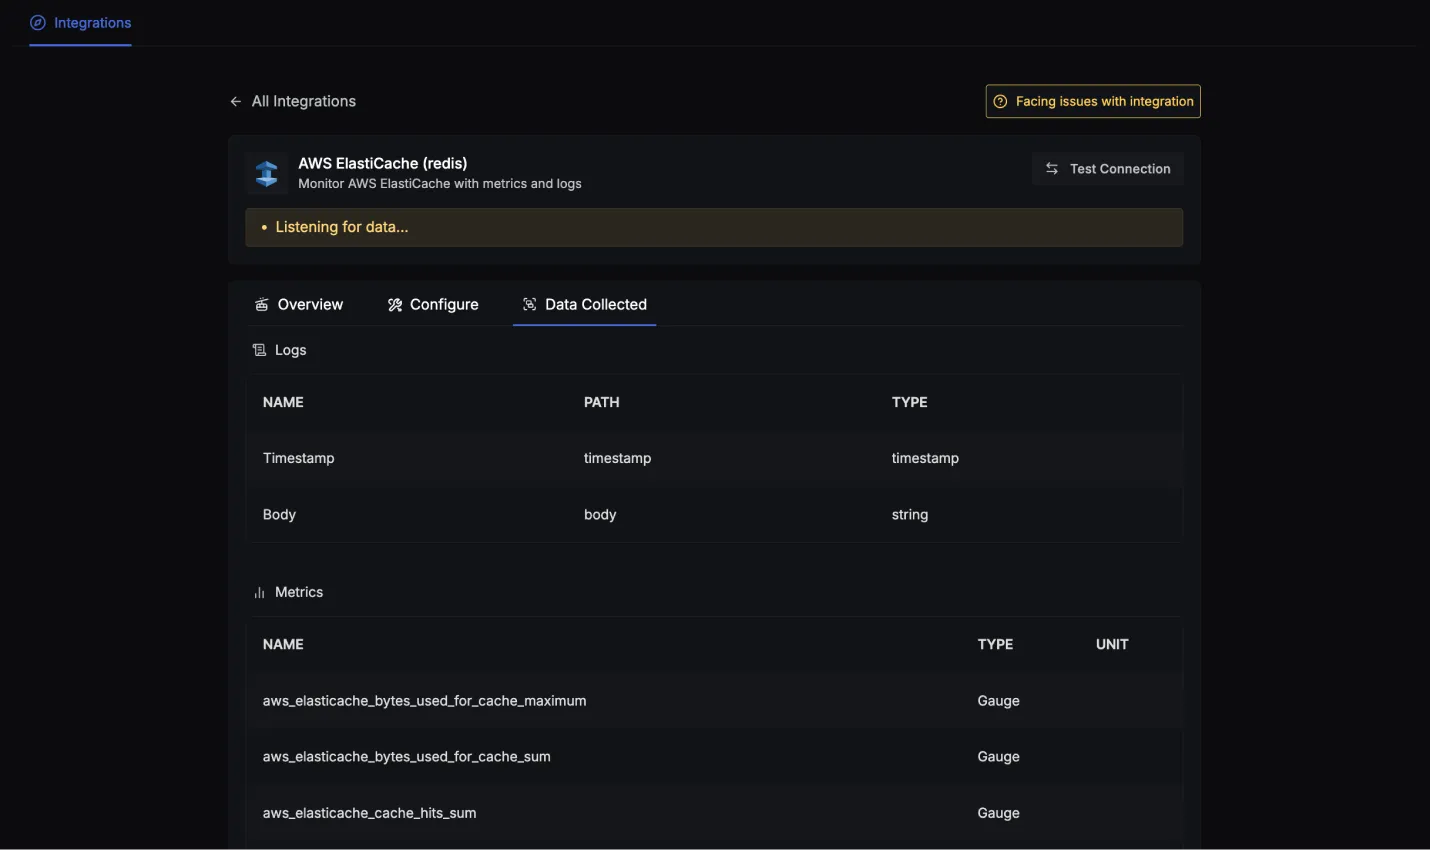
AWS Elasticache (redis) log attributes
- Name: The name of the log attribute.
- Path: The specific location or attribute within a log entry where the corresponding data can be found.
- Type: The data type of the log attribute.
| Name | Path | Type |
|---|---|---|
| Timestamp | timestamp | timestamp |
| Body | body | string |
AWS Elasticache (redis) metrics
- Name: The name of the metric.
- Type: The type of the metric (e.g., Sum, Gauge).
- Unit: The unit of measurement for the metric.
- Description: A brief description of what the metric represents.
To find a complete list of metrics you can checkout this link or the Data Collected tab.
