Overview
This integration helps you monitor key Clickhouse metrics and logs, view them with an out-of-the-box dashboard, and collect query logs for better querying and aggregation.
Prerequisites
Before you begin, ensure you have:
- A Clickhouse server running version 23 or newer
- An OpenTelemetry (OTEL) Collector with access to the Clickhouse server
- Install the SigNoz OTEL Collector (v0.88.0 or newer, v0.88.23+ for query log collection) if not done already
- Ensure you can provide config files and set environment variables for the collector
- Ensure the OTEL collector has access to the Clickhouse server for metrics collection and can read the Clickhouse server log file for logs collection
Preparing Clickhouse Server
Check Clickhouse Version
Ensure your Clickhouse server is running a supported version (v23 or newer):
SELECT version();
Configure Prometheus Metrics Export
If collecting metrics, ensure that Clickhouse is configured to export Prometheus metrics. Follow the Clickhouse Prometheus configuration guide if needed.
Create Monitoring User
If collecting query logs, create a monitoring user with required permissions:
CREATE USER monitoring IDENTIFIED BY 'monitoring_password';
GRANT SELECT ON system.query_log to monitoring;
-- If monitoring a clustered deployment, also grant privilege for executing remote queries
GRANT REMOTE ON *.* TO 'monitoring' on CLUSTER 'cluster_name';
Collecting Clickhouse Metrics
Step 1: Create the Collector Config File
Create a file named clickhouse-metrics-collection-config.yaml with the following content:
receivers:
  prometheus/clickhouse:
    config:
      global:
        scrape_interval: 60s
      scrape_configs:
        - job_name: clickhouse
          static_configs:
            - targets:
                - ${env:CLICKHOUSE_PROM_METRICS_ENDPOINT}
          metrics_path: ${env:CLICKHOUSE_PROM_METRICS_PATH}

processors:
  # enriches the data with additional host information
  # see https://github.com/open-telemetry/opentelemetry-collector-contrib/tree/main/processor/resourcedetectionprocessor#resource-detection-processor
  resourcedetection/system:
    # add additional detectors if needed
    detectors: ["system"]
    system:
      hostname_sources: ["os"]

exporters:
  # export to SigNoz cloud
  otlp/clickhouse:
    endpoint: "${env:OTLP_DESTINATION_ENDPOINT}"
    tls:
      insecure: false
    headers:
      "signoz-ingestion-key": "${env:SIGNOZ_INGESTION_KEY}"

  # export to local collector
  # otlp/clickhouse:
  #   endpoint: "localhost:4317"
  #   tls:
  #     insecure: true

service:
  pipelines:
    metrics/clickhouse:
      receivers: [prometheus/clickhouse]
      # note: remove this processor if the collector host is not running on the same host as the clickhouse instance
      processors: [resourcedetection/system]
      exporters: [otlp/clickhouse]
Step 2: Set Environment Variables
Set the following environment variables:
# Prometheus metrics endpoint on the clickhouse server
export CLICKHOUSE_PROM_METRICS_ENDPOINT="clickhouse:9363"

# Prometheus metrics path on the clickhouse server
export CLICKHOUSE_PROM_METRICS_PATH="/metrics"

# region specific SigNoz cloud ingestion endpoint
export OTLP_DESTINATION_ENDPOINT="ingest.us.signoz.cloud:443"

# your SigNoz ingestion key
export SIGNOZ_INGESTION_KEY="signoz-ingestion-key"
You can find more details about ingestion keys and Regions here
Step 3: Use the Collector Config File
Add the following flag to your collector run command:
--config clickhouse-metrics-collection-config.yaml
Note: The collector can use multiple config files by specifying multiple --config flags.
Collecting Clickhouse Server Logs
You can configure Clickhouse server logs collection by providing the required collector config to your collector.
Step 1: Create the Collector Config File
Create a file named clickhouse-logs-collection-config.yaml with the following content:
receivers:
  filelog/clickhouse:
    include: ["${env:CLICKHOUSE_LOG_FILE}"]
    operators:
      # Parse default clickhouse text log format.
      # See https://github.com/ClickHouse/ClickHouse/blob/master/src/Loggers/OwnPatternFormatter.cpp
      - type: recombine
        source_identifier: attributes["log.file.name"]
        is_first_entry: body matches '^\\d{4}\\.\\d{2}\\.\\d{2}\\s+'
        combine_field: body
        overwrite_with: oldest
      - type: regex_parser
        parse_from: body
        if: body matches '^(?P<ts>\\d{4}\\.\\d{2}\\.\\d{2} \\d{2}:\\d{2}:\\d{2}.?[0-9]*)\\s+\\[\\s+(\\x1b.*?m)?(?P<thread_id>\\d*)(\\x1b.*?m)?\\s+\\]\\s+{((\\x1b.*?m)?(?P<query_id>[0-9a-zA-Z-_]*)(\\x1b.*?m)?)?}\\s+<(\\x1b.*?m)?(?P<log_level>\\w*)(\\x1b.*?m)?>\\s+((\\x1b.*?m)?(?P<clickhouse_component>[a-zA-Z0-9_]+)(\\x1b.*?m)?:)?\\s+(?s)(?P<message>.*)$'
        regex: '^(?P<ts>\d{4}\.\d{2}\.\d{2} \d{2}:\d{2}:\d{2}.?[0-9]*)\s+\[\s+(\x1b.*?m)?(?P<thread_id>\d*)(\x1b.*?m)?\s+\]\s+{((\x1b.*?m)?(?P<query_id>[0-9a-zA-Z-_]*)(\x1b.*?m)?)?}\s+<(\x1b.*?m)?(?P<log_level>\w*)(\x1b.*?m)?>\s+((\x1b.*?m)?(?P<clickhouse_component>[a-zA-Z0-9_]+)(\x1b.*?m)?:)?\s+(?s)(?P<message>.*)$'
      - type: time_parser
        if: attributes.ts != nil
        parse_from: attributes.ts
        layout_type: gotime
        layout: 2006.01.02 15:04:05.999999
        location: ${env:CLICKHOUSE_TIMEZONE}
      - type: remove
        if: attributes.ts != nil
        field: attributes.ts
      - type: severity_parser
        if: attributes.log_level != nil
        parse_from: attributes.log_level
        overwrite_text: true
        # For mapping details, see getPriorityName defined in https://github.com/ClickHouse/ClickHouse/blob/master/src/Interpreters/InternalTextLogsQueue.cpp
        mapping:
          trace:
            - Trace
            - Test
          debug: Debug
          info:
            - Information
            - Notice
          warn: Warning
          error: Error
          fatal:
            - Fatal
            - Critical
      - type: remove
        if: attributes.log_level != nil
        field: attributes.log_level
      - type: move
        if: attributes.message != nil
        from: attributes.message
        to: body
      - type: add
        field: attributes.source
        value: clickhouse

processors:
  batch:
    send_batch_size: 10000
    send_batch_max_size: 11000
    timeout: 10s

exporters:
  # export to SigNoz cloud
  otlp/clickhouse-logs:
    endpoint: "${env:OTLP_DESTINATION_ENDPOINT}"
    tls:
      insecure: false
    headers:
      "signoz-ingestion-key": "${env:SIGNOZ_INGESTION_KEY}"

  # export to local collector
  # otlp/clickhouse-logs:
  #   endpoint: "localhost:4317"
  #   tls:
  #     insecure: true

service:
  pipelines:
    logs/clickhouse:
      receivers: [filelog/clickhouse]
      processors: [batch]
      exporters: [otlp/clickhouse-logs]
Step 2: Set Environment Variables
Set the following environment variables:
# Path of Clickhouse server log file
export CLICKHOUSE_LOG_FILE="/var/log/clickhouse-server/server.log"

# Timezone of the Clickhouse server
export CLICKHOUSE_TIMEZONE="Etc/UTC"

# Region specific SigNoz cloud ingestion endpoint
export OTLP_DESTINATION_ENDPOINT="ingest.{REGION}.signoz.cloud:443"

# Your SigNoz ingestion key
export SIGNOZ_INGESTION_KEY="signoz-ingestion-key"
You can find more details about ingestion keys and Regions here
Step 3: Use the Collector Config File
Add the following flag to your collector run command:
--config clickhouse-logs-collection-config.yaml
Note: The collector can use multiple config files by specifying multiple --config flags.
Collecting Clickhouse Query Logs
Step 1: Create the Collector Config File
Create a file named clickhouse-query-logs-collection-config.yaml with the following content:
receivers:
  clickhousesystemtablesreceiver/query_log:
    dsn: "${env:CLICKHOUSE_MONITORING_DSN}"
    cluster_name: "${env:CLICKHOUSE_CLUSTER_NAME}"
    query_log_scrape_config:
      scrape_interval_seconds: ${env:QUERY_LOG_SCRAPE_INTERVAL_SECONDS}
      min_scrape_delay_seconds: ${env:QUERY_LOG_SCRAPE_DELAY_SECONDS}

exporters:
  # export to SigNoz cloud
  otlp/clickhouse-query-logs:
    endpoint: "${env:OTLP_DESTINATION_ENDPOINT}"
    tls:
      insecure: false
    headers:
      "signoz-ingestion-key": "${env:SIGNOZ_INGESTION_KEY}"

  # export to local collector
  # otlp/clickhouse-query-logs:
  #   endpoint: "localhost:4317"
  #   tls:
  #     insecure: true

service:
  pipelines:
    logs/clickhouse-query-logs:
      receivers: [clickhousesystemtablesreceiver/query_log]
      processors: []
      exporters: [otlp/clickhouse-query-logs]
Step 2: Set Environment Variables
Set the following environment variables:
# DSN for connecting to clickhouse with the monitoring user
export CLICKHOUSE_MONITORING_DSN="tcp://monitoring:monitoring_password@clickhouse:9000/"

# If collecting query logs from a clustered deployment, specify a non-empty cluster name
export CLICKHOUSE_CLUSTER_NAME=""

# Rows from query_log table will be collected periodically based on this setting
export QUERY_LOG_SCRAPE_INTERVAL_SECONDS=20

# Must be greater than flush_interval_milliseconds setting for query_log
export QUERY_LOG_SCRAPE_DELAY_SECONDS=8

# region specific SigNoz cloud ingestion endpoint
export OTLP_DESTINATION_ENDPOINT="ingest.{REGION}.signoz.cloud:443"

# your SigNoz ingestion key
export SIGNOZ_INGESTION_KEY="signoz-ingestion-key"
You can find more details about ingestion keys and Regions here
Step 3: Use the Collector Config File
Add the following flag to your collector run command:
--config clickhouse-query-logs-collection-config.yaml
Note:
- Only one collector instance should be configured to collect
query_logs. Using multiple instances or replicas will lead to duplicate logs. - The collector can use multiple config files by specifying multiple
--configflags.
Connect Clickhouse
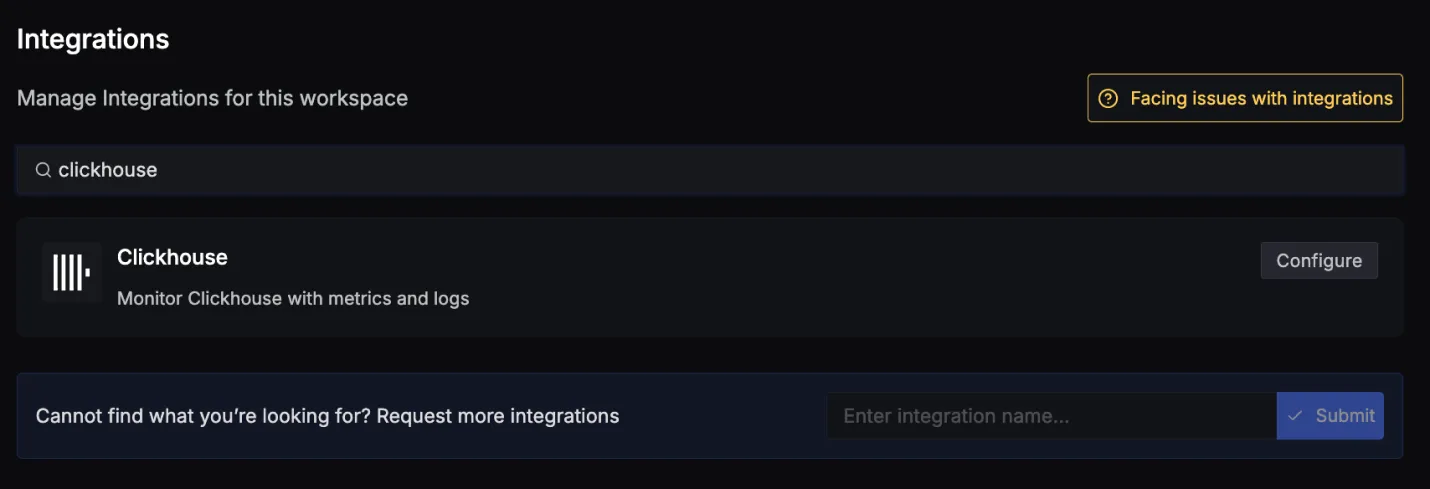
Once you've set up Clickhouse for collecting metrics and logs, go to the integrations tab in SigNoz and search for the Clickhouse integration.
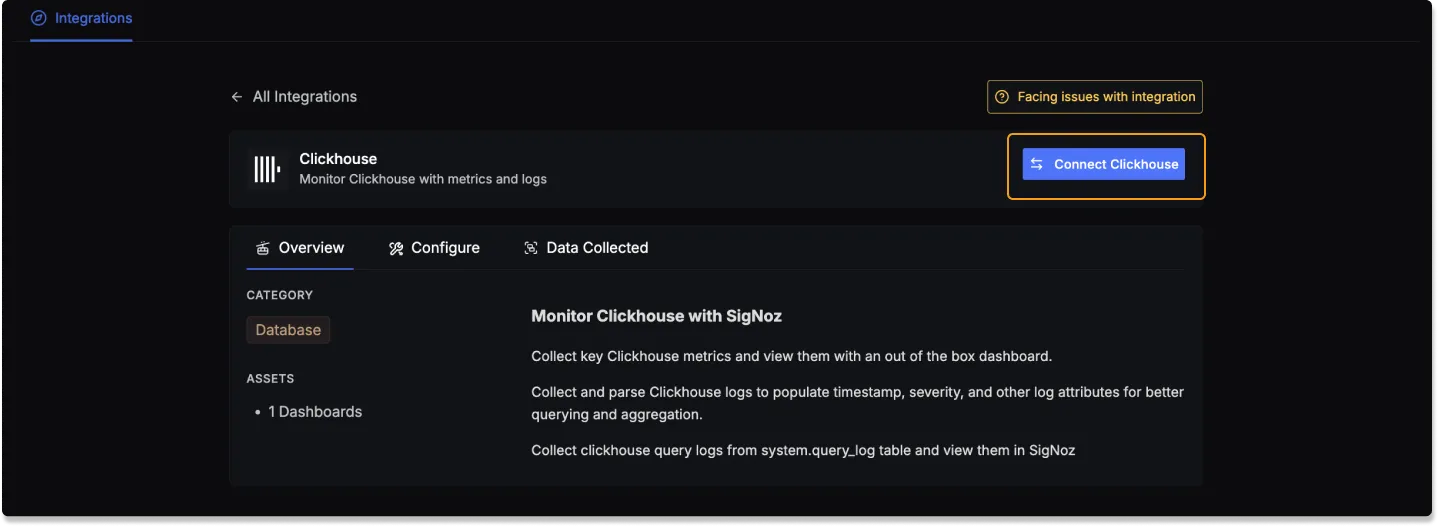
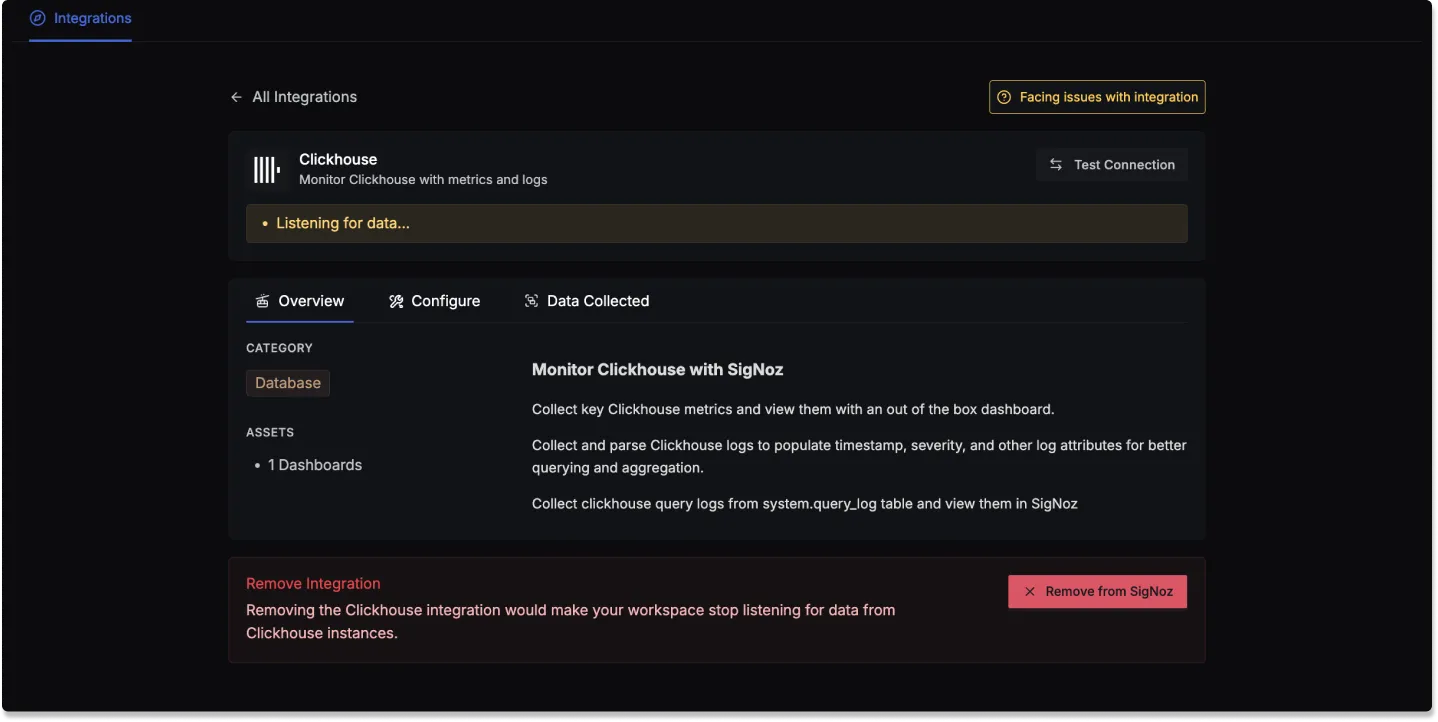
Click on the Connect Clickhouse Button, and select I have already configured. This will start listening for data from your Clickhouse instance. To stop this, you can select the Remove from SigNoz button.
Clickhouse dashboard
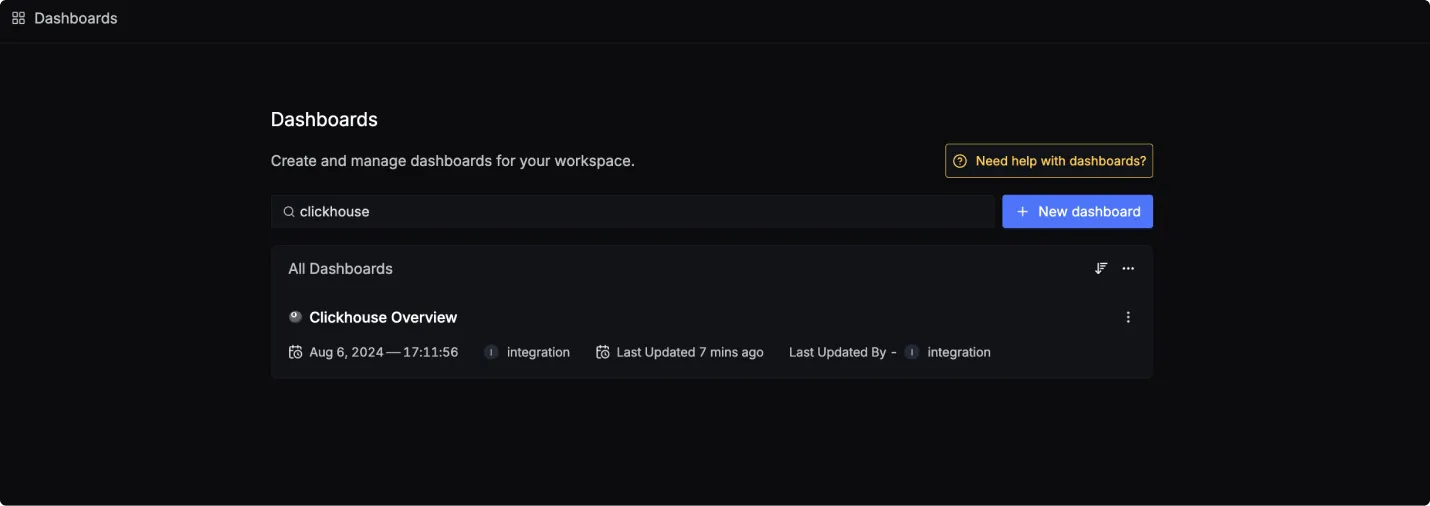
Once SigNoz has started listening to your Clickhouse data, go to the Dashboards tab and search for Clickhouse. This will show you a newly created dashboard which displays various Clickhouse metrics and query log information.
Dashboard asset
You can also manually create the above Clickhouse Dashboard by importing the JSON file available here. To learn how to create Dashboards, checkout this documentation.
Data Collected
When you switch to the Data Collected tab of your Clickhouse Integration, it shows you details about the different metrics types, server log attributes, and query log attributes that you can monitor for your Clickhouse instance.
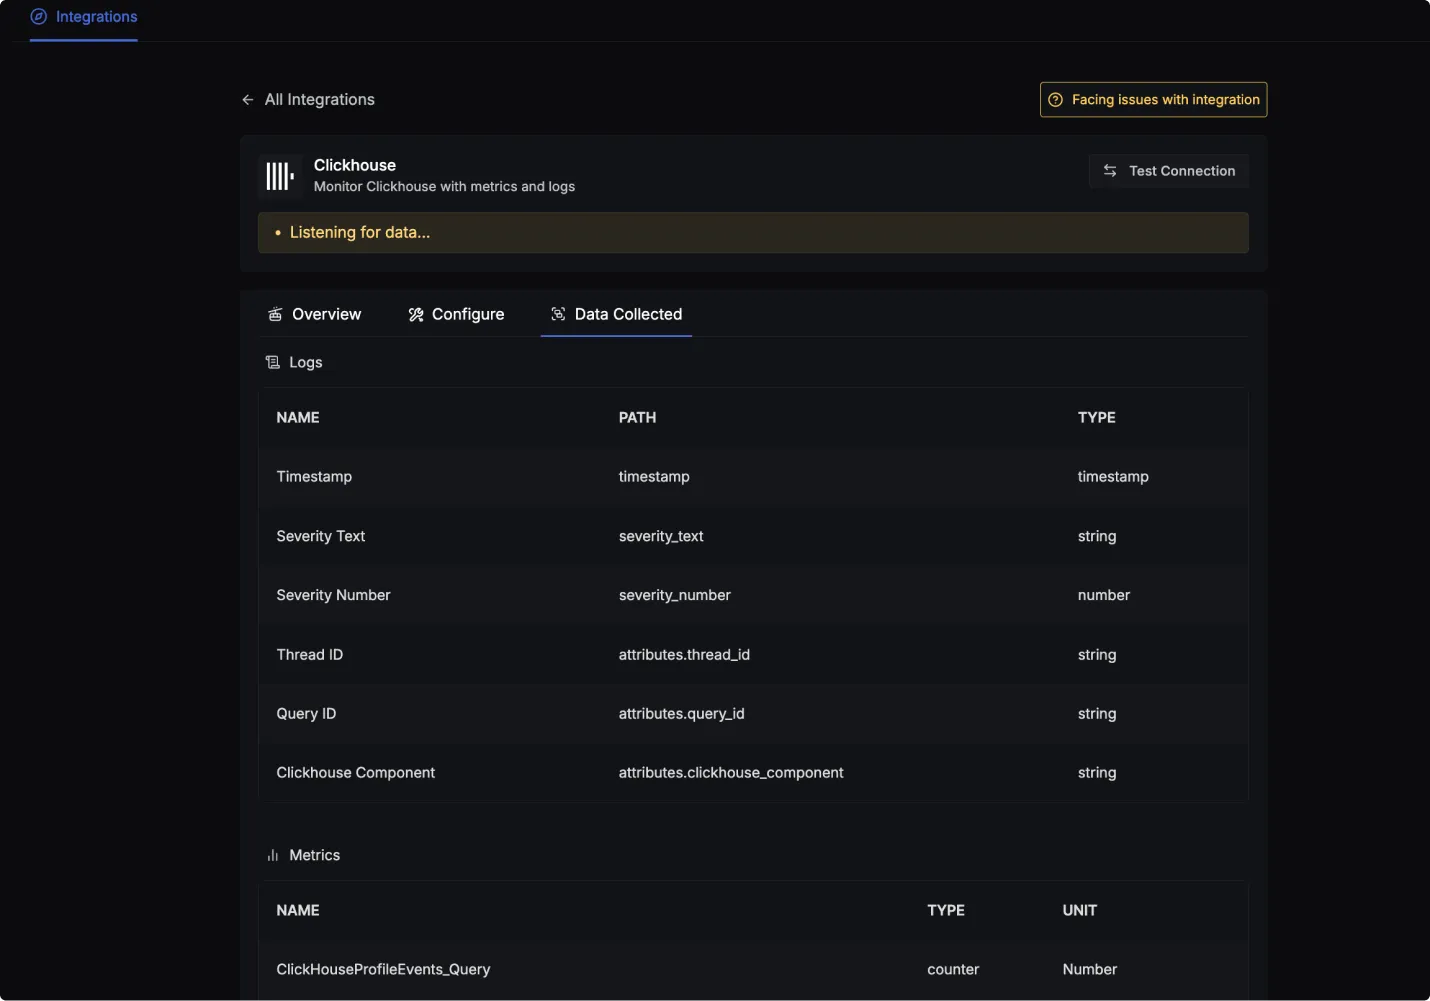
Clickhouse log attributes
- Name: The name of the log attribute.
- Path: The specific location or attribute within a log entry where the corresponding data can be found.
- Type: The data type of the log attribute.
| Name | Path | Type |
|---|---|---|
| Timestamp | timestamp | timestamp |
| Severity Text | severity_text | string |
| Severity Number | severity_number | number |
| Thread ID | attributes.thread_id | string |
| Query ID | attributes.query_id | string |
| Clickhouse Component | attributes.clickhouse_component | string |
Clickhouse metrics
- Name: The name of the metric.
- Type: The type of the metric (e.g., Sum, Gauge).
- Unit: The unit of measurement for the metric.
- Description: A brief description of what the metric represents.
To find a complete list of metrics you can checkout this link or the Data Collected tab.
