Fly.io is an app hosting platform that lets you run full-stack apps close to your users. SigNoz supports two signals from Fly.io:
- Logs — forwarded via fly-log-shipper, a Vector-based log draining app. SigNoz is a named provider in fly-log-shipper.
- Metrics — scraped from Fly's Prometheus federation endpoint using the OpenTelemetry Collector. See the full Fly.io Metrics guide.
If using self-hosted SigNoz, most steps are identical. To adapt this guide, update the endpoint and remove the ingestion key header as shown in Cloud → Self-Hosted.
Prerequisites
- A
SigNoz Cloud(or self-hosted) workspace Fly CLIinstalled and a Fly.io account
Forward Logs
Fly.io logs are forwarded to SigNoz using fly-log-shipper — a Fly app that runs Vector and drains logs from your entire Fly.io organisation.
Step 1: Clone fly-log-shipper
git clone https://github.com/superfly/fly-log-shipper.git
cd fly-log-shipper
Step 2: Create the shipper app (without deploying yet)
fly launch --no-deploy
This creates a new Fly app in your organisation without starting it.
Step 3: Create a read-only access token
fly tokens create readonly personal
Save the token value — you will set it as a secret in the next step.
Step 4: Set the required secrets
fly secrets set \
  ACCESS_TOKEN="<your-readonly-fly-token>" \
  SIGNOZ_INGESTION_KEY="<your-signoz-ingestion-key>" \
  SIGNOZ_INGESTION_URL="https://ingest.<region>.signoz.cloud:443"
Replace:
<your-readonly-fly-token>— the token from Step 3<your-signoz-ingestion-key>— your SigNoz ingestion key<region>— your SigNoz Cloud region (e.g.us,eu). See regions.
Step 5: Deploy
fly deploy
Once deployed, fly-log-shipper begins draining logs from all apps in the organisation and forwarding them to SigNoz.
Step 6: Verify logs in SigNoz
Open Logs Explorer in SigNoz. Within a minute you should see log entries with Fly.io-specific attributes such as app, region, and instance_id.
Troubleshooting
- fly-log-shipper not running — run
fly statusinside thefly-log-shipperdirectory and confirm the app is in arunningstate. - Wrong secrets — re-check
ACCESS_TOKEN,SIGNOZ_INGESTION_KEY, andSIGNOZ_INGESTION_URLwithfly secrets list. Update them withfly secrets setand redeploy. - Token scope — ensure the token was created with
fly tokens create readonly personal, not a deploy token.
Collect Metrics
Fly.io exposes application and infrastructure metrics via a Prometheus federation endpoint. The OpenTelemetry Collector scrapes this endpoint and forwards metrics to SigNoz. For the full reference, see Fly.io Metrics.
Step 1: Create an org metrics token
Generate a token at the org scope:
fly tokens create org --org <your-org-slug>
This prints a value beginning with FlyV1 .... Save only the raw part after FlyV1 to a file (do not include the prefix):
# Save the raw token (without the "FlyV1 " prefix)
echo '<RAW_TOKEN_AFTER_FlyV1>' > fly_federate_token
Step 2: Configure the OpenTelemetry Collector
Follow instructions here to install OpenTelemetry Binary as an agent
Update config.yaml in the otelcol-contrib folder with the following:
receivers:
  prometheus:
    config:
      scrape_configs:
        - job_name: fly-federate
          scheme: https
          metrics_path: /prometheus/<your-org-slug>/federate   # e.g., /prometheus/personal/federate
          params:
            match[]: ['{__name__=~"fly_.*"}']
          static_configs:
            - targets: ["api.fly.io"]
          authorization:
            type: FlyV1
            credentials_file: /etc/otel/secret/fly_federate_token
Replace <your-org-slug> with your actual organization slug. Then add the prometheus receiver to your receivers configuration.
processors:
  transform/fly_metrics:
    error_mode: ignore
    metric_statements:
      - context: datapoint
        statements:
          - 'convert_gauge_to_sum("cumulative", true) where IsMatch(metric.name, "^fly_.*_count$") or metric.name == "fly_instance_cpu" or metric.name == "fly_instance_net_sent_bytes" or metric.name == "fly_instance_net_recv_bytes"'
Add the transform/fly_metrics processor to your processors configuration.
exporters:
  otlphttp:
    endpoint: "https://ingest.{region}.signoz.cloud:443"
    headers:
      signoz-access-token: <YOUR_SIGNOZ_API_KEY>
Replace {region} with your SigNoz Cloud region and <YOUR_SIGNOZ_API_KEY> with your Ingestion Key.
service:
  telemetry:
    logs:
      level: debug
  pipelines:
    metrics:
      receivers: [prometheus]
      processors: [transform/fly_metrics, batch]
      exporters: [otlphttp]
Step 3: Run the Collector
./otelcol-contrib --config ./config.yaml
Install the OpenTelemetry Collector for Docker.
Update otel.yaml with the following:
receivers:
  prometheus:
    config:
      scrape_configs:
        - job_name: fly-federate
          scheme: https
          metrics_path: /prometheus/<your-org-slug>/federate
          params:
            match[]: ['{__name__=~"fly_.*"}']
          static_configs:
            - targets: ["api.fly.io"]
          authorization:
            type: FlyV1
            credentials_file: /etc/otel/secret/fly_federate_token
Replace <your-org-slug> with your actual organization slug.
processors:
  transform/fly_metrics:
    error_mode: ignore
    metric_statements:
      - context: datapoint
        statements:
          - 'convert_gauge_to_sum("cumulative", true) where IsMatch(metric.name, "^fly_.*_count$") or metric.name == "fly_instance_cpu" or metric.name == "fly_instance_net_sent_bytes" or metric.name == "fly_instance_net_recv_bytes"'
exporters:
  otlphttp:
    endpoint: "https://ingest.{region}.signoz.cloud:443"
    headers:
      signoz-access-token: <YOUR_SIGNOZ_API_KEY>
Replace {region} with your SigNoz Cloud region and <YOUR_SIGNOZ_API_KEY> with your Ingestion Key.
service:
  telemetry:
    logs:
      level: debug
  pipelines:
    metrics:
      receivers: [prometheus]
      processors: [transform/fly_metrics, batch]
      exporters: [otlphttp]
Step 3: Run the Collector
docker run --rm -it \
  -v "$(pwd)/otel.yaml:/etc/otel/config.yaml" \
  -v "$(pwd)/fly_federate_token:/etc/otel/secret/fly_federate_token:ro" \
  otel/opentelemetry-collector-contrib:0.103.1 \
  --config /etc/otel/config.yaml
Install the SigNoz K8s Infra chart.
Create the namespace (if needed):
kubectl create namespace signoz
Create the secret for the Fly token:
kubectl create secret generic fly-federate-token \
  --from-file=fly_federate_token=./fly_federate_token \
  -n signoz
Update override-values.yaml:
global:
  cloud: others
  clusterName: <CLUSTER_NAME>
  deploymentEnvironment: <DEPLOYMENT_ENVIRONMENT>
otelCollectorEndpoint: ingest.{region}.signoz.cloud:443
otelInsecure: false
signozApiKey: <your-ingestion-key>

otelAgent:
  image:
    repository: otel/opentelemetry-collector-contrib
    tag: 0.103.1
  config:
    receivers:
      prometheus:
        config:
          scrape_configs:
            - job_name: fly-federate
              scheme: https
              metrics_path: /prometheus/<your-org-slug>/federate
              params:
                match[]: ['{__name__=~"fly_.*"}']
              static_configs:
                - targets: ["api.fly.io"]
              authorization:
                type: FlyV1
                credentials_file: /etc/otel/secret/fly_federate_token
    processors:
      transform/fly_metrics:
        error_mode: ignore
        metric_statements:
          - context: datapoint
            statements:
              - 'convert_gauge_to_sum("cumulative", true) where IsMatch(metric.name, "^fly_.*_count$") or metric.name == "fly_instance_cpu" or metric.name == "fly_instance_net_sent_bytes" or metric.name == "fly_instance_net_recv_bytes"'
    exporters:
      otlphttp:
        endpoint: https://ingest.{region}.signoz.cloud:443
        headers:
          signoz-access-token: <your-ingestion-key>
    service:
      pipelines:
        metrics:
          receivers: [prometheus]
          processors: [transform/fly_metrics, batch]
          exporters: [otlphttp]
  extraVolumes:
    - name: fly-token
      secret:
        secretName: fly-federate-token
  extraVolumeMounts:
    - name: fly-token
      mountPath: /etc/otel/secret/fly_federate_token
      subPath: fly_federate_token
      readOnly: true
Step 3: Deploy the chart
helm install my-release signoz/k8s-infra -f override-values.yaml
Fly's /federate endpoint doesn't expose metric types, so all metrics are mapped as Gauge by default. The transform/fly_metrics processor converts the relevant metrics to Sum (counter) type. Add any additional metric names to the processor statements as needed.
Verify the federation endpoint
Generate some traffic and confirm metrics are returned:
curl -sS -i -G \
  -H "Authorization: FlyV1 $(cat fly_federate_token)" \
  --data-urlencode 'match[]={__name__=~"fly_.*"}' \
  https://api.fly.io/prometheus/<your-org-slug>/federate | head -n 40
You should see lines like fly_instance_cpu_user_seconds_total, fly_instance_memory_resident, etc.
Troubleshooting
- Wrong org slug — confirm
<your-org-slug>inmetrics_pathmatches the output offly orgs list. - Token format — the token file must contain only the raw value after
FlyV1(no prefix, no trailing newline). - Gauge vs counter — Fly's federation endpoint does not expose metric types; all metrics default to Gauge. Use the
transform/fly_metricsprocessor to convert counters. See Fly.io Metrics for details.
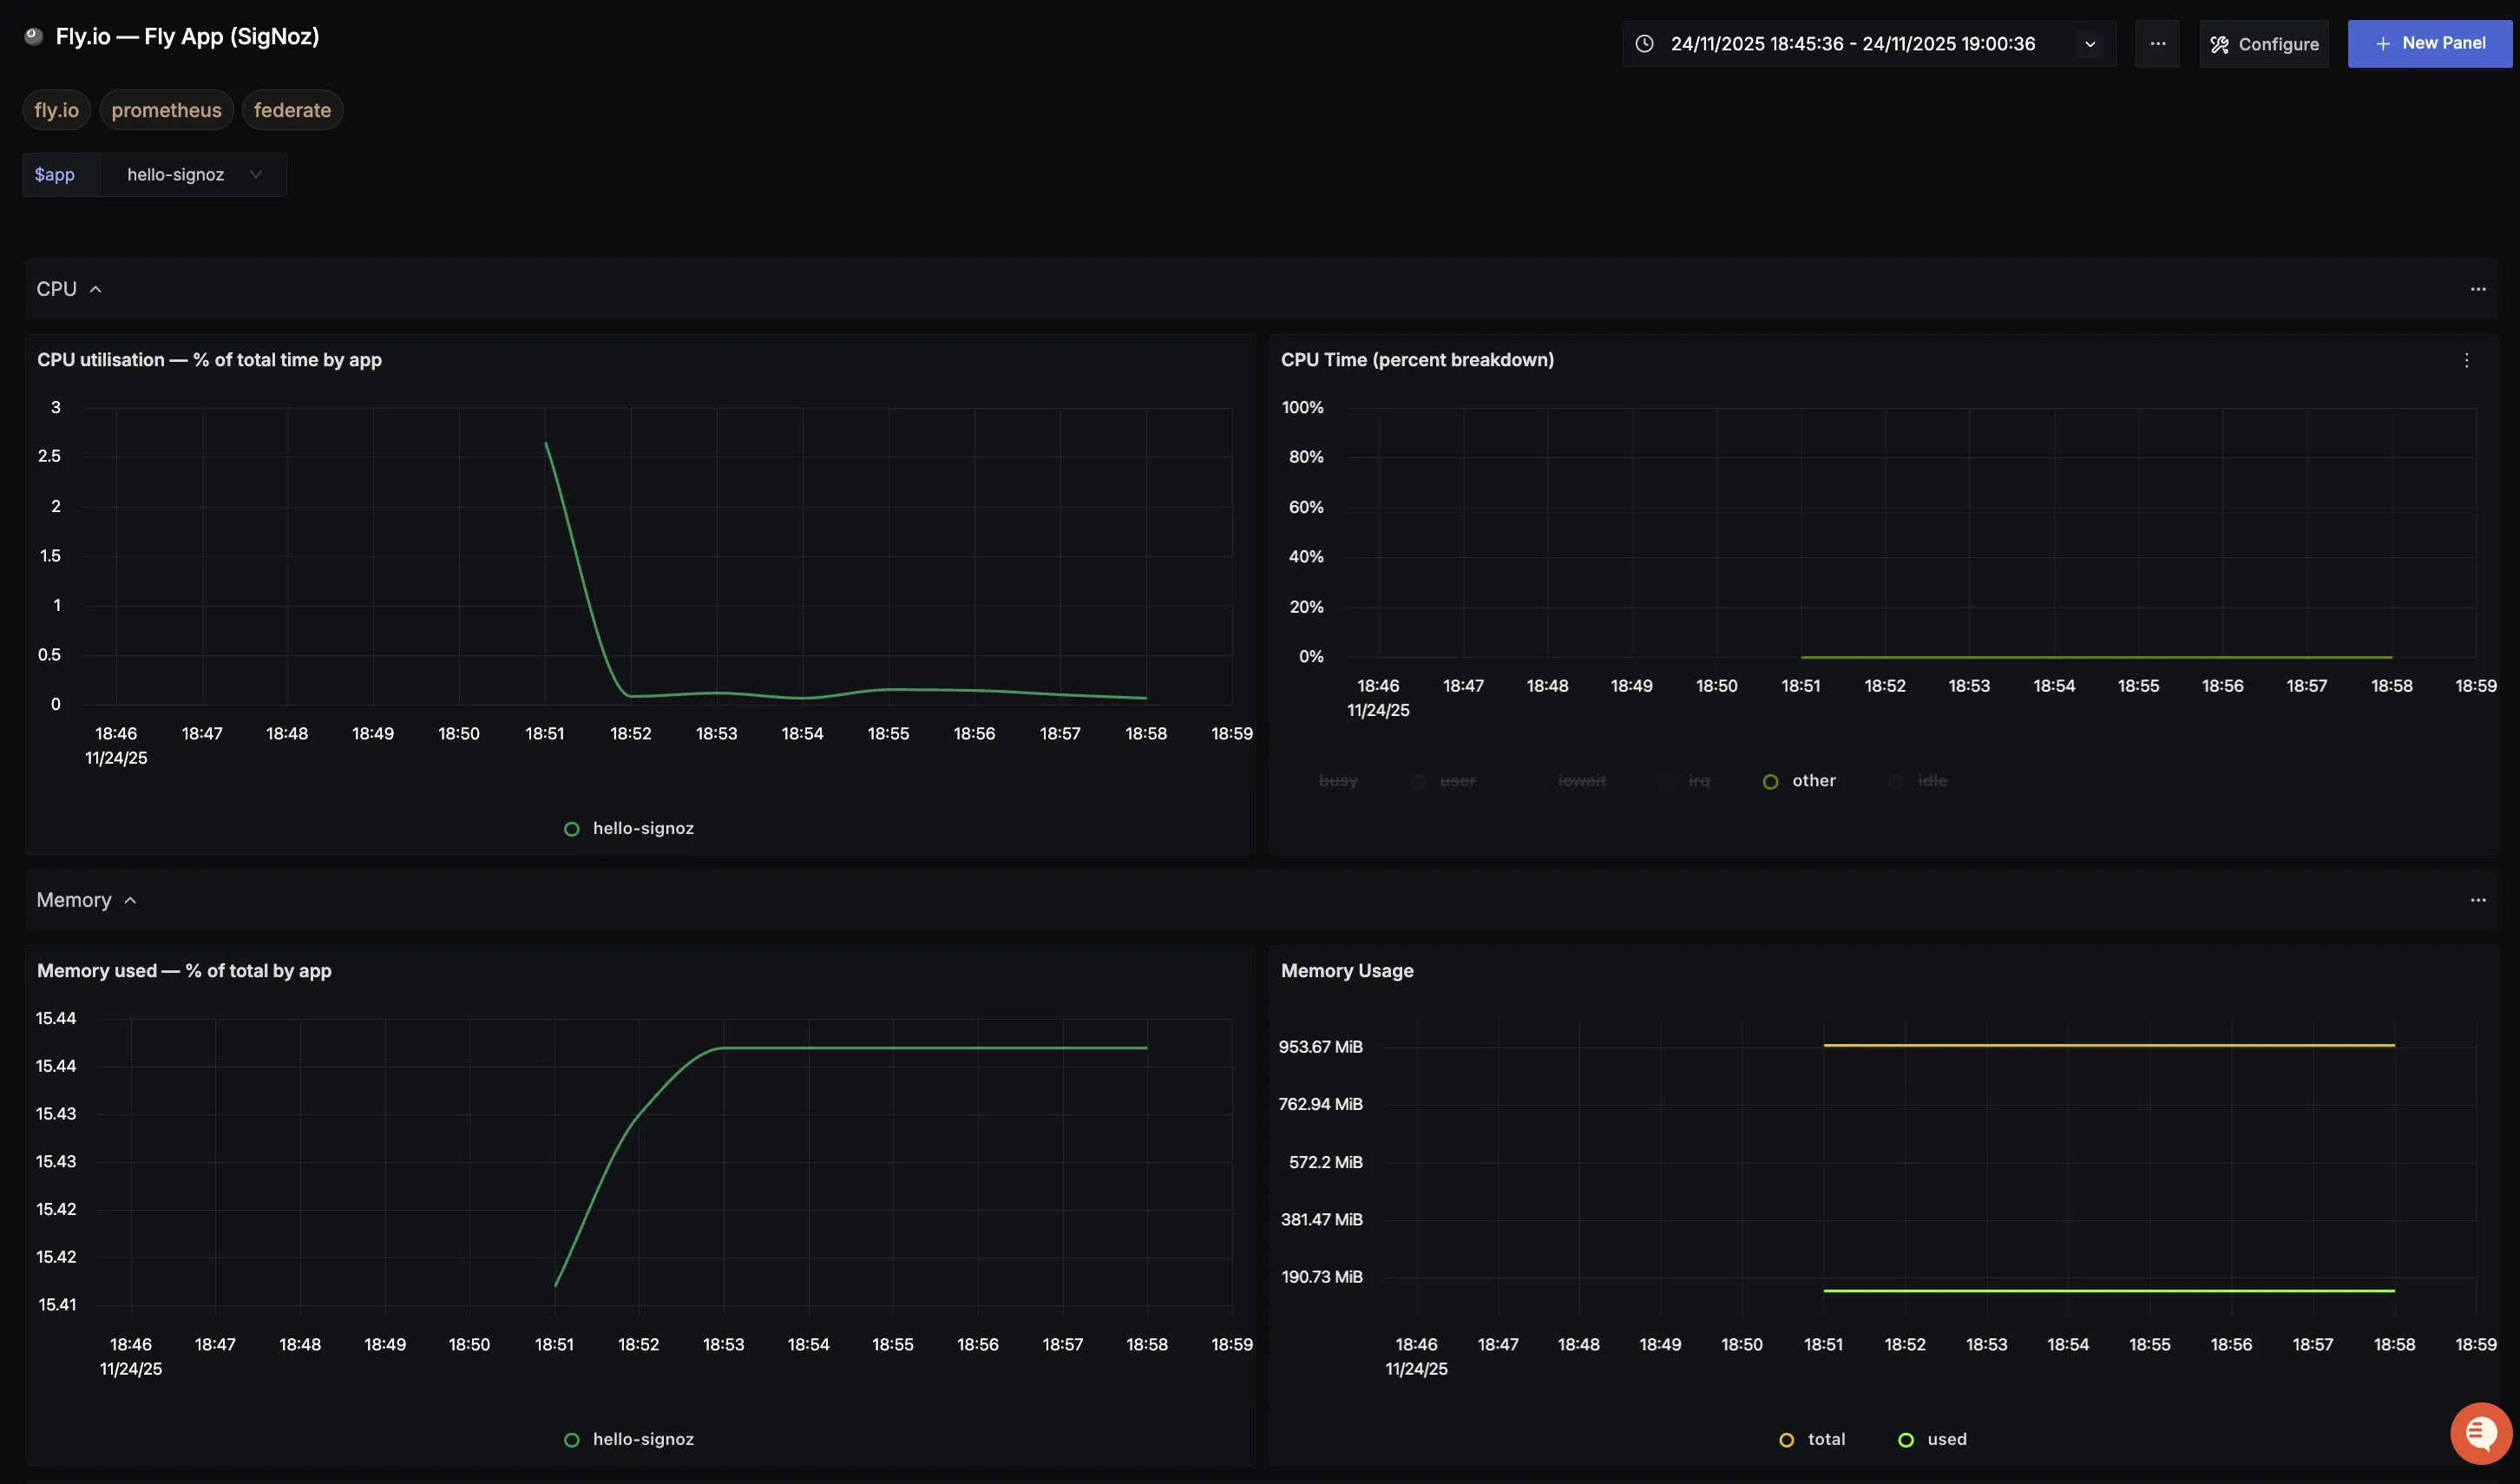
Pre-built Dashboard
A pre-built Fly.io Prometheus dashboard is available to import directly into SigNoz:
Dashboards → + New dashboard → Import JSON
Next Steps
- Set up metric-based alerts on Fly.io app metrics.
- Set up log-based alerts to get notified on error patterns in Fly.io logs.
- Create a dashboard to combine Fly.io metrics and logs in a single view.
Get Help
If you need help with the steps in this topic, please reach out to us on SigNoz Community Slack. If you are a SigNoz Cloud user, please use in product chat support located at the bottom right corner of your SigNoz instance or contact us at cloud-support@signoz.io.
