Overview
This integration helps you to monitor key Redis metrics and logs, view them with an out-of-the-box dashboard, and parse Redis logs for better querying and aggregation.
Prerequisites
Before you begin, ensure you have:
- A Redis server running version 3.0 or newer
- An OpenTelemetry (OTEL) Collector with access to the Redis server
- Install the OTEL Collector(v0.88.0 or newer) if not done already
- Ensure you can provide config files and set environment variables for the collector
- Ensure the OTEL collector has access to the Redis server for metrics collection and can read the Redis log file for logs collection
Collecting Redis Metrics
Step 1: Create the Collector Config File
Create a file named redis-metrics-collection-config.yaml with the following content:
receivers:
  redis:
    # The hostname and port of the Redis instance, separated by a colon.
    endpoint: ${env:REDIS_ENDPOINT}
    # The frequency at which to collect metrics from the Redis instance.
    collection_interval: 60s
    # # The password used to access the Redis instance; must match the password specified in the requirepass server configuration option.
    password: ${env:REDIS_PASSWORD}
    # # Defines the network to use for connecting to the server. Valid Values are `tcp` or `Unix`
    # transport: tcp
    # tls:
    #   insecure: false
    #   ca_file: /etc/ssl/certs/ca-certificates.crt
    #   cert_file: /etc/ssl/certs/redis.crt
    #   key_file: /etc/ssl/certs/redis.key
    metrics:
      redis.maxmemory:
        enabled: true
      redis.cmd.latency:
        enabled: true

processors:
  # enriches the data with additional host information
  # see https://github.com/open-telemetry/opentelemetry-collector-contrib/tree/main/processor/resourcedetectionprocessor#resource-detection-processor
  resourcedetection/system:
    # add additional detectors if needed
    detectors: ["system"]
    system:
      hostname_sources: ["os"]

exporters:
  # export to SigNoz cloud
  otlp/redis:
    endpoint: "${env:OTLP_DESTINATION_ENDPOINT}"
    tls:
      insecure: false
    headers:
      "signoz-ingestion-key": "${env:SIGNOZ_INGESTION_KEY}"

  # export to local collector
  # otlp/redis:
  #   endpoint: "localhost:4317"
  #   tls:
  #     insecure: true

service:
  pipelines:
    metrics/redis:
      receivers: [redis]
      # note: remove this processor if the collector host is not running on the same host as the redis instance
      processors: [resourcedetection/system]
      exporters: [otlp/redis]
Step 2: Set Environment Variables
Set the following environment variables:
# redis endpoint reachable from the otel collector"
export REDIS_ENDPOINT="localhost:6379"

# password used to access the Redis instance.
# must match the password specified in the requirepass server configuration option.
# can be left empty if the redis server is not configured to require a password.
export REDIS_PASSWORD=""

# region specific SigNoz cloud ingestion endpoint
export OTLP_DESTINATION_ENDPOINT="ingest.<region>.signoz.cloud:443"

# your SigNoz ingestion key
export SIGNOZ_INGESTION_KEY="signoz-ingestion-key"
You can find more details about ingestion keys and Regions here
Step 3: Use the Collector Config File
Add the following flag to your collector run command:
--config redis-metrics-collection-config.yaml
Note: The collector can use multiple config files by specifying multiple --config flags.
Collecting Redis Logs
Step 1: Create the Collector Config File
Create a file named redis-logs-collection-config.yaml with the following content:
receivers:
  filelog/redis:
    include: ["${env:REDIS_LOG_FILE}"]
    operators:
      # Parse default redis log format
      # pid:role timestamp log_level message
      - type: regex_parser
        if: body matches '^(?P<pid>\\d+):(?P<role>\\w+) (?P<ts>\\d{2} \\w+ \\d{4} \\d{2}:\\d{2}:\\d{2}\\.\\d+) (?P<log_level>[.\\-*#]) (?P<message>.*)$'
        parse_from: body
        regex: '^(?P<pid>\d+):(?P<role>\w+) (?P<ts>\d{2} \w+ \d{4} \d{2}:\d{2}:\d{2}\.\d+) (?P<log_level>[.\-*#]) (?P<message>.*)$'
        timestamp:
          parse_from: attributes.ts
          layout: '02 Jan 2006 15:04:05.000'
          layout_type: gotime
        severity:
          parse_from: attributes.log_level
          overwrite_text: true
          mapping:
            debug: '.'
            info:
              - '-'
              - '*'
            warn: '#'
        on_error: send
      - type: move
        if: attributes.message != nil
        from: attributes.message
        to: body
      - type: remove
        if: attributes.log_level != nil
        field: attributes.log_level
      - type: remove
        if: attributes.ts != nil
        field: attributes.ts
      - type: add
        field: attributes.source
        value: redis

processors:
  batch:
    send_batch_size: 10000
    send_batch_max_size: 11000
    timeout: 10s

exporters:
  # export to SigNoz cloud
  otlp/redis-logs:
    endpoint: "${env:OTLP_DESTINATION_ENDPOINT}"
    tls:
      insecure: false
    headers:
      "signoz-ingestion-key": "${env:SIGNOZ_INGESTION_KEY}"

  # export to local collector
  # otlp/redis-logs:
  #   endpoint: "localhost:4317"
  #   tls:
  #     insecure: true


service:
  pipelines:
    logs/redis:
      receivers: [filelog/redis]
      processors: [batch]
      exporters: [otlp/redis-logs]
Step 2: Set Environment Variables
Set the following environment variables:
# path of Redis server log file. must be accessible by the otel collector
# typically found in /usr/local/var/log/redis on macOS
# log file location can also be found in the output of `redis-cli CONFIG GET : *`
export REDIS_LOG_FILE=/var/log/redis/redis-server.log

# region specific SigNoz cloud ingestion endpoint
export OTLP_DESTINATION_ENDPOINT="ingest.<region>.signoz.cloud:443"

# your SigNoz ingestion key
export SIGNOZ_INGESTION_KEY="signoz-ingestion-key"
You can find more details about ingestion keys and Regions here
Step 3: Use the Collector Config File
Add the following flag to your collector run command:
--config redis-logs-collection-config.yaml
Note: The collector can use multiple config files by specifying multiple --config flags in the collector run command.
Connect Redis
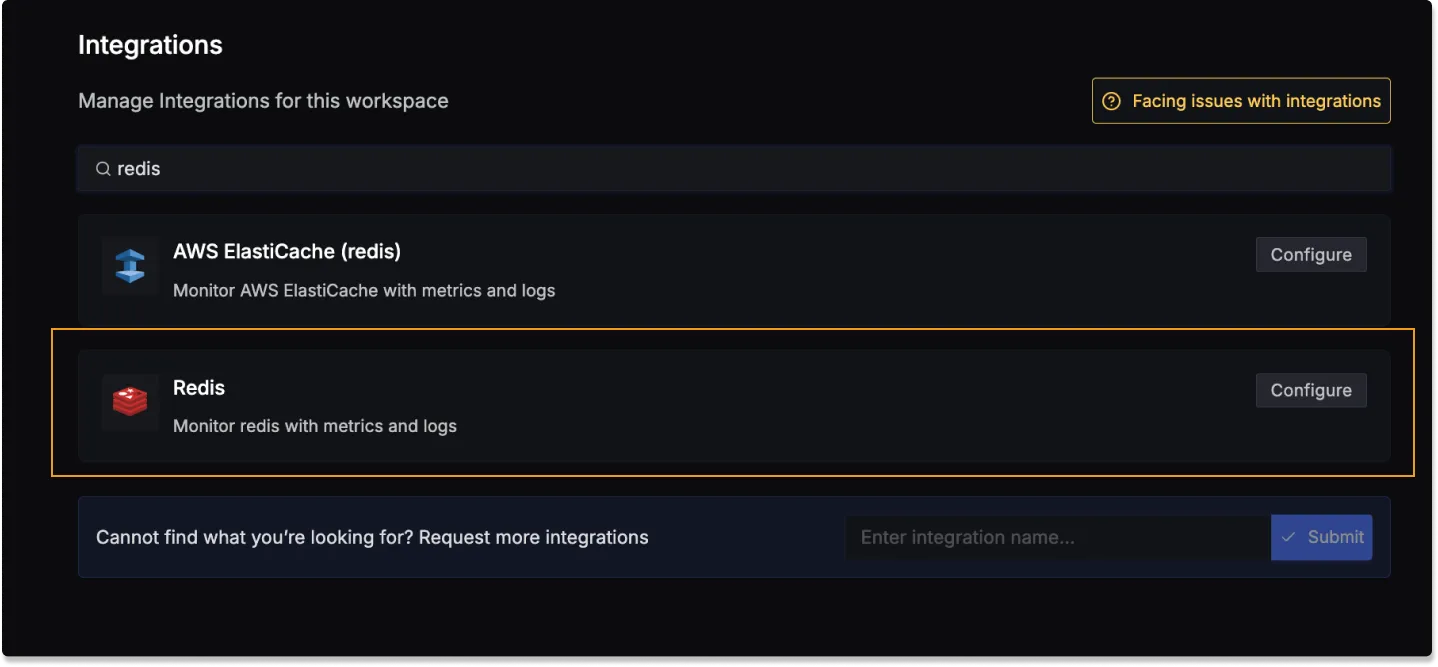
Once you're done with setting up Redis for collecting metrics and logs, head over to the intergrations tab in SigNoz and search for the Redis integration.
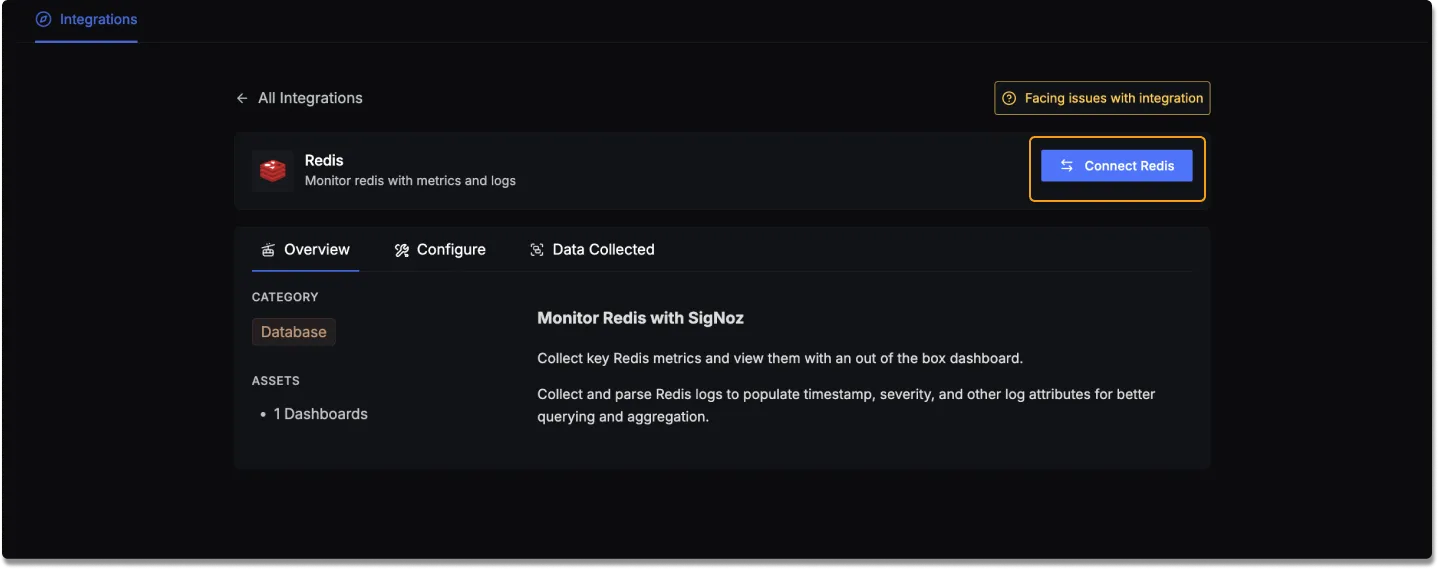
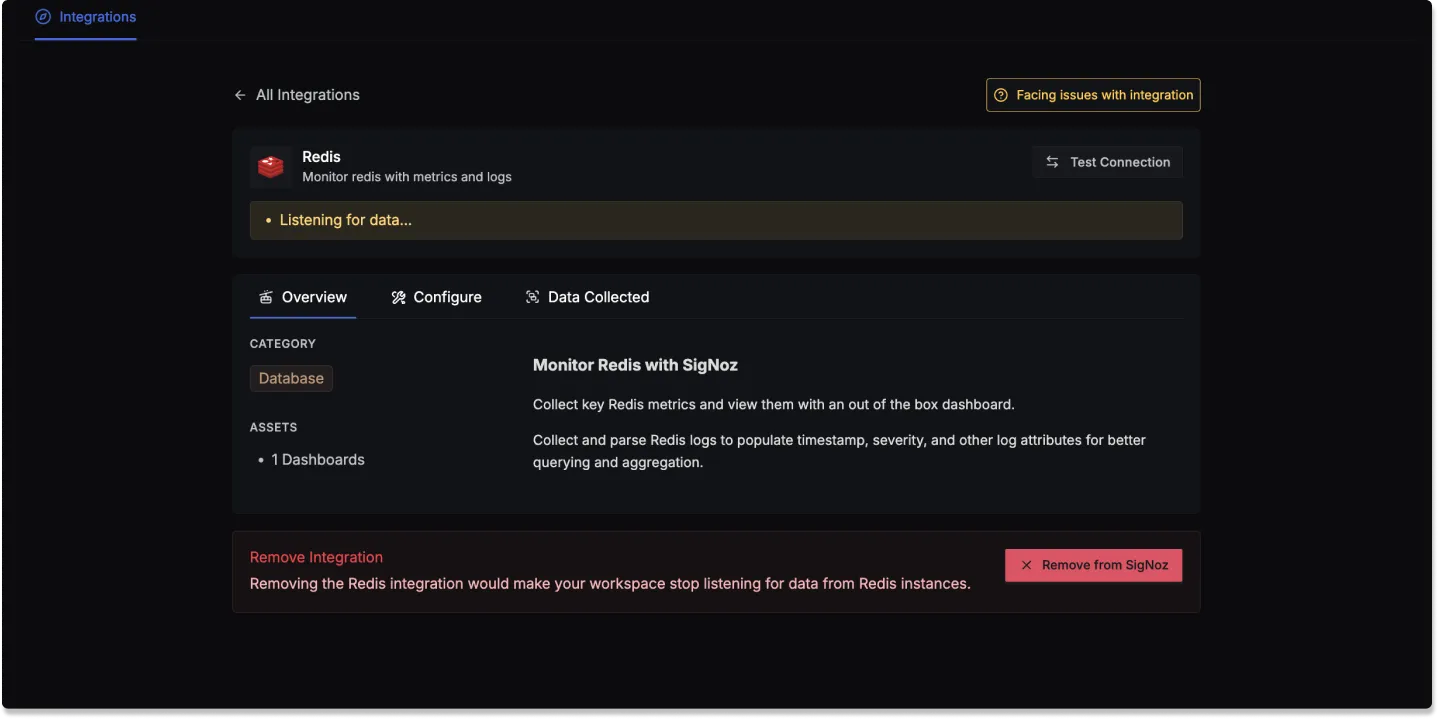
Click on the Connect Redis Button, and select I have already configured, this will start listening for data from your Redis instance.
To stop this, you can select the Remove from SigNoz button.
Redis dashboard
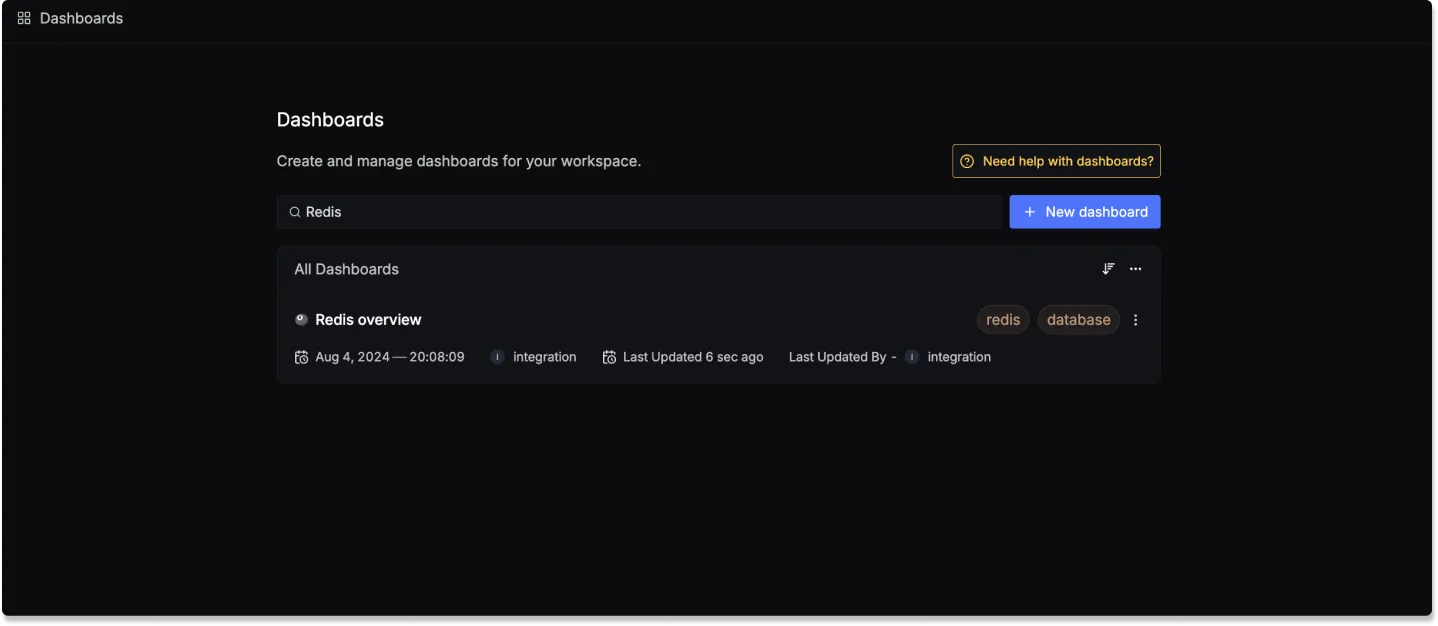
Once SigNoz has started listening to your Redis data, head over to the Dashboards tab and search for Redis, this will show you a newly created dashboard which shows different Redis metrics.
Dashboard asset
You can also manually create the above Redis Dashboard by importing the JSON file available here. To learn how to create Dashboards, checkout this documentation.
Data Collected
When you switch to the Data Collected tab of your Redis Integrations, it shows you details about the different logs attributes and the metrics types that you can monitor for your Redis instance. The tables below gives you a list of the different logs attributes and metrics available.
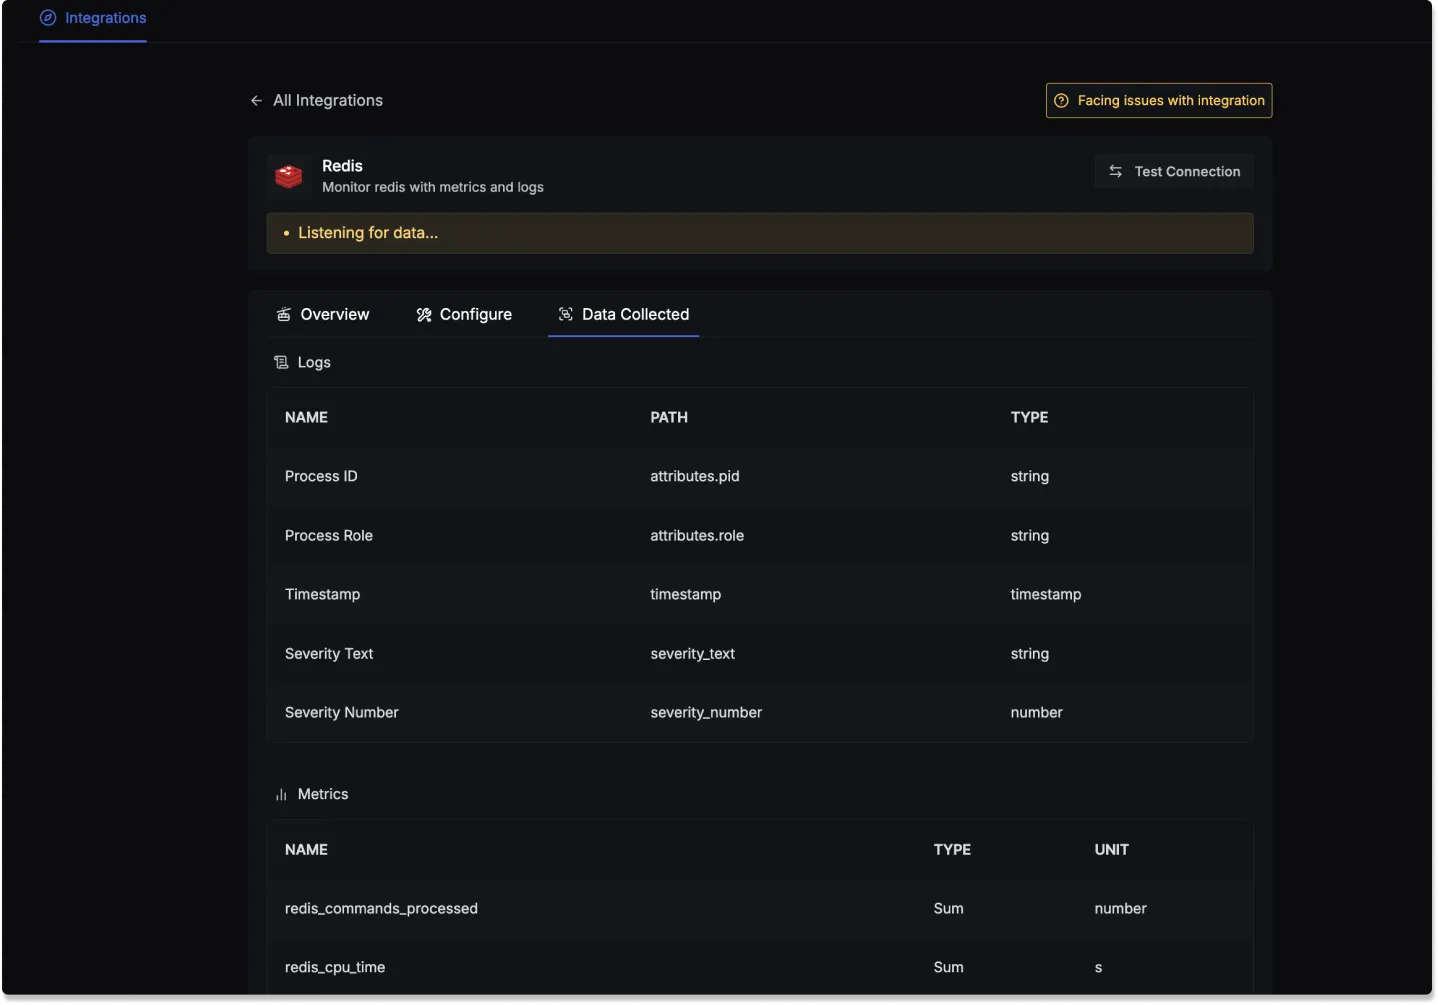
Redis log attributes
- Name: The name of the log attribute.
- Path: The specific location or attribute within a log entry where the corresponding data can be found.
- Type: The data type of the log attribute.
| Name | Path | Type |
|---|---|---|
| Process ID | attributes.pid | string |
| Process Role | attributes.role | string |
| Timestamp | timestamp | timestamp |
| Severity Text | severity_text | string |
| Severity Number | severity_number | number |
Redis metrics
- Name: The name of the metric.
- Type: The type of the metric (e.g., Sum, Gauge).
- Unit: The unit of measurement for the metric.
- Description: A brief description of what the metric represents.
| Name | Type | Unit | Description |
|---|---|---|---|
| redis_commands_processed | Sum | number | Total number of commands processed by the server |
| redis_cpu_time | Sum | seconds | System CPU consumed by the Redis server in seconds since server start |
| redis_keys_expired | Sum | number | Total number of key expiration events |
| redis_db_expires | Gauge | number | Number of keyspace keys with an expiration |
| redis_commands | Gauge | ops/s | Number of commands processed per second |
| redis_replication_offset | Gauge | Bytes | The server's current replication offset |
| redis_net_input | Sum | Bytes | The total number of bytes read from the network |
| redis_clients_connected | Sum | number | Number of client connections (excluding connections from replicas) |
| redis_keys_evicted | Sum | number | Number of evicted keys due to maxmemory limit |
| redis_maxmemory | Gauge | Bytes | The value of the maxmemory configuration directive |
| redis_clients_max_input_buffer | Gauge | Bytes | Biggest input buffer among current client connections |
| redis_cmd_latency | Gauge | seconds | Command execution latency |
| redis_memory_lua | Gauge | Bytes | Number of bytes used by the Lua engine |
| redis_replication_backlog_first_byte_offset | Gauge | Bytes | The master offset of the replication backlog buffer |
| redis_keyspace_hits | Sum | number | Number of successful lookup of keys in the main dictionary |
| redis_clients_blocked | Sum | number | Number of clients pending on a blocking call |
| redis_connections_rejected | Sum | number | Number of connections rejected because of maxclients limit |
| redis_latest_fork | Gauge | microseconds | Duration of the latest fork operation in microseconds |
| redis_clients_max_output_buffer | Gauge | Bytes | Longest output list among current client connections |
| redis_slaves_connected | Sum | number | Number of connected replicas |
| redis_db_keys | Gauge | number | Number of keyspace keys |
| redis_keyspace_misses | Sum | number | Number of failed lookup of keys in the main dictionary |
| redis_uptime | Sum | seconds | Number of seconds since Redis server start |
| redis_memory_used | Gauge | Bytes | Total number of bytes allocated by Redis using its allocator |
| redis_net_output | Sum | Bytes | The total number of bytes written to the network |
| redis_connections_received | Sum | number | Total number of connections accepted by the server |
| redis_rdb_changes_since_last_save | Sum | number | Number of changes since the last dump |
| redis_memory_rss | Gauge | Bytes | Number of bytes that Redis allocated as seen by the operating system |
| redis_db_avg_ttl | Gauge | milliseconds | Average keyspace keys TTL |
| redis_memory_peak | Gauge | Bytes | Peak memory consumed by Redis (in bytes) |
| redis_memory_fragmentation_ratio | Gauge | number | Ratio between used_memory_rss and used_memory |
