We have published a helloworld Temporal application instrumented with OpenTelemetry in the temporal-golang-opentelemetry sample repository. The README.md in the repository explains how to run the application.
You should open the repo and browse the code and files as we go through the doc step by step.
Step 1: Add interceptors to client.Options
Refer to helloworld/connection.go in the sample project for a complete example of the configuration. Client applications and workers connect to the temporal service via client.Dial function which takes in client options as input. Here is the config that we use to connect to the temporal service
options := client.Options{
    HostPort:       hostPort,
    Namespace:      namespace,
    Interceptors:   []interceptor.ClientInterceptor{tracingInterceptor},
    MetricsHandler: metricsHandler,
    Logger:         logger,
}
For this to work we need to define tracingInterceptor, metricsHandler and logger. In the next steps, we will see how to properly set these up.
Step 2: Add code to create tracingInterceptor, metricsHandler and logger
Shortcut: Import or copy-paste the content from the instrument directory in the sample repository.
You might need to fix lint errors depending on golang version, temporal sdk version and otel-sdk version. Do reach out to us if you are not able to resolve those errors
Explanation of files added
metrics_handler.go We are just implementing metrics.Handler interface from temporal sdk using opentelemetry
opentelemetry_setup.go This initiates the otel metric provider and trace provider and returns them in response of
InitializeGlobalTelemetryProviderfunction calltracing_interceptor.go This file contains extended internal implementation of temporal sdks on how they intercept events and add spans, attributes, events, etc. This was needed as temporal's golang sdk does not support adding attributes like
workflowType,activityType,namespace, etc which according to us is crucial for slicing and dicing of temporal tracing data. If you don't need these attribtues, you do not need to import this file and you can skip.zerolog_adapter.go
// ZerologAdapter wraps zerolog to implement Temporal's log.Logger interface.
type ZerologAdapter struct {
	logger zerolog.Logger
}
As mentioned in the comment of the struct, ZerologAdapter wraps zerolog to implement Temporal's log.Logger interface. If you use any other logger, you should probably do the same for that logger too.
Step 3: Changes in temporal worker and client code
You can compare your changes against worker/main.go and starter/main.go in the sample repository.
Add the below code to the start of your worker and client code
	ctx := context.Background()

	// Create a new Zerolog adapter.
	logger := instrument.NewZerologAdapter()

	tp, mp, err := instrument.InitializeGlobalTelemetryProvider(ctx)
	if err != nil {
		logger.Error("Unable to create a global trace provider", "error", err)
	}

	defer func() {
		if err := tp.Shutdown(ctx); err != nil {
			logger.Error("Error shutting down trace provider", "error", err)
		}
		if err := mp.Shutdown(ctx); err != nil {
			logger.Error("Error shutting down meter provider", "error", err)
		}
	}()

	// Create interceptor
	tracingInterceptor, err := instrument.NewTracingInterceptor(instrument.TracerOptions{
		DisableSignalTracing: false,
		DisableQueryTracing:  false,
		DisableBaggage:       false,
	})
	if err != nil {
		logger.Error("Unable to create interceptor", "error", err)
	}

	// Create metrics handler
	metricsHandler := instrument.NewOpenTelemetryMetricsHandler()
instrument is the package where you copied the files from step 2.
After the above changes, you should be able to pass the right params at Step 1.
Explanation of the above code
Below line creates a new instance of zerolog logger which implements the temporal.logger interface
logger := instrument.NewZerologAdapter()
Below line creates an otel native traceProvider and metricProvider using the otel sdks
tp, mp, err := instrument.InitializeGlobalTelemetryProvider(ctx)
Now, create a new tracing interceptor that can be passed to the cient.Options using
instrument.NewTracingInterceptor(options)
Also, create a otel metrics handler which implements temporal metrics interface
instrument.NewOpenTelemetryMetricsHandler()
Pass tracingInterceptor, metricsHandler and logger to client.Options
Step 4: Running your temporal worker and client applications
Pass serviceName, otlp endpoint and authentication headers using native otel environment variables. You can add more resource attributes like deployment.environment as per otel conventions using envs
Worker run command:
OTEL_SERVICE_NAME='temporal-worker-<identifier>' INSECURE_MODE=true OTEL_EXPORTER_OTLP_ENDPOINT='http://localhost:4317' go run worker/main.go
A similar run command for temporal client application
OTEL_SERVICE_NAME='temporal-client-<identifier>' INSECURE_MODE=true OTEL_EXPORTER_OTLP_ENDPOINT='http://localhost:4317' go run starter/main.go
This should start sending your sdk metrics and traces to the otel-collector. This does not collect logs yet.
Zerolog is not configured to send directly to signoz cloud. In most cases, the logs are output to file and the logs are read by otel-collector and pushed to signoz cloud using
- Adding a filelog receiver at otel-collector following the filelog receiver guide
- Collecting k8s logs following the Kubernetes logs collection guide
To setup otel-collector, read:
- For VM => follow the OpenTelemetry binary usage guide for virtual machines
- For K8s => review the Kubernetes infrastructure metrics setup guide
Worker run command:
OTEL_SERVICE_NAME='temporal-worker-<identifier>' OTEL_EXPORTER_OTLP_ENDPOINT='ingest.<region>.signoz.cloud' OTEL_EXPORTER_OTLP_HEADERS="signoz-ingestion-key=<signoz-ingestion-key>" go run worker/main.go
A similar run command for temporal client application
OTEL_SERVICE_NAME='temporal-client-<identifier>' OTEL_EXPORTER_OTLP_ENDPOINT='ingest.<region>.signoz.cloud' OTEL_EXPORTER_OTLP_HEADERS="signoz-ingestion-key=<signoz-ingestion-key>" go starter/main.go
Directly sending from application to signoz cloud works by default for exporting metrics and traces. Logs are usually written to a file and needs an otel-collector with a filelog receiver to export logs to signoz cloud. If you do not write logs to file and wish to send logs directly from you applications, do reach out to us for help (chat support for saas users and slack community for OSS users)
Step 5: Build dashboards and parse logs at SigNoz
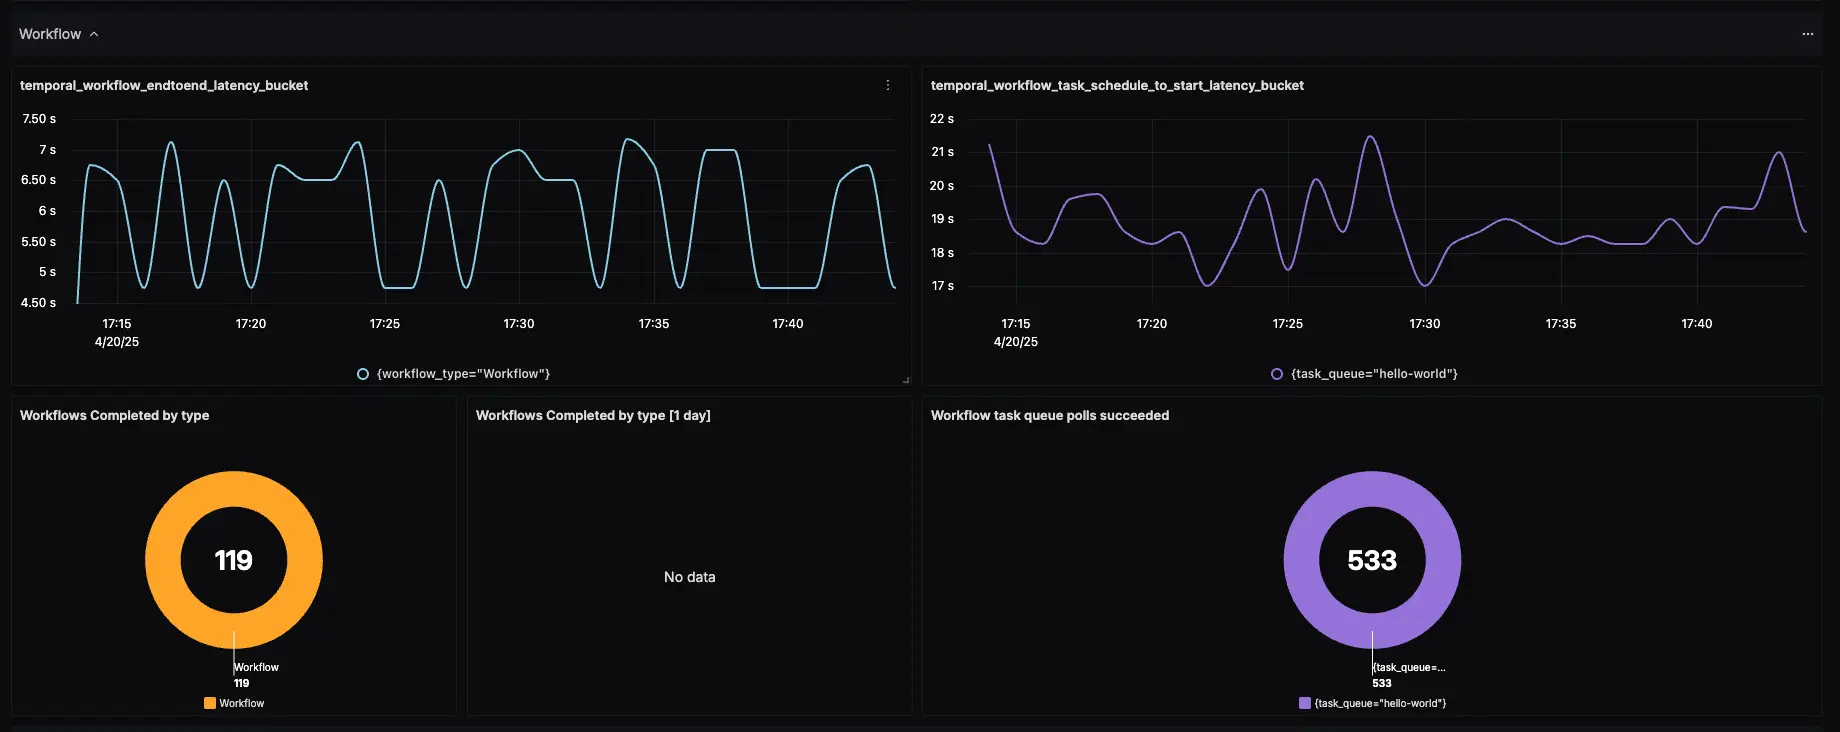
You should be able to see incoming temporal sdk metrics at Metrics Explorer page at SigNoz. Once you see them coming, go to Dashboards -> Import Dashboard. The dashboard json for sdk metrics can be found in the Temporal SDK metrics dashboard repository.
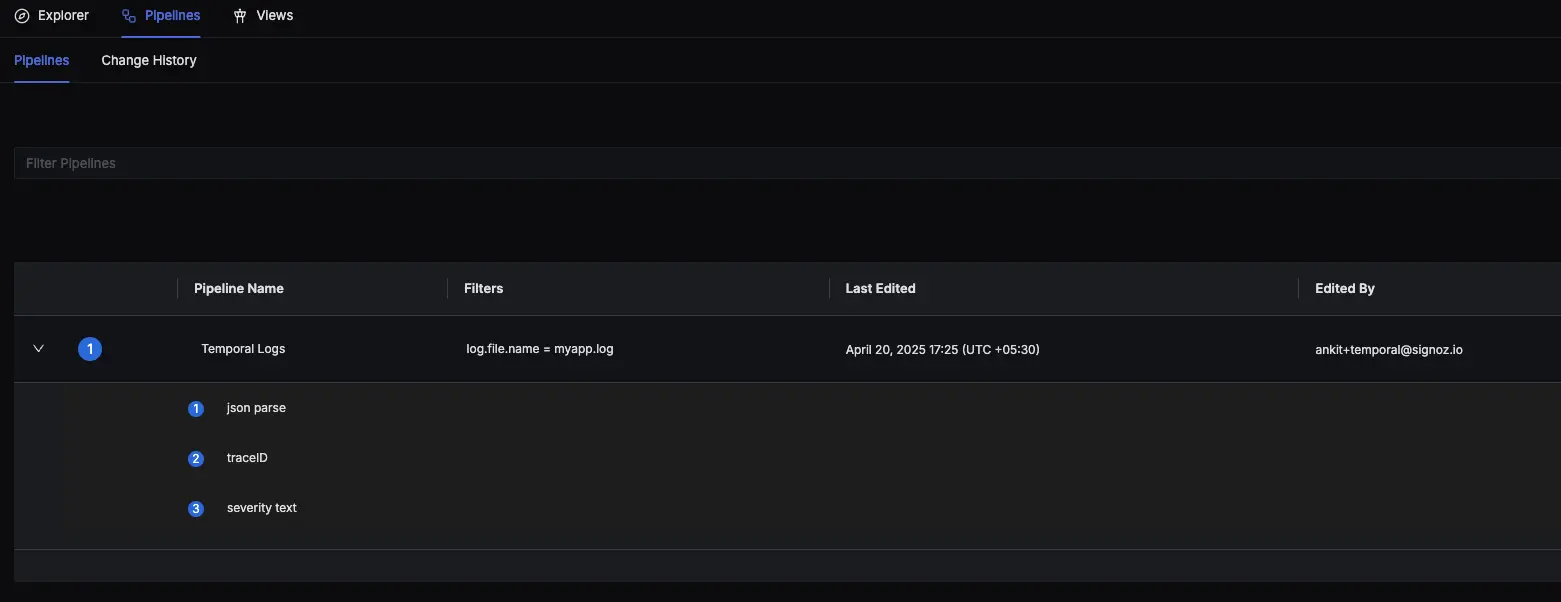
If you are successfully sending logs to SigNoz, you need to parse your logs at SigNoz using the Logs Pipeline feature.
- Use the JSON parser if your logs are JSON formatted.
- Map
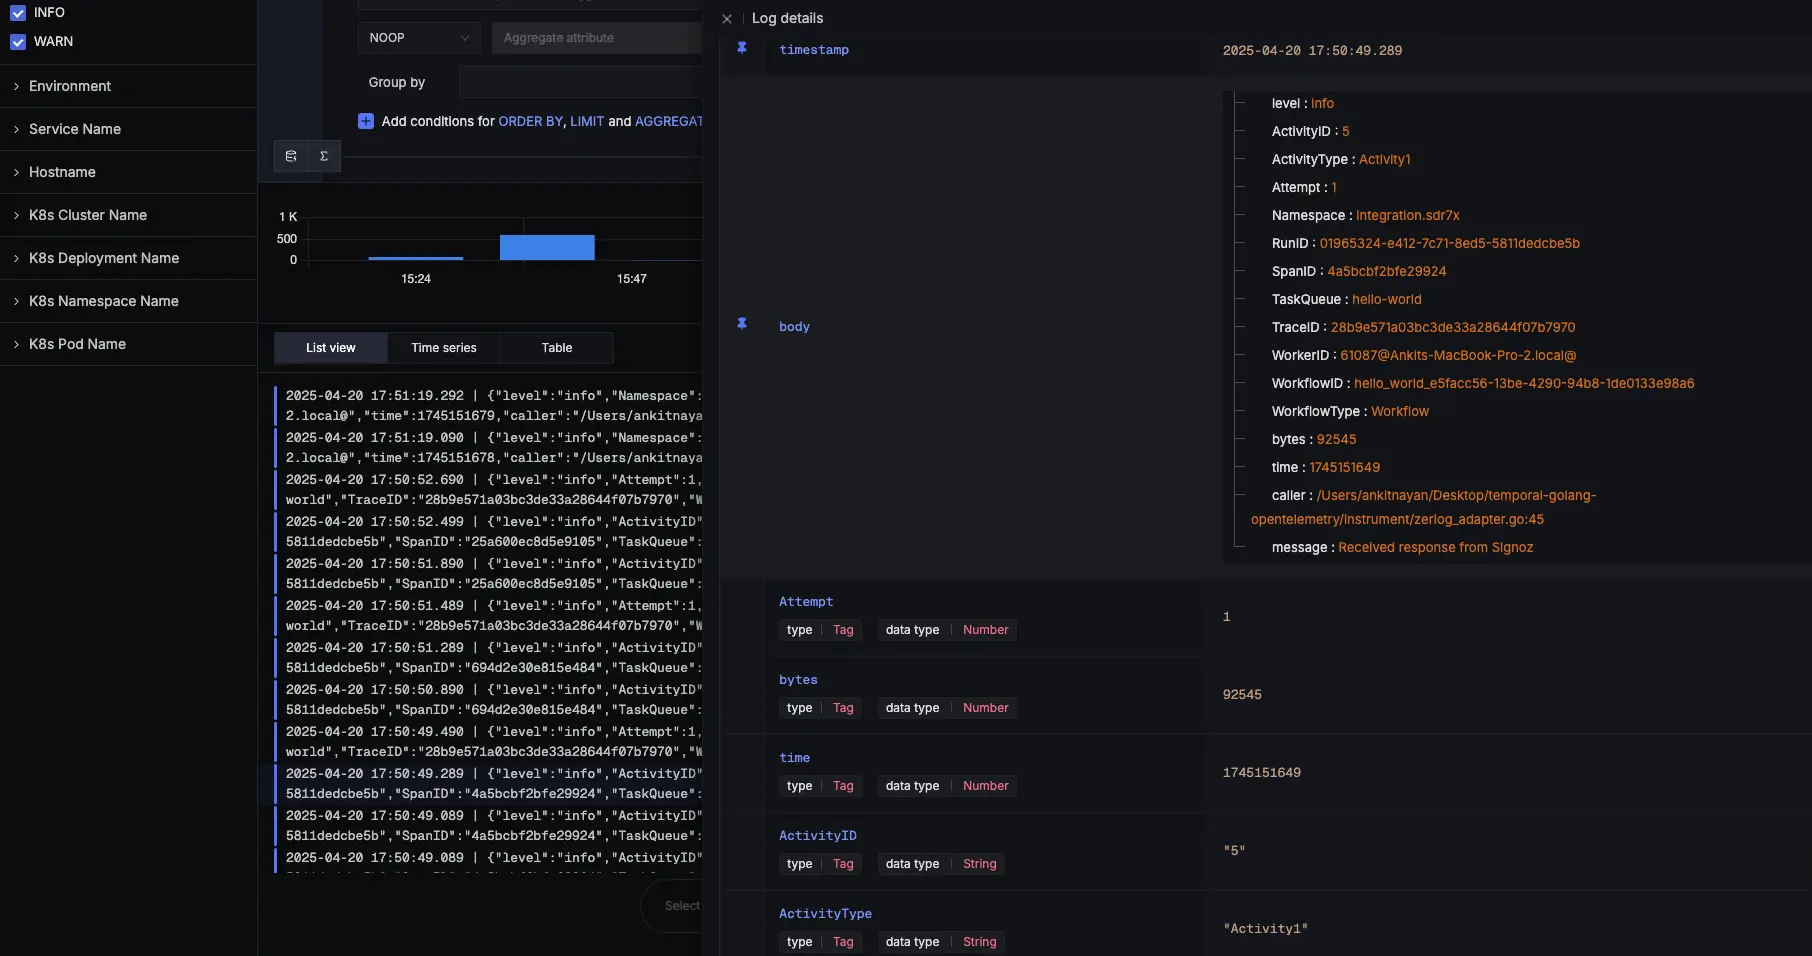
traceIDandspanIDto the right fields using the trace parser. This helps you move seamlessly between logs and traces. - Map
log_leveltoseverity_textin OTel semantics using the severity parser. - (Optional) Map the timestamp from your JSON body to OTel using the timestamp parser.

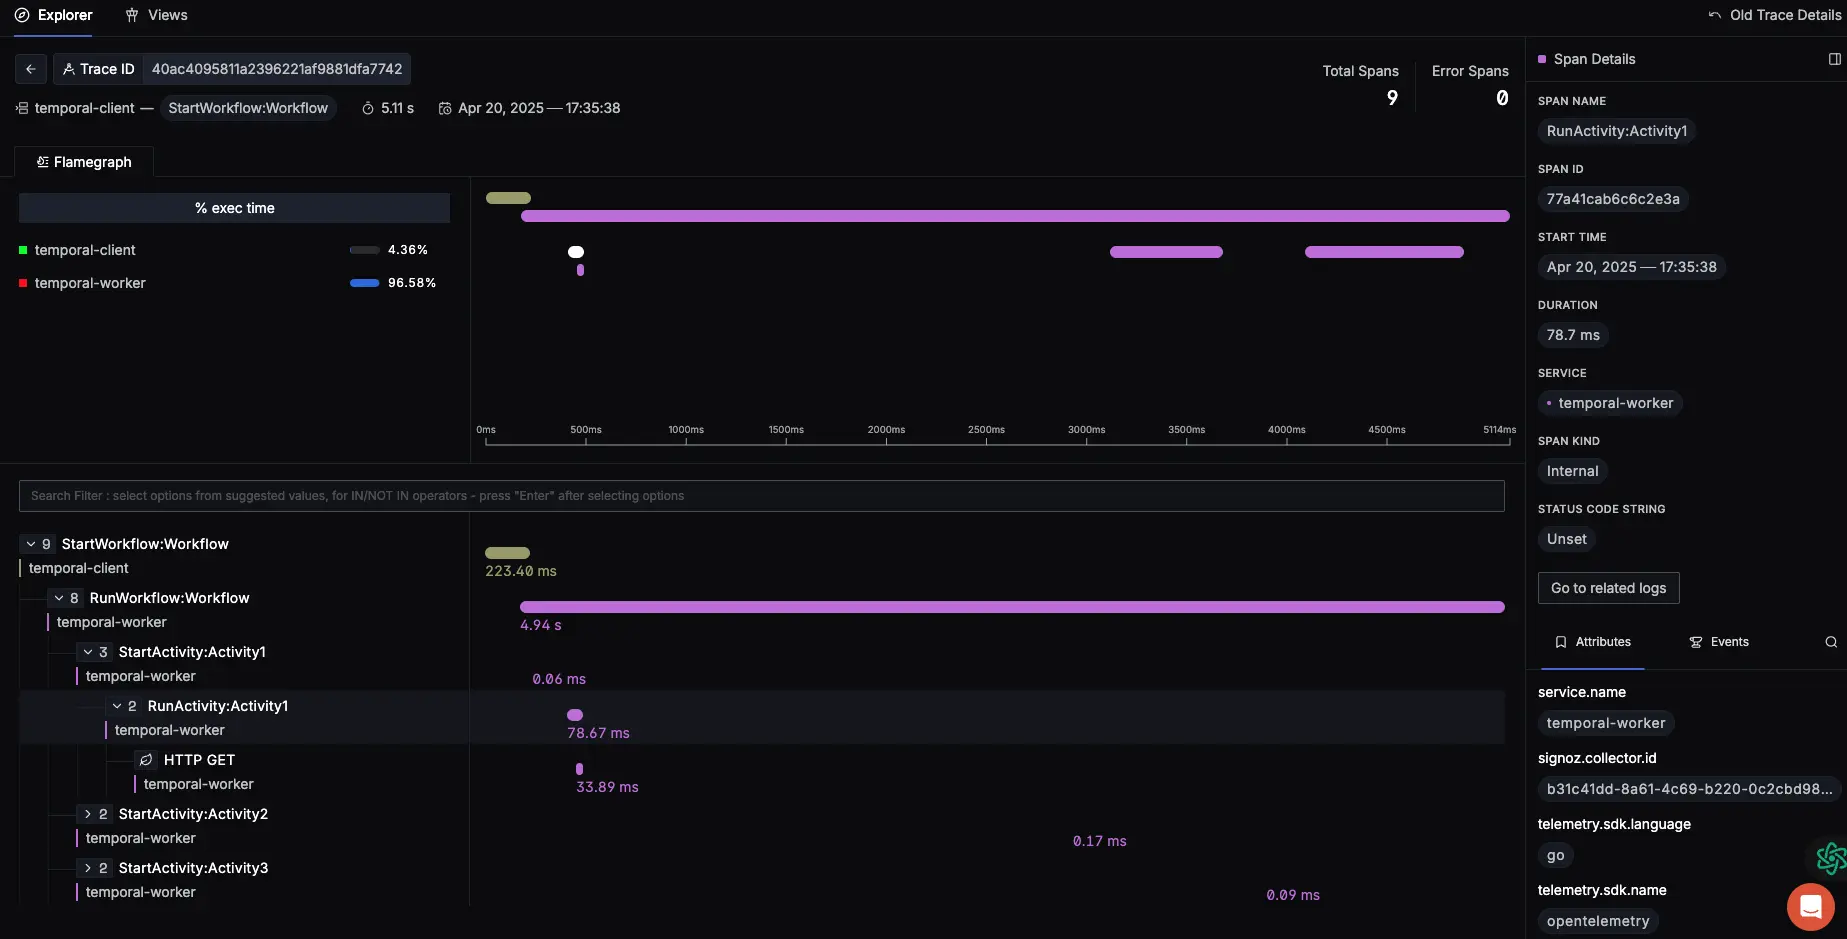
Step 6: Enjoy your data at SigNoz. Metrics, Traces and Logs all at the same tool for unified querying and correlation


