Overview
The SigNoz Metrics API enables you to programmatically query metrics over a range of time. You can use it to:
- Query gauge, counter, and histogram metrics with temporal and spatial aggregations
- Filter and group results by attributes
- Combine multiple queries using formulas (e.g., error rate = errors / total)
- Use variables for dynamic filtering
API Endpoint
POST https://{URL}/api/v5/query_range
Replace {URL} with your instance URL, e.g., example.signoz.io.
Prerequisites
API key: To access this API, you need an API key. Go to Settings → Service Accounts in SigNoz, create a service account, and generate an API key from its Keys tab. See Service Accounts for step-by-step instructions.
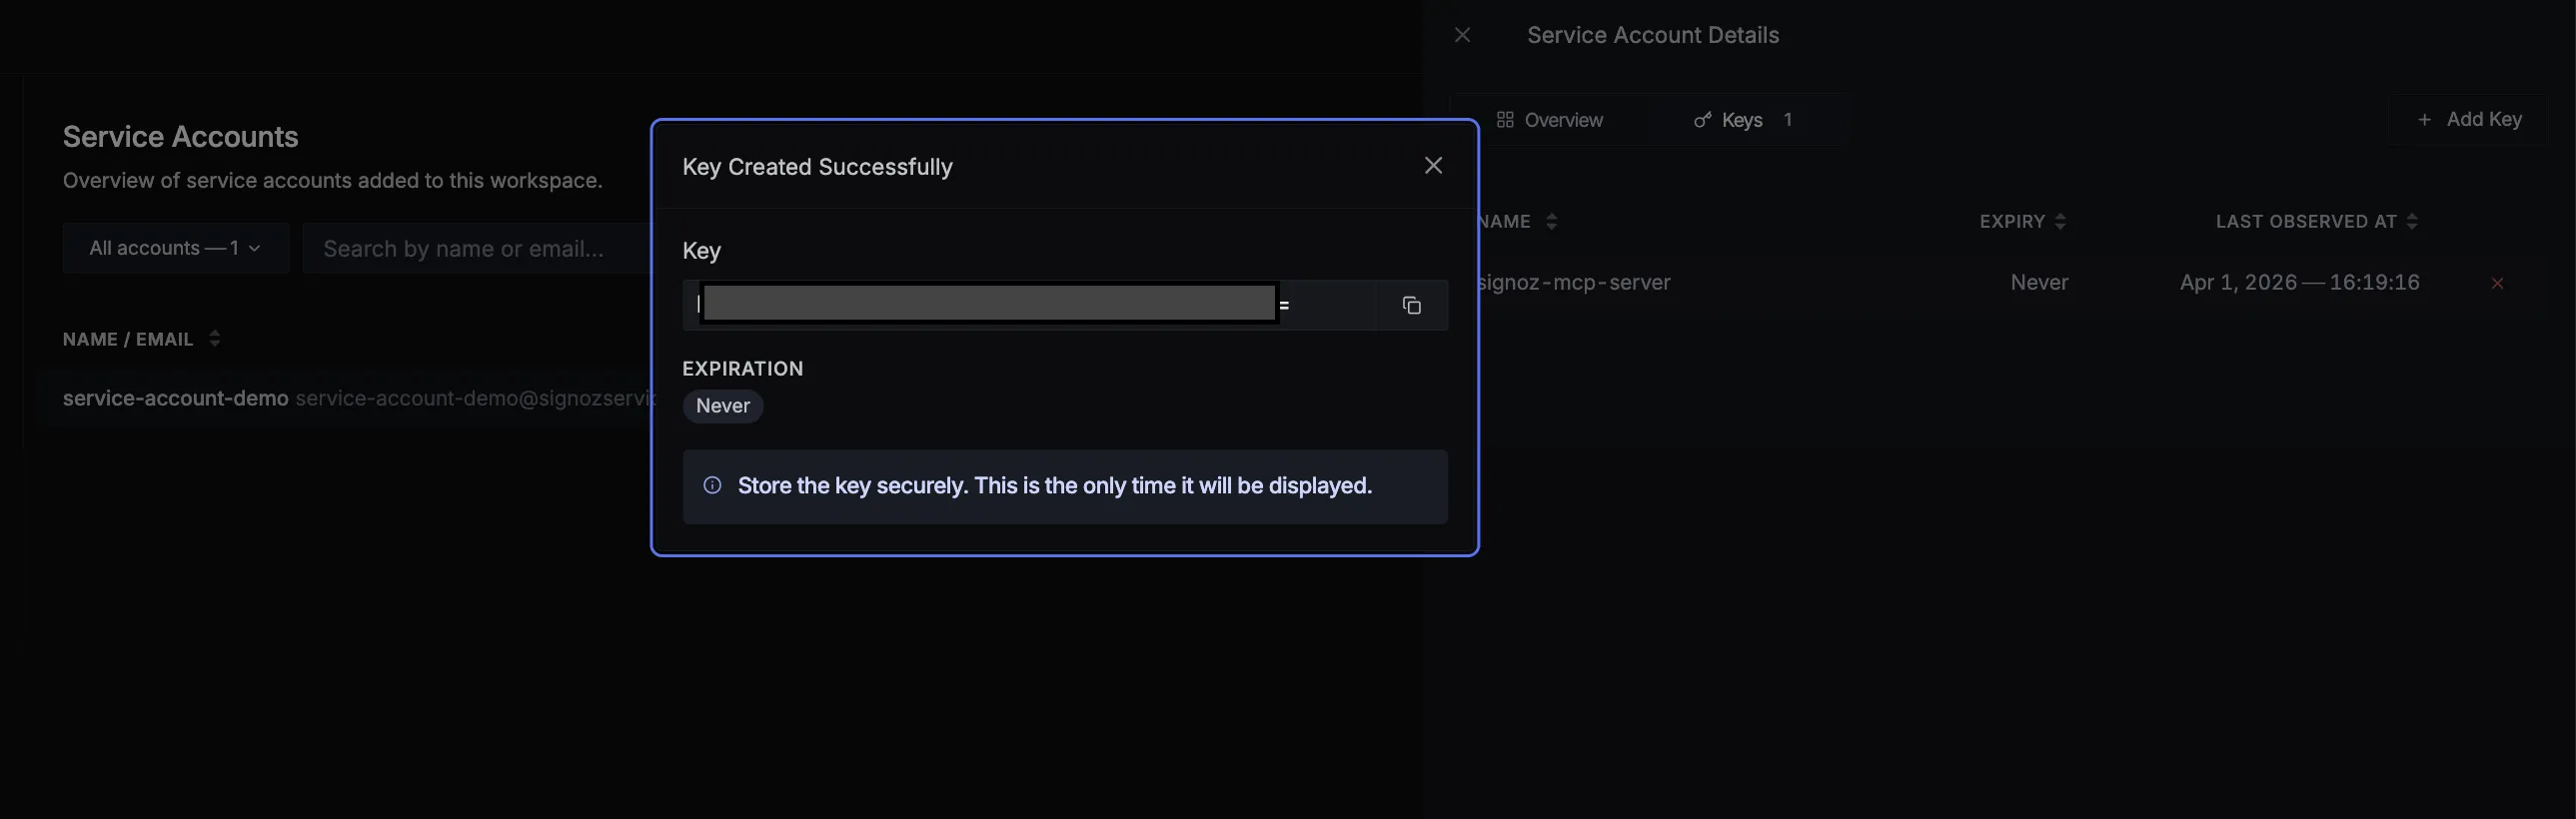
API keys can only be created/managed by users with the Admin role. If you don't have the Admin role, contact your organization's admin to create an API key for you.
Authentication
Add the API key to your request header:
SIGNOZ-API-KEY:{YOUR_API_KEY}API Specification
The full API specification is available in the OpenAPI Reference.
Example Requests
Query a Gauge Metric (CPU Usage)
{
  "start": 1742602572000,
  "end": 1742604372000,
  "requestType": "time_series",
  "compositeQuery": {
    "queries": [
      {
        "type": "builder_query",
        "spec": {
          "name": "A",
          "signal": "metrics",
          "stepInterval": 60,
          "aggregations": [
            {
              "metricName": "k8s.node.cpu.usage",
              "temporality": "Unspecified",
              "timeAggregation": "avg",
              "spaceAggregation": "sum"
            }
          ],
          "filter": {
            "expression": "k8s.cluster.name = 'my-cluster' AND k8s.node.name IN ['node-1', 'node-2']"
          },
          "groupBy": [{ "name": "k8s.node.name" }],
          "legend": "{{k8s.node.name}}",
          "disabled": false
        }
      }
    ]
  }
}
Query a Histogram Metric (P90 Latency)
{
  "start": 1742602968000,
  "end": 1742604768000,
  "requestType": "time_series",
  "compositeQuery": {
    "queries": [
      {
        "type": "builder_query",
        "spec": {
          "name": "A",
          "signal": "metrics",
          "stepInterval": 60,
          "aggregations": [
            {
              "metricName": "jvm.gc.duration.bucket",
              "spaceAggregation": "p90"
            }
          ],
          "groupBy": [{ "name": "service.name" }],
          "legend": "{{service.name}}",
          "disabled": false
        }
      }
    ]
  }
}
Compute Error Rate Using a Formula
Use two queries and a formula (A/B) to calculate error rate:
{
  "start": 1742601948000,
  "end": 1742605548000,
  "requestType": "time_series",
  "compositeQuery": {
    "queries": [
      {
        "type": "builder_query",
        "spec": {
          "name": "A",
          "signal": "metrics",
          "stepInterval": 60,
          "aggregations": [
            {
              "metricName": "signoz_calls_total",
              "timeAggregation": "rate",
              "spaceAggregation": "sum"
            }
          ],
          "filter": {
            "expression": "status.code = 'STATUS_CODE_ERROR'"
          },
          "groupBy": [{ "name": "service.name" }],
          "disabled": true
        }
      },
      {
        "type": "builder_query",
        "spec": {
          "name": "B",
          "signal": "metrics",
          "stepInterval": 60,
          "aggregations": [
            {
              "metricName": "signoz_calls_total",
              "timeAggregation": "rate",
              "spaceAggregation": "sum"
            }
          ],
          "groupBy": [{ "name": "service.name" }],
          "disabled": true
        }
      },
      {
        "type": "builder_formula",
        "spec": {
          "name": "F1",
          "expression": "A/B",
          "disabled": false
        }
      }
    ]
  }
}

