Since both platforms are now OpenTelemetry-native, the migration primarily focuses on translating Honeycomb's proprietary query syntax to PromQL and ClickHouse SQL, while leveraging SigNoz's enhanced visualization and querying capabilities.
SigNoz Dashboard Templates
SigNoz provides an extensive library of pre-built dashboard templates for common observability scenarios, making migration easier by providing starting points for your Honeycomb dashboards.
Using Dashboard Templates
Visit the SigNoz Dashboard Templates repository to explore available templates.
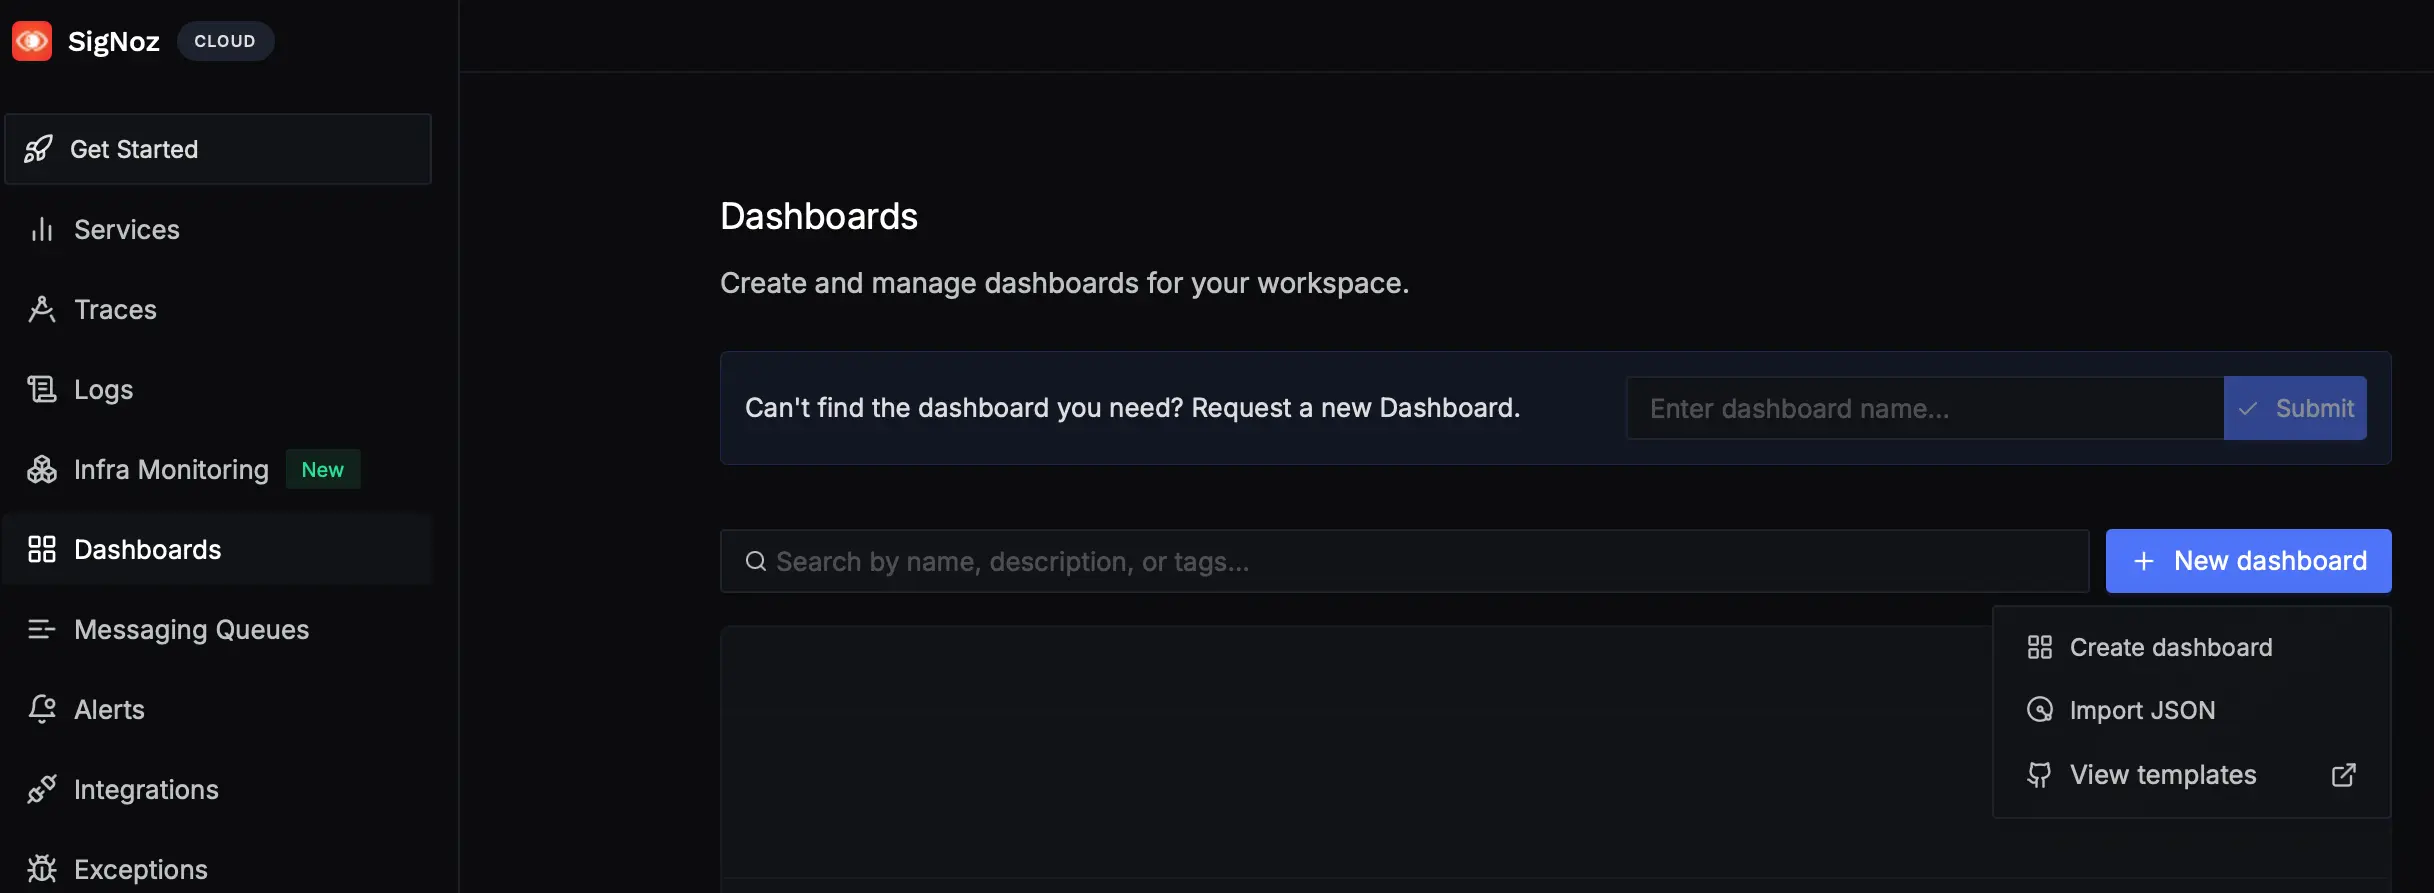
- Navigate to Dashboards in SigNoz
- Click "+ New Dashboard"
- Select "Choose from template"
- Click Import JSON
- Either paste or upload the dashboard JSON file from the repository

Requesting Custom Dashboards
You can also request SigNoz to help you with creating custom dashboards. To request a custom dashboard, please create a GitHub issue providing details about the dashboard you want to create.
Creating Custom Dashboards
In case there is no existing dashboard template that you can use, you can create a custom dashboard in SigNoz. Please follow Manage Dashboards in SigNoz documentation for more details.
SigNoz Dashboard Features
Panel Types and Visualization Options
When recreating your Honeycomb boards in SigNoz, it's important to understand which visualization types are available. SigNoz supports most common panel types and provides additional options beyond Honeycomb's capabilities:
| Panel Type | Honeycomb | SigNoz | Notes |
|---|---|---|---|
| Time Series | ✓ | ✓ | Both platforms support time series visualization |
| Table | ✓ | ✓ | Both support tabular data display |
| Bar Chart | - | ✓ | Enhanced visualization option in SigNoz |
| Pie Chart | - | ✓ | Enhanced visualization option in SigNoz |
| Value/Single Stat | - | ✓ | Single value display with thresholds |
| Heatmap | ✓ | - | Use histogram metrics as alternative |
| Text Panel | ✓ | - | Use dashboard descriptions or annotations |
| SLO Panel | ✓ | - | Recreate using custom alert rules |
For panels that don't have a direct equivalent in SigNoz, consider how you might achieve similar functionality using available visualization types. For example, Honeycomb's SLO panels can be replaced with custom alert rules and value panels showing SLO compliance metrics.
Please refer to the Panel Types documentation for more details on the panel types supported by SigNoz.
Dashboard Features
SigNoz supports essential dashboard features including:
Variables: Create template variables for dynamic dashboards Query Builder: The Query Builder is SigNoz's structured query interface that combines the power of expression-based querying with intelligent auto-completion Filters: Apply filters across panels and data sources Sharing: Share dashboards with team members and external users Time Controls: Flexible time range selection and auto-refresh
For detailed dashboard management, refer to the Manage Dashboards documentation.
Query Translation from Honeycomb
Honeycomb uses proprietary query syntax while SigNoz uses standard PromQL for metrics and ClickHouse SQL for logs/traces. You can use SigNoz's Query Builder for visual query construction or write queries directly.
Below are the most common query patterns and their SigNoz equivalents:
| Honeycomb Query | SigNoz Equivalent | Notes |
|---|---|---|
COUNT | count() | Total occurrences |
COUNT WHERE condition | count() with filters | Use search syntax for conditions |
AVG(field) | avg(field) | Mean values calculation |
P95(field), P99(field) | p95(field), p99(field) | Percentile functions |
GROUP BY field | Group By: field | Use Group By dropdown |
Below are the most common query patterns and their SigNoz equivalents for the Query Builder (ClickHouse SQL for traces and logs):
Each Honeycomb query needs to be rewritten using SigNoz Query Builder functions, with appropriate field names and aggregation functions.
Migrating dashboards from Honeycomb to SigNoz involves translating event-based queries to SigNoz's Query Builder functions. SigNoz's extensive template library, enhanced panel types, and unified observability approach provide significant advantages over Honeycomb's board-based system, enabling better visualization and correlation across metrics, logs, and traces.
Next Steps
With your dashboards successfully migrated from Honeycomb to SigNoz:
- Migrate Alerts - Convert Honeycomb triggers and SLOs to SigNoz alert rules for your dashboard metrics
- Optimize dashboards - Explore advanced Query Builder features and dashboard management for enhanced team collaboration