Overview
This guide walks you through setting up monitoring and observability for Pipecat using OpenTelemetry and exporting logs, traces, and metrics to SigNoz. With this integration, you can observe the performance of various models, capture request/response details, and track system-level metrics in SigNoz, giving you real-time visibility into latency, error rates, and usage trends for your Pipecat applications.
Instrumenting Pipecat in your AI applications with telemetry ensures full observability across your voice agent workflows, making it easier to debug issues, optimize performance, and understand user interactions. By leveraging SigNoz, you can analyze correlated traces, logs, and metrics in unified dashboards, configure alerts, and gain actionable insights to continuously improve reliability, responsiveness, and user experience.
Prerequisites
- A SigNoz Cloud account with an active ingestion key or Self Hosted SigNoz instance
- Internet access to send telemetry data to SigNoz Cloud
- Python 3.10+ with Pipecat installed
- For Python:
uvinstalled for managing Python packages - Deepgram Account for STT
- Cartesia Account for TTS
- OpenAI API Key
Monitoring Pipecat
For detailed information on instrumenting Pipecat applications with OpenTelemetry, see the Pipecat OpenTelemetry documentation.
Get started with a sample Pipecat starter project by following the Pipecat quickstart docs
No-code auto-instrumentation is recommended for quick setup with minimal code changes. It's ideal when you want to get observability up and running without modifying your application code and are leveraging standard instrumentor libraries.
Step 1: Clone the sample voice agent project and setup dependencies
git clone https://github.com/pipecat-ai/pipecat-quickstart.git
cd agent-starter-python
uv sync
Step 2: Setup Credentials
Copy .env.example to .env and filling in the required keys:
DEEPGRAM_API_KEYOPENAI_API_KEYCARTESIA_API_KEY
Step 3: Add Automatic Instrumentation
uv pip install opentelemetry-distro opentelemetry-exporter-otlp
uv run opentelemetry-bootstrap -a requirements | uv pip install --requirement -
Step 4: Instrument your Pipecat application
task = PipelineTask(
    pipeline,
    params=PipelineParams(
        enable_metrics=True,                              # Required for some service metrics
    ),
    enable_tracing=True,                                  # Enable tracing for this task
    enable_turn_tracking=True,                            # Enable turn tracking for this task
    conversation_id="customer-123",                       # Optional - will auto-generate if not provided
    additional_span_attributes={"session.id": "abc-123"} # Optional - additional attributes to attach to the otel span
)
See this example repo for more details on how to configure instrumentation.
Step 5: Your bot.py should look something like this:
#
# Copyright (c) 2024–2025, Daily
#
# SPDX-License-Identifier: BSD 2-Clause License
#

"""Pipecat Quickstart Example.

The example runs a simple voice AI bot that you can connect to using your
browser and speak with it. You can also deploy this bot to Pipecat Cloud.

Required AI services:
- Deepgram (Speech-to-Text)
- OpenAI (LLM)
- Cartesia (Text-to-Speech)

Run the bot using::

    uv run bot.py
"""

import os

from dotenv import load_dotenv
from loguru import logger

print("🚀 Starting Pipecat bot...")
print("⏳ Loading models and imports (20 seconds, first run only)\n")

logger.info("Loading Local Smart Turn Analyzer V3...")
from pipecat.audio.turn.smart_turn.local_smart_turn_v3 import LocalSmartTurnAnalyzerV3

logger.info("✅ Local Smart Turn Analyzer V3 loaded")
logger.info("Loading Silero VAD model...")
from pipecat.audio.vad.silero import SileroVADAnalyzer

logger.info("✅ Silero VAD model loaded")

from pipecat.audio.vad.vad_analyzer import VADParams
from pipecat.frames.frames import LLMRunFrame

logger.info("Loading pipeline components...")
from pipecat.pipeline.pipeline import Pipeline
from pipecat.pipeline.runner import PipelineRunner
from pipecat.pipeline.task import PipelineParams, PipelineTask
from pipecat.processors.aggregators.llm_context import LLMContext
from pipecat.processors.aggregators.llm_response_universal import LLMContextAggregatorPair
from pipecat.processors.frameworks.rtvi import RTVIConfig, RTVIObserver, RTVIProcessor
from pipecat.runner.types import RunnerArguments
from pipecat.runner.utils import create_transport
from pipecat.services.cartesia.tts import CartesiaTTSService
from pipecat.services.deepgram.stt import DeepgramSTTService
from pipecat.services.openai.llm import OpenAILLMService
from pipecat.transports.base_transport import BaseTransport, TransportParams
from pipecat.transports.daily.transport import DailyParams


logger.info("✅ All components loaded successfully!")

load_dotenv(override=True)


async def run_bot(transport: BaseTransport, runner_args: RunnerArguments):
    logger.info(f"Starting bot")

    stt = DeepgramSTTService(api_key=os.getenv("DEEPGRAM_API_KEY"))

    tts = CartesiaTTSService(
        api_key=os.getenv("CARTESIA_API_KEY"),
        voice_id="71a7ad14-091c-4e8e-a314-022ece01c121",  # British Reading Lady
    )

    llm = OpenAILLMService(api_key=os.getenv("OPENAI_API_KEY"))

    messages = [
        {
            "role": "system",
            "content": "You are a friendly AI assistant. Respond naturally and keep your answers conversational.",
        },
    ]

    context = LLMContext(messages)
    context_aggregator = LLMContextAggregatorPair(context)

    rtvi = RTVIProcessor(config=RTVIConfig(config=[]))

    pipeline = Pipeline(
        [
            transport.input(),  # Transport user input
            rtvi,  # RTVI processor
            stt,
            context_aggregator.user(),  # User responses
            llm,  # LLM
            tts,  # TTS
            transport.output(),  # Transport bot output
            context_aggregator.assistant(),  # Assistant spoken responses
        ]
    )

    # Enable tracing in your PipelineTask
    task = PipelineTask(
        pipeline,
        params=PipelineParams(
            enable_metrics=True,
            enable_usage_metrics=True,
        ),
        enable_tracing=True,                                  # Enable tracing for this task
        enable_turn_tracking=True,
        observers=[RTVIObserver(rtvi)],
    )

    @transport.event_handler("on_client_connected")
    async def on_client_connected(transport, client):
        logger.info(f"Client connected")
        # Kick off the conversation.
        messages.append({"role": "system", "content": "Say hello and briefly introduce yourself."})
        await task.queue_frames([LLMRunFrame()])

    @transport.event_handler("on_client_disconnected")
    async def on_client_disconnected(transport, client):
        logger.info(f"Client disconnected")
        await task.cancel()

    runner = PipelineRunner(handle_sigint=runner_args.handle_sigint)

    await runner.run(task)


async def bot(runner_args: RunnerArguments):
    """Main bot entry point for the bot starter."""

    transport_params = {
        "daily": lambda: DailyParams(
            audio_in_enabled=True,
            audio_out_enabled=True,
            vad_analyzer=SileroVADAnalyzer(params=VADParams(stop_secs=0.2)),
            turn_analyzer=LocalSmartTurnAnalyzerV3(),
        ),
        "webrtc": lambda: TransportParams(
            audio_in_enabled=True,
            audio_out_enabled=True,
            vad_analyzer=SileroVADAnalyzer(params=VADParams(stop_secs=0.2)),
            turn_analyzer=LocalSmartTurnAnalyzerV3(),
        ),
    }

    transport = await create_transport(runner_args, transport_params)

    await run_bot(transport, runner_args)


if __name__ == "__main__":
    from pipecat.runner.run import main

    main()
Step 6: Run your application with auto-instrumentation
OTEL_RESOURCE_ATTRIBUTES="service.name=<service_name>" \
OTEL_EXPORTER_OTLP_ENDPOINT="https://ingest.<region>.signoz.cloud:443" \
OTEL_EXPORTER_OTLP_HEADERS="signoz-ingestion-key=<your-ingestion-key>" \
OTEL_EXPORTER_OTLP_PROTOCOL=grpc \
OTEL_TRACES_EXPORTER=otlp \
OTEL_METRICS_EXPORTER=otlp \
OTEL_LOGS_EXPORTER=otlp \
OTEL_PYTHON_LOG_CORRELATION=true \
OTEL_PYTHON_LOGGING_AUTO_INSTRUMENTATION_ENABLED=true \
<your_run_command with opentelemetry-instrument>
<service_name>is the name of your service<region>: Your SigNoz Cloud region<your-ingestion-key>: Your SigNoz ingestion key- Replace
<your_run_command>with the actual command you would use to run your application. In this case we would use:uv run opentelemetry-instrument python bot.py
Using self-hosted SigNoz? Most steps are identical. To adapt this guide, update the endpoint and remove the ingestion key header as shown in Cloud → Self-Hosted.
Open http://localhost:7860 in your browser and click Connect to start talking to your bot.
Code-based instrumentation gives you fine-grained control over your telemetry configuration. Use this approach when you need to customize resource attributes, sampling strategies, or integrate with existing observability infrastructure.
Step 1: Clone the sample voice agent project and setup dependencies
git clone https://github.com/pipecat-ai/pipecat-quickstart.git
cd agent-starter-python
uv sync
Step 2: Setup Credentials
Copy .env.example to .env and filling in the required keys:
DEEPGRAM_API_KEYOPENAI_API_KEYCARTESIA_API_KEY
Step 3: Install additional OpenTelemetry dependencies
uv pip install \
  opentelemetry-api \
  opentelemetry-sdk \
  opentelemetry-exporter-otlp \
  opentelemetry-instrumentation-httpx \
  opentelemetry-instrumentation-system-metrics
Step 4: Import the necessary modules in your Python application
Traces:
from opentelemetry.exporter.otlp.proto.http.trace_exporter import OTLPSpanExporter
Logs:
from opentelemetry.sdk._logs import LoggerProvider, LoggingHandler
from opentelemetry.sdk._logs.export import BatchLogRecordProcessor
from opentelemetry.exporter.otlp.proto.http._log_exporter import OTLPLogExporter
from opentelemetry._logs import set_logger_provider
import logging
Metrics:
from opentelemetry.sdk.metrics import MeterProvider
from opentelemetry.exporter.otlp.proto.http.metric_exporter import OTLPMetricExporter
from opentelemetry.sdk.metrics.export import PeriodicExportingMetricReader
from opentelemetry import metrics
from opentelemetry.instrumentation.system_metrics import SystemMetricsInstrumentor
from opentelemetry.instrumentation.httpx import HTTPXClientInstrumentor
Step 5: Set up the OpenTelemetry Span Exporter to send traces directly to SigNoz Cloud
from opentelemetry.exporter.otlp.proto.http.trace_exporter import OTLPSpanExporter
import os


span_exporter = OTLPSpanExporter(
    endpoint= os.getenv("OTEL_EXPORTER_TRACES_ENDPOINT"),
    headers={"signoz-ingestion-key": os.getenv("SIGNOZ_INGESTION_KEY")},
)
OTEL_EXPORTER_TRACES_ENDPOINT→ SigNoz Cloud trace endpoint with appropriate region:https://ingest.<region>.signoz.cloud:443/v1/tracesSIGNOZ_INGESTION_KEY→ Your SigNoz ingestion key
Using self-hosted SigNoz? Most steps are identical. To adapt this guide, update the endpoint and remove the ingestion key header as shown in Cloud → Self-Hosted.
Step 6: Setup Logs
import logging
from opentelemetry.sdk.resources import Resource
from opentelemetry._logs import set_logger_provider
from opentelemetry.sdk._logs import LoggerProvider, LoggingHandler
from opentelemetry.sdk._logs.export import BatchLogRecordProcessor
from opentelemetry.exporter.otlp.proto.http._log_exporter import OTLPLogExporter
import os

resource = Resource.create({"service.name": "<service_name>"})
logger_provider = LoggerProvider(resource=resource)
set_logger_provider(logger_provider)

otlp_log_exporter = OTLPLogExporter(
    endpoint= os.getenv("OTEL_EXPORTER_LOGS_ENDPOINT"),
    headers={"signoz-ingestion-key": os.getenv("SIGNOZ_INGESTION_KEY")},
)
logger_provider.add_log_record_processor(
    BatchLogRecordProcessor(otlp_log_exporter)
)
# Attach OTel logging handler to root logger
handler = LoggingHandler(level=logging.INFO, logger_provider=logger_provider)
logging.basicConfig(level=logging.INFO, handlers=[handler])

logger = logging.getLogger(__name__)
<service_name>is the name of your serviceOTEL_EXPORTER_LOGS_ENDPOINT→ SigNoz Cloud endpoint with appropriate region:https://ingest.<region>.signoz.cloud:443/v1/logsSIGNOZ_INGESTION_KEY→ Your SigNoz ingestion key
Using self-hosted SigNoz? Most steps are identical. To adapt this guide, update the endpoint and remove the ingestion key header as shown in Cloud → Self-Hosted.
Step 7: Setup Metrics
from opentelemetry.sdk.resources import Resource
from opentelemetry.sdk.metrics import MeterProvider
from opentelemetry.exporter.otlp.proto.http.metric_exporter import OTLPMetricExporter
from opentelemetry.sdk.metrics.export import PeriodicExportingMetricReader
from opentelemetry import metrics
from opentelemetry.instrumentation.system_metrics import SystemMetricsInstrumentor
import os

resource = Resource.create({"service.name": "<service-name>"})
metric_exporter = OTLPMetricExporter(
    endpoint= os.getenv("OTEL_EXPORTER_METRICS_ENDPOINT"),
    headers={"signoz-ingestion-key": os.getenv("SIGNOZ_INGESTION_KEY")},
)
reader = PeriodicExportingMetricReader(metric_exporter)
metric_provider = MeterProvider(metric_readers=[reader], resource=resource)
metrics.set_meter_provider(metric_provider)

meter = metrics.get_meter(__name__)

# turn on out-of-the-box metrics
SystemMetricsInstrumentor().instrument()
HTTPXClientInstrumentor().instrument()
<service_name>is the name of your serviceOTEL_EXPORTER_METRICS_ENDPOINT→ SigNoz Cloud endpoint with appropriate region:https://ingest.<region>.signoz.cloud:443/v1/metricsSIGNOZ_INGESTION_KEY→ Your SigNoz ingestion key
Using self-hosted SigNoz? Most steps are identical. To adapt this guide, update the endpoint and remove the ingestion key header as shown in Cloud → Self-Hosted.
📌 Note: SystemMetricsInstrumentor provides system metrics (CPU, memory, etc.), and HTTPXClientInstrumentor provides outbound HTTP request metrics such as request duration. If you want to add custom metrics to your Pipecat application, see Python Custom Metrics.
Step 8: Instrument your Pipecat application
#
# Copyright (c) 2024–2025, Daily
#
# SPDX-License-Identifier: BSD 2-Clause License
#

"""Pipecat Quickstart Example.

The example runs a simple voice AI bot that you can connect to using your
browser and speak with it. You can also deploy this bot to Pipecat Cloud.

Required AI services:
- Deepgram (Speech-to-Text)
- OpenAI (LLM)
- Cartesia (Text-to-Speech)

Run the bot using::

    uv run bot.py
"""

import os

from dotenv import load_dotenv
from loguru import logger

print("🚀 Starting Pipecat bot...")
print("⏳ Loading models and imports (20 seconds, first run only)\n")

logger.info("Loading Local Smart Turn Analyzer V3...")
from pipecat.audio.turn.smart_turn.local_smart_turn_v3 import LocalSmartTurnAnalyzerV3

logger.info("✅ Local Smart Turn Analyzer V3 loaded")
logger.info("Loading Silero VAD model...")
from pipecat.audio.vad.silero import SileroVADAnalyzer

logger.info("✅ Silero VAD model loaded")

from pipecat.audio.vad.vad_analyzer import VADParams
from pipecat.frames.frames import LLMRunFrame

logger.info("Loading pipeline components...")
from pipecat.pipeline.pipeline import Pipeline
from pipecat.pipeline.runner import PipelineRunner
from pipecat.pipeline.task import PipelineParams, PipelineTask
from pipecat.processors.aggregators.llm_context import LLMContext
from pipecat.processors.aggregators.llm_response_universal import LLMContextAggregatorPair
from pipecat.processors.frameworks.rtvi import RTVIConfig, RTVIObserver, RTVIProcessor
from pipecat.runner.types import RunnerArguments
from pipecat.runner.utils import create_transport
from pipecat.services.cartesia.tts import CartesiaTTSService
from pipecat.services.deepgram.stt import DeepgramSTTService
from pipecat.services.openai.llm import OpenAILLMService
from pipecat.transports.base_transport import BaseTransport, TransportParams
from pipecat.transports.daily.transport import DailyParams
from pipecat.utils.tracing.setup import setup_tracing


logger.info("✅ All components loaded successfully!")

load_dotenv(override=True)


async def run_bot(transport: BaseTransport, runner_args: RunnerArguments):
    logger.info(f"Starting bot")

    stt = DeepgramSTTService(api_key=os.getenv("DEEPGRAM_API_KEY"))

    tts = CartesiaTTSService(
        api_key=os.getenv("CARTESIA_API_KEY"),
        voice_id="71a7ad14-091c-4e8e-a314-022ece01c121",  # British Reading Lady
    )

    llm = OpenAILLMService(api_key=os.getenv("OPENAI_API_KEY"))

    messages = [
        {
            "role": "system",
            "content": "You are a friendly AI assistant. Respond naturally and keep your answers conversational.",
        },
    ]

    context = LLMContext(messages)
    context_aggregator = LLMContextAggregatorPair(context)

    rtvi = RTVIProcessor(config=RTVIConfig(config=[]))

    pipeline = Pipeline(
        [
            transport.input(),  # Transport user input
            rtvi,  # RTVI processor
            stt,
            context_aggregator.user(),  # User responses
            llm,  # LLM
            tts,  # TTS
            transport.output(),  # Transport bot output
            context_aggregator.assistant(),  # Assistant spoken responses
        ]
    )

    setup_tracing(
        service_name="<service-name>",
        exporter=span_exporter, #from initialized Span Exporter in Step 5
        console_export=False,  # Set to True for debug output
    )

    # Enable tracing in your PipelineTask
    task = PipelineTask(
        pipeline,
        params=PipelineParams(
            enable_metrics=True,
            enable_usage_metrics=True,
        ),
        enable_tracing=True,                                  # Enable tracing for this task
        enable_turn_tracking=True,
        observers=[RTVIObserver(rtvi)],
    )

    @transport.event_handler("on_client_connected")
    async def on_client_connected(transport, client):
        logger.info(f"Client connected")
        # Kick off the conversation.
        messages.append({"role": "system", "content": "Say hello and briefly introduce yourself."})
        await task.queue_frames([LLMRunFrame()])

    @transport.event_handler("on_client_disconnected")
    async def on_client_disconnected(transport, client):
        logger.info(f"Client disconnected")
        await task.cancel()

    runner = PipelineRunner(handle_sigint=runner_args.handle_sigint)

    await runner.run(task)


async def bot(runner_args: RunnerArguments):
    """Main bot entry point for the bot starter."""

    transport_params = {
        "daily": lambda: DailyParams(
            audio_in_enabled=True,
            audio_out_enabled=True,
            vad_analyzer=SileroVADAnalyzer(params=VADParams(stop_secs=0.2)),
            turn_analyzer=LocalSmartTurnAnalyzerV3(),
        ),
        "webrtc": lambda: TransportParams(
            audio_in_enabled=True,
            audio_out_enabled=True,
            vad_analyzer=SileroVADAnalyzer(params=VADParams(stop_secs=0.2)),
            turn_analyzer=LocalSmartTurnAnalyzerV3(),
        ),
    }

    transport = await create_transport(runner_args, transport_params)

    await run_bot(transport, runner_args)


if __name__ == "__main__":
    from pipecat.runner.run import main

    main()
Step 9: Run your example bot.py
uv run bot.py
Open http://localhost:7860 in your browser and click Connect to start talking to your bot.
View Traces, Logs, and Metrics in SigNoz
Your Pipecat voice agent usage should now automatically emit traces, logs, and metrics.
You should be able to view traces in Signoz Cloud under the traces tab:

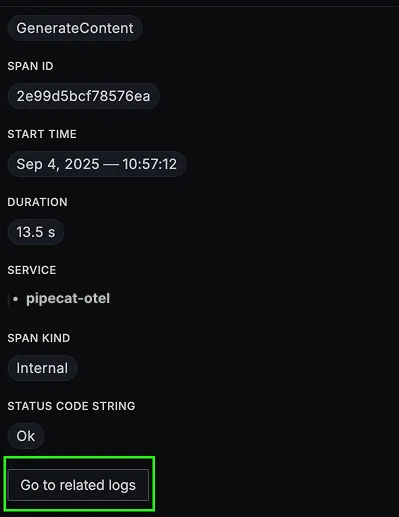
When you click on a trace in SigNoz, you'll see a detailed view of the trace, including all associated spans, along with their events and attributes.

You should be able to view logs in Signoz Cloud under the logs tab. You can also view logs by clicking on the “Related Logs” button in the trace view to see correlated logs:

When you click on any of these logs in SigNoz, you'll see a detailed view of the log, including attributes:

You should be able to see Pipecat related metrics in Signoz Cloud under the metrics tab:

When you click on any of these metrics in SigNoz, you'll see a detailed view of the metric, including attributes:

Troubleshooting
If you don't see your telemetry data:
- Verify network connectivity - Ensure your application can reach SigNoz Cloud endpoints
- Check ingestion key - Verify your SigNoz ingestion key is correct
- Wait for data - OpenTelemetry batches data before sending, so wait 10-30 seconds after making API calls
- Try a console exporter — Enable a console exporter locally to confirm that your application is generating telemetry data before it's sent to SigNoz
Next Steps
You can also check out our custom Pipecat dashboard here which provides specialized visualizations for monitoring your Pipecat usage in applications. The dashboard includes pre-built charts specifically tailored for LLM usage, along with import instructions to get started quickly.

Additional resources:
- Set up alerts for high latency or error rates
- Learn more about querying traces
- Explore log correlation
