What is Temporal Observability?
Temporal observability gives you real-time visibility into your workflow executions and AI agent patterns by collecting traces, logs, and metrics using OpenTelemetry. This guide shows you how to instrument your Temporal-based applications and send telemetry to SigNoz, so you can monitor workflow activity, debug agent execution, and optimize performance end-to-end.
With full Temporal observability in SigNoz, you can correlate traces, logs, and metrics in a single dashboard, set up alerts for workflow failures or high latency, and analyze agent execution patterns over time to continuously improve reliability and efficiency.
Prerequisites
- A SigNoz Cloud account with an active ingestion key or Self Hosted SigNoz instance
- Internet access to send telemetry data to SigNoz Cloud
- Python 3.10+ with
temporalioinstalled - For Python:
pipinstalled for managing Python packages
Monitor Temporal Workflows with OpenTelemetry
No code auto-instrumentation is recommended for quick setup with minimal code changes. It's ideal when you want to get observability up and running without modifying your application code and are leveraging standard instrumentor libraries. For more information on getting started with Temporal in your Python environment, refer to the Temporal Python Setup Guide
Step 1: Install the necessary packages in your Python environment.
pip install \
  opentelemetry-distro \
  opentelemetry-exporter-otlp \
  httpx \
  opentelemetry-instrumentation-httpx \
  opentelemetry-instrumentation-system-metrics \
  temporalio \
  openinference-instrumentation-openai-agents \
  openai \
  openai-agents
Step 2: Add Automatic Instrumentation
opentelemetry-bootstrap --action=install
Step 3: Set up environment variables
Create a .env file in your project root and add the following environment variables based on your Temporal deployment:
OPENAI_API_KEY=<your-openai-api-key>
TEMPORAL_ADDRESS=<local-temporal-server>
<local-temporal-server>is the location where your local Temporal server is hosted(default:localhost:7233)
OPENAI_API_KEY=<your-openai-api-key>
TEMPORAL_ADDRESS=<your-temporal-cloud-address>
TEMPORAL_NAMESPACE=<your-temporal-namespace-name>
TEMPORAL_API_KEY=<your-temporal-api-key>
TEMPORAL_TLS=true
Step 4: Create an example Temporal agent workflow
from __future__ import annotations
from dotenv import load_dotenv
import asyncio
import os
from temporalio import workflow
from temporalio.client import Client
from temporalio.worker import Worker
from temporalio.contrib.openai_agents import OpenAIAgentsPlugin
from temporalio.worker import UnsandboxedWorkflowRunner
from agents import Agent, Runner

load_dotenv()

@workflow.defn
class HelloWorldAgent:
    @workflow.run
    async def run(self, prompt: str) -> str:
        agent = Agent(
            name="Assistant",
            model="gpt-5",
            instructions="You only respond in haikus.",
        )

        result = await Runner.run(agent, input=prompt)
        return result.final_output

async def main():
    tls = os.environ.get("TEMPORAL_TLS", "").lower() in ("1", "true", "yes")
    api_key = os.environ.get("TEMPORAL_API_KEY")

    plugin = OpenAIAgentsPlugin()

    client = await Client.connect(
        target_host=os.environ.get("TEMPORAL_ADDRESS", "localhost:7233"),
        namespace=os.environ.get("TEMPORAL_NAMESPACE", "default"),
        api_key=api_key or None,
        tls=tls,
        plugins=[plugin]
    )

    worker = Worker(
        client,
        task_queue=os.environ.get("TEMPORAL_TASK_QUEUE", "openai-agents-task-queue"),
        workflows=[HelloWorldAgent],
        workflow_runner=UnsandboxedWorkflowRunner()
    )

    async with worker:
        handle = await client.start_workflow(
            HelloWorldAgent.run,
            id="hello-world-workflow-01",
            task_queue=os.environ.get("TEMPORAL_TASK_QUEUE", "openai-agents-task-queue"),
            args=["Tell me about SigNoz"],
        )
        result = await handle.result()
        print("\nWorkflow result:\n", result)

asyncio.run(main())
Step 5: Run your application with auto-instrumentation
Run your application with the following environment variables set. This configures OpenTelemetry to export traces, logs, and metrics to SigNoz Cloud and enables automatic log correlation:
OTEL_RESOURCE_ATTRIBUTES="service.name=<service_name>" \
OTEL_EXPORTER_OTLP_ENDPOINT="https://ingest.<region>.signoz.cloud:443" \
OTEL_EXPORTER_OTLP_HEADERS="signoz-ingestion-key=<your-ingestion-key>" \
OTEL_EXPORTER_OTLP_PROTOCOL=grpc \
OTEL_TRACES_EXPORTER=otlp \
OTEL_METRICS_EXPORTER=otlp \
OTEL_LOGS_EXPORTER=otlp \
OTEL_PYTHON_LOG_CORRELATION=true \
OTEL_PYTHON_LOGGING_AUTO_INSTRUMENTATION_ENABLED=true \
opentelemetry-instrument <your_run_command>
<service_name>is the name of your service<region>: Your SigNoz Cloud region<your-ingestion-key>: Your SigNoz ingestion key- Replace
<your_run_command>with the actual command you would use to run your application. In this case we would use:python main.py
Using self-hosted SigNoz? Most steps are identical. To adapt this guide, update the endpoint and remove the ingestion key header as shown in Cloud → Self-Hosted.
Code-based manual instrumentation gives you fine-grained control over your telemetry configuration. Use this approach when you need to customize resource attributes, sampling strategies, or integrate with existing observability infrastructure.
Step 1: Install additional OpenTelemetry dependencies
pip install \
  opentelemetry-api \
  opentelemetry-sdk \
  opentelemetry-exporter-otlp \
  opentelemetry-instrumentation-httpx \
  opentelemetry-instrumentation-system-metrics \
  temporalio \
  openinference-instrumentation-openai-agents
Step 2: Import the necessary modules in your Python application
Traces:
from opentelemetry import trace
from opentelemetry.sdk.resources import Resource
from opentelemetry.sdk.trace import TracerProvider
from opentelemetry.sdk.trace.export import BatchSpanProcessor
from opentelemetry.exporter.otlp.proto.http.trace_exporter import OTLPSpanExporter
Logs:
from opentelemetry.sdk._logs import LoggerProvider, LoggingHandler
from opentelemetry.sdk._logs.export import BatchLogRecordProcessor
from opentelemetry.exporter.otlp.proto.http._log_exporter import OTLPLogExporter
from opentelemetry._logs import set_logger_provider
import logging
Metrics:
from opentelemetry.sdk.metrics import MeterProvider
from opentelemetry.exporter.otlp.proto.http.metric_exporter import OTLPMetricExporter
from opentelemetry.sdk.metrics.export import PeriodicExportingMetricReader
from opentelemetry import metrics
from opentelemetry.instrumentation.system_metrics import SystemMetricsInstrumentor
from opentelemetry.instrumentation.httpx import HTTPXClientInstrumentor
Step 3: Set up the OpenTelemetry Tracer Provider to send traces directly to SigNoz Cloud
from opentelemetry.sdk.resources import Resource
from opentelemetry.sdk.trace import TracerProvider
from opentelemetry.sdk.trace.export import BatchSpanProcessor
from opentelemetry.exporter.otlp.proto.http.trace_exporter import OTLPSpanExporter
from opentelemetry import trace
import os

from openinference.instrumentation.openai_agents import OpenAIAgentsInstrumentor


resource = Resource.create({"service.name": "<service_name>"})
provider = TracerProvider(resource=resource)
span_exporter = OTLPSpanExporter(
    endpoint= os.getenv("OTEL_EXPORTER_TRACES_ENDPOINT"),
    headers={"signoz-ingestion-key": os.getenv("SIGNOZ_INGESTION_KEY")},
)
processor = BatchSpanProcessor(span_exporter)
provider.add_span_processor(processor)
trace.set_tracer_provider(provider)

# Start instrumenting Temporal Agents
OpenAIAgentsInstrumentor().instrument()
<service_name>is the name of your serviceOTEL_EXPORTER_TRACES_ENDPOINT→ SigNoz Cloud trace endpoint with appropriate region:https://ingest.<region>.signoz.cloud:443/v1/tracesSIGNOZ_INGESTION_KEY→ Your SigNoz ingestion key
Using self-hosted SigNoz? Most steps are identical. To adapt this guide, update the endpoint and remove the ingestion key header as shown in Cloud → Self-Hosted.
Step 4: Setup Logs
import logging
from opentelemetry.sdk.resources import Resource
from opentelemetry._logs import set_logger_provider
from opentelemetry.sdk._logs import LoggerProvider, LoggingHandler
from opentelemetry.sdk._logs.export import BatchLogRecordProcessor
from opentelemetry.exporter.otlp.proto.http._log_exporter import OTLPLogExporter
import os

resource = Resource.create({"service.name": "<service_name>"})
logger_provider = LoggerProvider(resource=resource)
set_logger_provider(logger_provider)

otlp_log_exporter = OTLPLogExporter(
    endpoint= os.getenv("OTEL_EXPORTER_LOGS_ENDPOINT"),
    headers={"signoz-ingestion-key": os.getenv("SIGNOZ_INGESTION_KEY")},
)
logger_provider.add_log_record_processor(
    BatchLogRecordProcessor(otlp_log_exporter)
)
# Attach OTel logging handler to root logger
handler = LoggingHandler(level=logging.INFO, logger_provider=logger_provider)
logging.basicConfig(level=logging.INFO, handlers=[handler])

logger = logging.getLogger(__name__)
<service_name>is the name of your serviceOTEL_EXPORTER_LOGS_ENDPOINT→ SigNoz Cloud endpoint with appropriate region:https://ingest.<region>.signoz.cloud:443/v1/logsSIGNOZ_INGESTION_KEY→ Your SigNoz ingestion key
Using self-hosted SigNoz? Most steps are identical. To adapt this guide, update the endpoint and remove the ingestion key header as shown in Cloud → Self-Hosted.
Step 5: Setup Metrics
from opentelemetry.sdk.resources import Resource
from opentelemetry.sdk.metrics import MeterProvider
from opentelemetry.exporter.otlp.proto.http.metric_exporter import OTLPMetricExporter
from opentelemetry.sdk.metrics.export import PeriodicExportingMetricReader
from opentelemetry import metrics
from opentelemetry.instrumentation.system_metrics import SystemMetricsInstrumentor
import os

resource = Resource.create({"service.name": "<service-name>"})
metric_exporter = OTLPMetricExporter(
    endpoint= os.getenv("OTEL_EXPORTER_METRICS_ENDPOINT"),
    headers={"signoz-ingestion-key": os.getenv("SIGNOZ_INGESTION_KEY")},
)
reader = PeriodicExportingMetricReader(metric_exporter)
metric_provider = MeterProvider(metric_readers=[reader], resource=resource)
metrics.set_meter_provider(metric_provider)

meter = metrics.get_meter(__name__)

# turn on out-of-the-box metrics
SystemMetricsInstrumentor().instrument()
HTTPXClientInstrumentor().instrument()
<service_name>is the name of your serviceOTEL_EXPORTER_METRICS_ENDPOINT→ SigNoz Cloud endpoint with appropriate region:https://ingest.<region>.signoz.cloud:443/v1/metricsSIGNOZ_INGESTION_KEY→ Your SigNoz ingestion key
Using self-hosted SigNoz? Most steps are identical. To adapt this guide, update the endpoint and remove the ingestion key header as shown in Cloud → Self-Hosted.
📌 Note: SystemMetricsInstrumentor provides system metrics (CPU, memory, etc.), and HTTPXClientInstrumentor provides outbound HTTP request metrics such as request duration. If you want to add custom metrics to your Temporal application, see Python Custom Metrics.
Step 6: Set up environment variables
Create a .env file in your project root and add the following environment variables based on your Temporal deployment:
OPENAI_API_KEY=<your-openai-api-key>
TEMPORAL_ADDRESS=<local-temporal-server>
<local-temporal-server>is the location where your local Temporal server is hosted(default:localhost:7233)
OPENAI_API_KEY=<your-openai-api-key>
TEMPORAL_ADDRESS=<your-temporal-cloud-address>
TEMPORAL_NAMESPACE=<your-temporal-namespace-name>
TEMPORAL_API_KEY=<your-temporal-api-key>
TEMPORAL_TLS=true
Step 7: Run an example Temporal agent workflow
Ensure you have completed the steps above (traces, logs, and metrics configuration) before running this code. All OpenTelemetry instrumentation must be initialized first.
from __future__ import annotations
from dotenv import load_dotenv
import asyncio
import os
from temporalio import workflow
from temporalio.client import Client
from temporalio.worker import Worker
from temporalio.contrib.openai_agents import OpenAIAgentsPlugin
from temporalio.worker import UnsandboxedWorkflowRunner
from agents import Agent, Runner

load_dotenv()

@workflow.defn
class HelloWorldAgent:
    @workflow.run
    async def run(self, prompt: str) -> str:
        agent = Agent(
            name="Assistant",
            model="gpt-5",
            instructions="You only respond in haikus.",
        )

        result = await Runner.run(agent, input=prompt)
        return result.final_output

async def main():
    tls = os.environ.get("TEMPORAL_TLS", "").lower() in ("1", "true", "yes")
    api_key = os.environ.get("TEMPORAL_API_KEY")

    plugin = OpenAIAgentsPlugin()

    client = await Client.connect(
        target_host=os.environ.get("TEMPORAL_ADDRESS", "localhost:7233"),
        namespace=os.environ.get("TEMPORAL_NAMESPACE", "default"),
        api_key=api_key or None,
        tls=tls,
        plugins=[plugin]
    )

    worker = Worker(
        client,
        task_queue=os.environ.get("TEMPORAL_TASK_QUEUE", "openai-agents-task-queue"),
        workflows=[HelloWorldAgent],
        workflow_runner=UnsandboxedWorkflowRunner()
    )

    async with worker:
        handle = await client.start_workflow(
            HelloWorldAgent.run,
            id="hello-world-workflow-01",
            task_queue=os.environ.get("TEMPORAL_TASK_QUEUE", "openai-agents-task-queue"),
            args=["Tell me about SigNoz"],
        )
        result = await handle.result()
        print("\nWorkflow result:\n", result)

asyncio.run(main())
Before running this code, ensure that you have set the environment variable OPENAI_API_KEY with your generated API key.
View Temporal Traces, Logs, and Metrics in SigNoz
Once configured, your Temporal application automatically emits traces, logs, and metrics.
Temporal traces are available in SigNoz under the Traces tab:

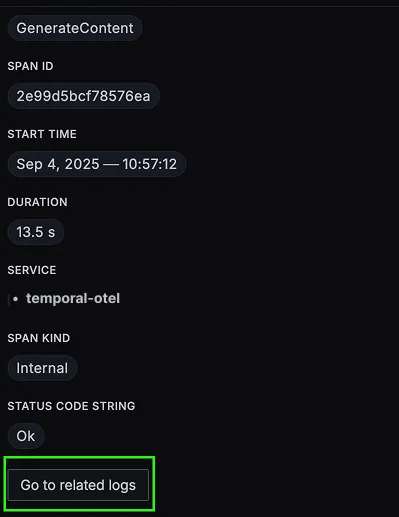
When you click on a trace in SigNoz, you'll see a detailed view of the trace, including all associated spans, along with their events and attributes.

Temporal logs are available in SigNoz under the Logs tab. Click the Related Logs button in the trace view to see correlated logs:

When you click on any of these logs in SigNoz, you'll see a detailed view of the log, including attributes:

Temporal metrics are available in SigNoz under the Metrics tab:

When you click on any of these metrics in SigNoz, you'll see a detailed view of the metric, including attributes:

If you're using Temporal Cloud, you can also monitor cloud-specific metrics. For detailed information on setting up Temporal Cloud metrics monitoring, see the Temporal Cloud Metrics integration guide.
Temporal Cloud metrics are available in SigNoz under the Metrics tab:

When you click on any of these Temporal Cloud metrics in SigNoz, you'll see a detailed view of the metric, including attributes:

Troubleshooting Temporal Observability
If you don't see your telemetry data:
- Verify network connectivity - Ensure your application can reach SigNoz Cloud endpoints
- Check ingestion key - Verify your SigNoz ingestion key is correct
- Wait for data - OpenTelemetry batches data before sending, so wait 10-30 seconds after making API calls
- Try a console exporter - Enable a console exporter locally to confirm that your application is generating telemetry data before it’s sent to SigNoz
Temporal Observability Dashboard
The Temporal dashboard template provides pre-built visualizations for monitoring Temporal workflow performance, agent execution patterns, and resource usage in SigNoz. Import it directly to get started without manual chart configuration.

Additional resources:
- Set up alerts for high latency or error rates
- Learn more about querying traces
- Explore log correlation
