How to Calculate 95th Percentile of an average in Prometheus - A Step-by-Step Guide
When monitoring system performance, the 95th percentile is a powerful metric, often preferred over averages for highlighting performance for the vast majority of users, while minimizing the impact of extreme outliers. But what if you want to focus on both? This guide will walk you through calculating this metric using Prometheus and PromQL, specifically focusing on how to find the 95th percentile of an average—such as the average HTTP response time experienced by 95% of your users.
Understanding Percentiles in Prometheus
A percentile is a way to understand how a value compares to other values in a set of data.
For example, if you score in the 90th percentile on a test, it means you did better than 90% of the people who took the test, and only 10% scored higher than you. Percentiles divide data into 100 equal parts, so each percentile represents 1% of the data.
In simpler terms, the N-th percentile is the value below which N% of the data falls. In the context of Prometheus, percentiles help you understand the distribution of your data and identify outliers.
Average vs Percentile
Imagine you have a system that tracks HTTP response times in milliseconds for 10 requests:
Response Times:
100ms, 110ms, 120ms, 130ms, 140ms, 150ms, 500ms, 1000ms, 1500ms, 2000ms
Average (Mean):
The average response time is calculated by summing all the times and dividing by the number of requests:
(100 + 110 + 120 + 130 + 140 + 150 + 500 + 1000 + 1500 + 2000) / 10 = 575ms95th Percentile:
The 95th percentile is calculated by sorting the response times in ascending order and finding the value below which 95% of the requests fall.
100ms, 110ms, 120ms, 130ms, 140ms, 150ms, 500ms, 1000ms, 1500ms, 2000msWith 10 data points, we calculate the 95th percentile as 0.95 * 10 = 9.5, which rounds down to the 9th value for percentile calculations. Therefore, the 95th percentile is 1500ms, meaning 95% of the requests have a response time at or below 1500ms.
Key Difference:
- The average gives a general idea of overall performance but can be skewed by large outliers (like 2000ms).
- The 95th Percentile focuses on the upper boundary of performance for 95% of users, ignoring extreme outliers, making it more actionable for identifying common performance issues.
Why the 95th Percentile?
The 95th percentile represents the value below which 95% of your data points fall. It's particularly useful for:
- Identifying Performance Bottlenecks: It helps you spot performance issues that might affect a small but noticeable portion of users, particularly those on the higher end of latency or slower request times.
- Setting Realistic Service Level Objectives (SLOs): By focusing on the 95th percentile, you can set SLOs that reflect the experience of the majority of users, balancing between customer satisfaction and operational efficiency.
- Detecting Anomalies: The 95th percentile can help in identifying anomalies or unusual system behavior, such as a sudden spike in response times that might only affect a small percentage of requests.
How Prometheus Handles Percentiles
Prometheus uses histograms and summaries to calculate percentiles. Histograms collect data into predefined buckets, while summaries provide quantile calculations directly. Each approach has its pros and cons in terms of flexibility and resource efficiency.
Histograms vs. Summaries in Prometheus
- Histograms: Better for server-side calculations and long-term storage.
- Summaries: More lightweight but perform client-side quantile calculations, so they can be less flexible when aggregated across multiple instances.
Why Calculate the 95th Percentile of an Average?
In Prometheus, calculating the 95th percentile of an average is valuable because it provides a more balanced view of system performance than averages alone. Here’s why this approach matters:
- Outlier Detection:
- Averages can hide spikes or outliers in performance data, making your system seem more stable than it is.
- The 95th percentile focuses on the upper limit of your most common performance, highlighting performance issues that affect a smaller percentage of users, such as the slowest requests or the highest resource consumption.
- Balancing Trends with Exceptions:
- By combining the 95th percentile with the average (like response times), you can track long-term trends while also monitoring worst-case scenarios for most users.
- For example, rather than just looking at average HTTP response times, using the 95th percentile allows you to see where the slowest 5% of responses fall, giving you more actionable data.
- SLA Compliance: Many service-level agreements (SLAs) are based on percentiles like the 95th or 99th percentile to ensure that most users have a good experience, even though some small percentage might experience slower performance.
- Detecting Performance Degradation: Calculating the 95th percentile of an average metric, such as response time or memory usage, allows you to detect gradual performance degradation in the worst-performing parts of your system. This makes it easier to take proactive steps before larger problems arise.
However, be aware that this metric can be sensitive to extreme outliers and may not always reflect the typical user experience.
Step-by-Step Guide: Calculating 95th Percentile in Prometheus
To calculate the 95th percentile of an average in Prometheus, follow these steps:
Before calculating the 95th percentile, ensure that your application is exposing the correct metrics. For percentile calculations, you can use either histograms or summaries.
1. Using the quantile() Function for Percentile Calculation
Summaries: If you’re using summaries, retrieving the 95th percentile is straightforward:
quantile(0.95, http_requests_total)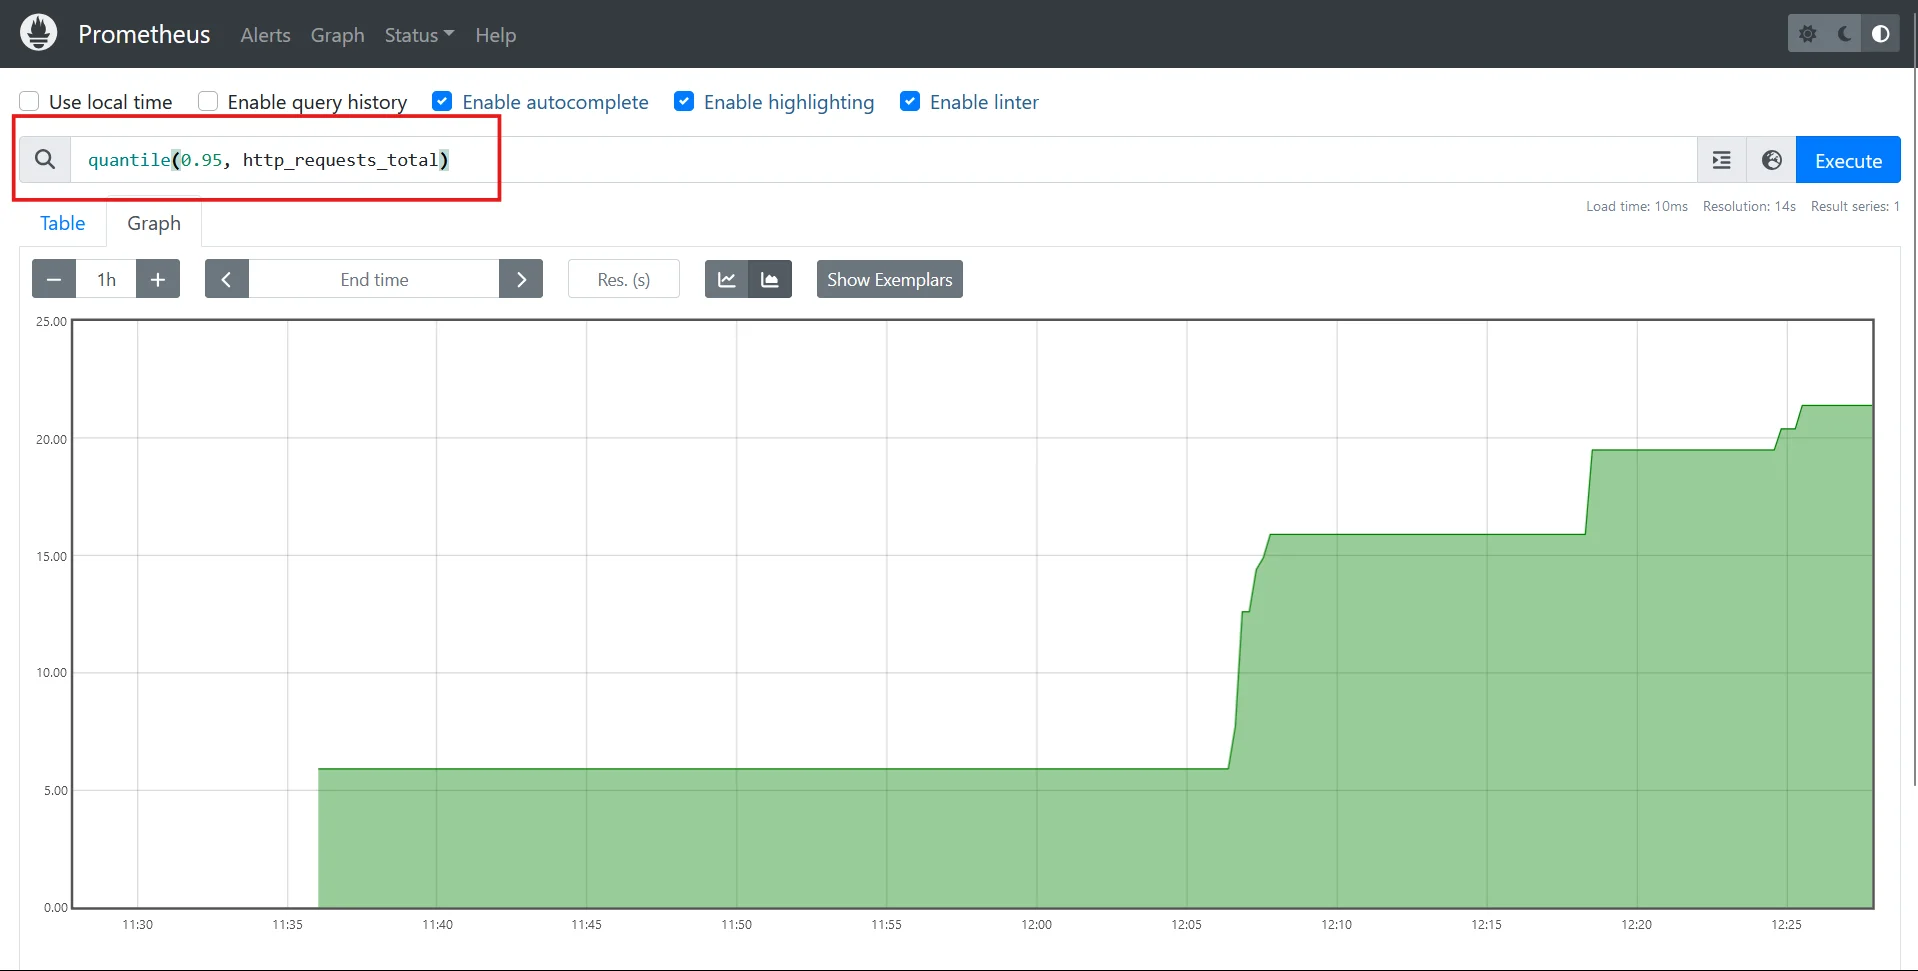
Using quantile() Histograms: For histograms, you can use the
histogram_quantile()function. This function estimates the desired quantiles based on the bucket counts:histogram_quantile(0.95, rate(http_request_duration_seconds_bucket[5m]))This query calculates the 95th percentile of HTTP request durations over the last 5 minutes.

Using histogram_quantile() in table view 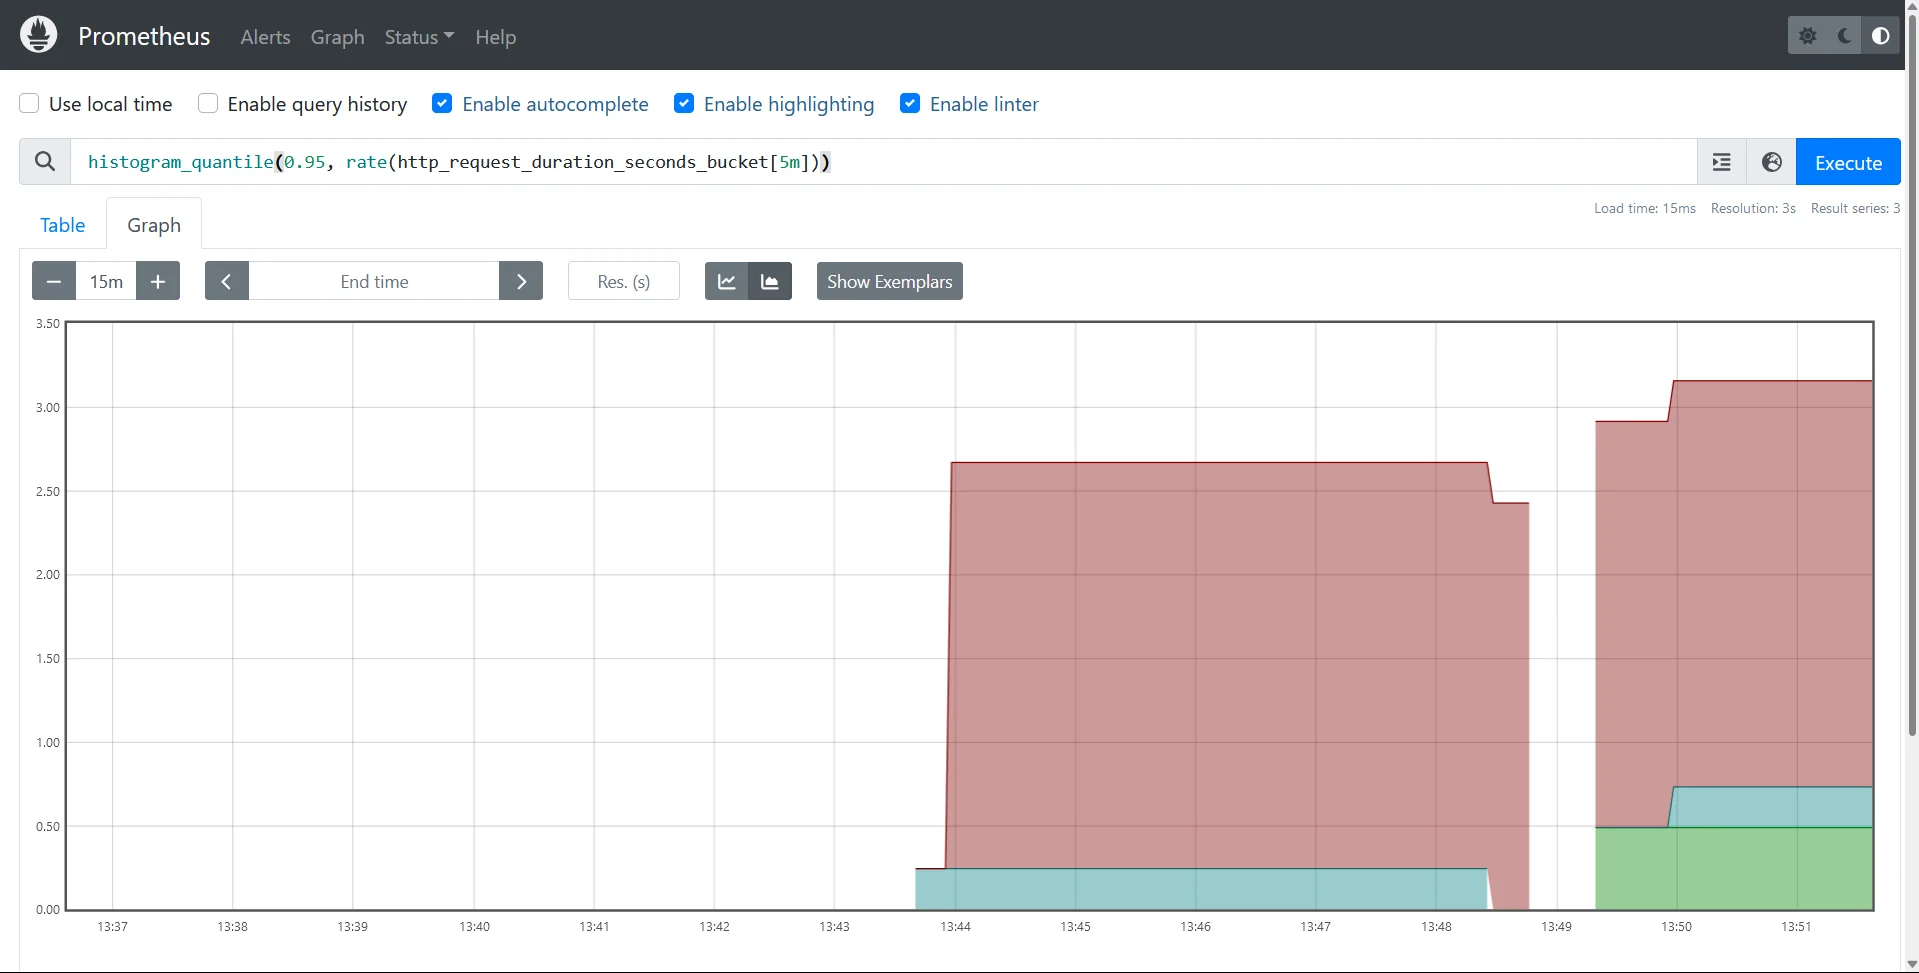
Using histogram_quantile() in graph view
2. Combining avg() and quantile() Functions for Average Percentiles
To find the 95th percentile of average response times, you can combine the avg() function with quantile(). This approach allows you to assess the maximum average HTTP response time experienced by users. Use the following query:
quantile(0.95, avg by (endpoint) (rate(http_request_duration_seconds_sum[5m]) / rate(http_request_duration_seconds_count[5m])))
Here’s a breakdown of the query:
avg by (endpoint) (rate(http_request_duration_seconds_sum[5m]) / rate(http_request_duration_seconds_count[5m])): This part calculates the average response time for eachendpointover the last 5 minutes.quantile(0.95, ...): This function then takes those averages and computes the 95th percentile.
This query provides insights into how response times vary across different web identifiers, helping you identify potential performance issues.

3. Handling Time Ranges and Aggregation in Your Queries
Prometheus allows you to apply percentile calculations over specific time ranges, providing flexibility in your analysis. For example:
5-Minute Window:
histogram_quantile(0.95, rate(http_request_duration_seconds_bucket[5m]))1-Hour Window:
histogram_quantile(0.95, rate(http_request_duration_seconds_bucket[1h]))
Handling Time Ranges and Aggregation
Optimizing Query Performance for Large Datasets
Query performance can be a significant concern when handling large datasets. Here are strategies to improve efficiency:
- Efficient Use of
rate(): Ensure you choose appropriate time windows when calculating rates. Shorter intervals can help reduce the amount of data processed. - Reduce Cardinality: Limit the number of unique label values to avoid high cardinality, which can slow down queries significantly.
- Pre-Aggregation: Consider aggregating metrics at the application level if certain metrics are queried frequently. This reduces the processing load on Prometheus.
Best Practices for Naming and Labeling Metrics for Percentile Analysis
Clear naming conventions and effective labeling are essential for successful monitoring and querying:
- Consistent Metric Names: Establish a standard naming convention for your metrics (e.g.,
http_request_duration_seconds) to make them easily identifiable. - Descriptive Labels: Use labels like
method,endpoint, andstatus_codeto provide context. This enhances filtering capabilities and granularity in analysis. - Avoid Over-Labeling: While additional labels can offer context, excessive labeling can lead to high cardinality issues. Use labels judiciously for optimal performance.
- Documentation: Keep thorough documentation for your metrics, including their purpose and relevant labels, to facilitate easier understanding and usage among team members.
Visualizing the 95th Percentile of an Average with Grafana
Grafana is an excellent tool for visualizing Prometheus data, including percentiles. Here's how to create effective dashboards:
Connect Grafana to your Prometheus data source.
- In Grafana, visit the “Data sources” section, and click on the
+ Add new data sourcebutton
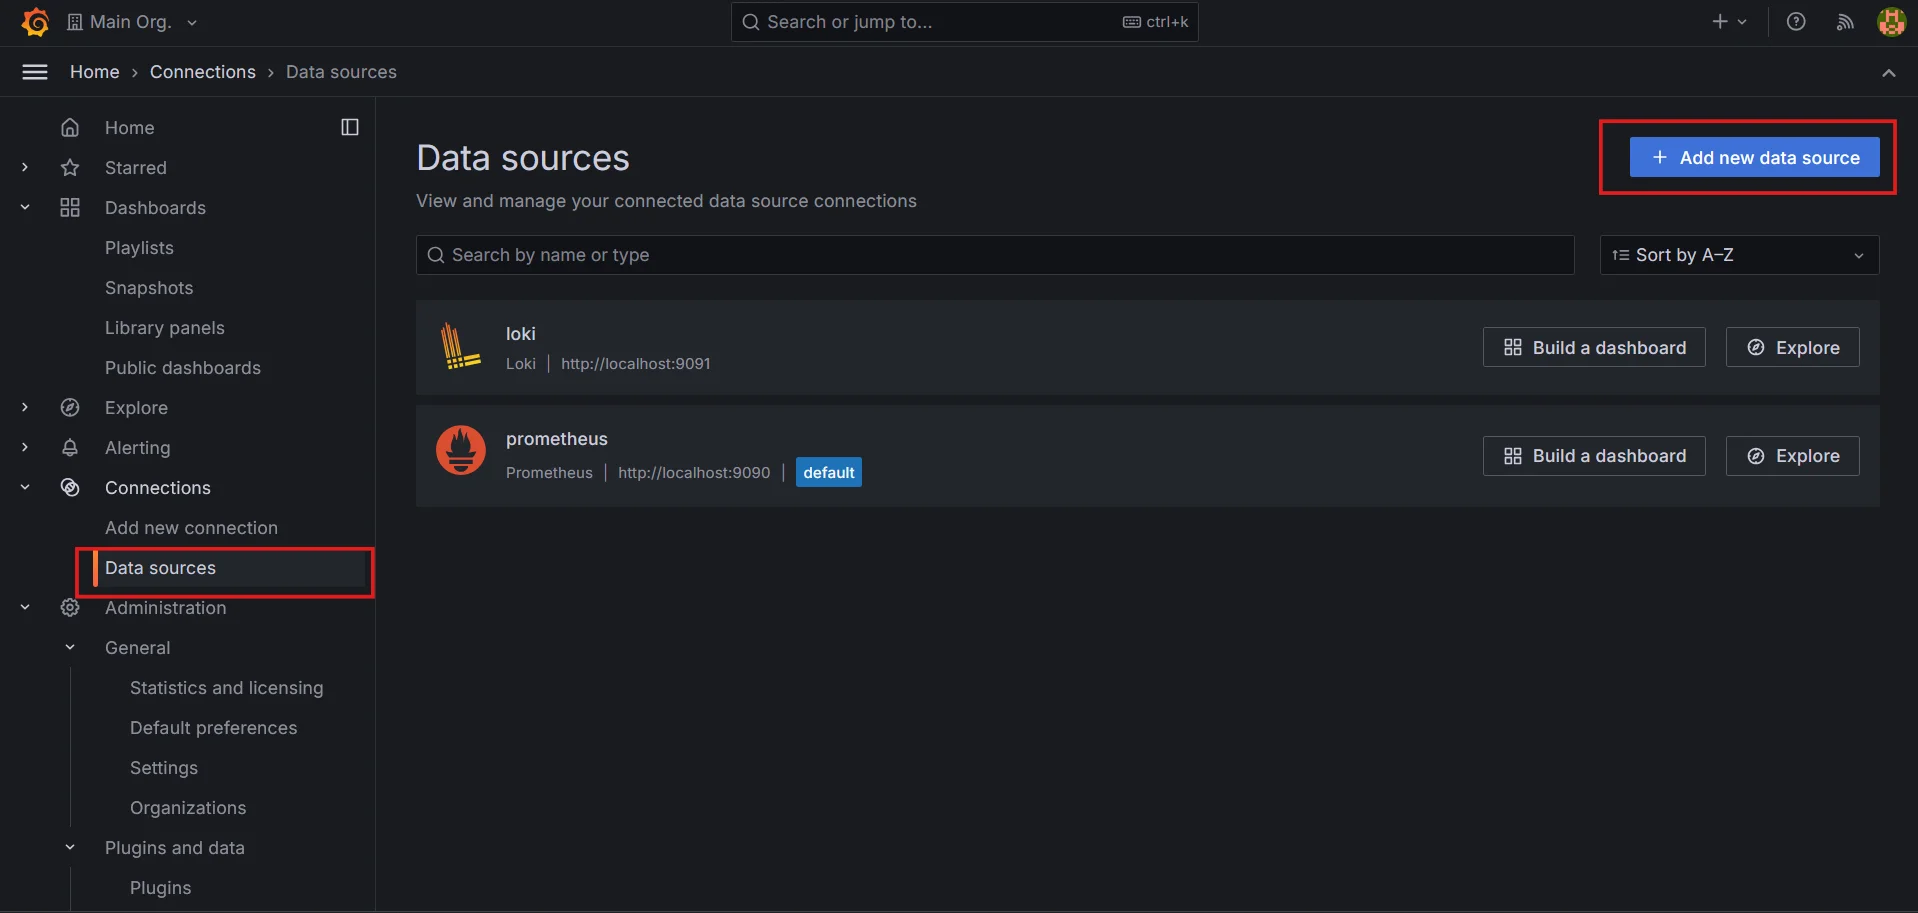
Create new data souce in Grafana - Select
Prometheusas the data source
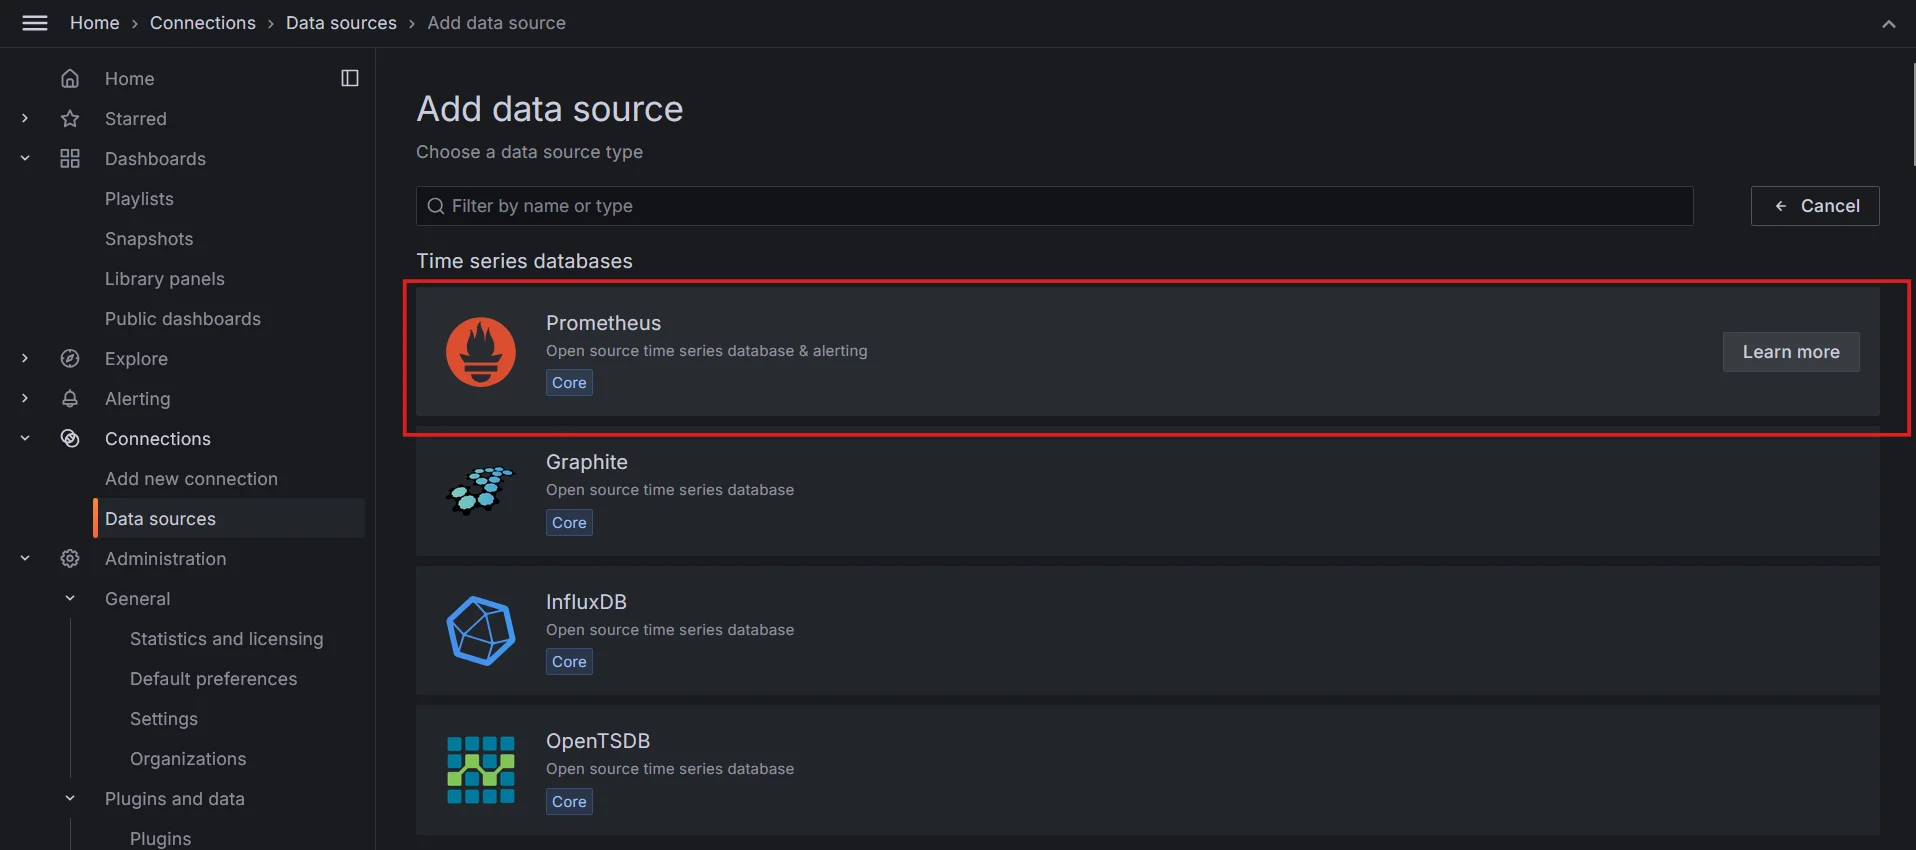
Selecting Prometheus as the data source - Update the name and URL and save the data source.
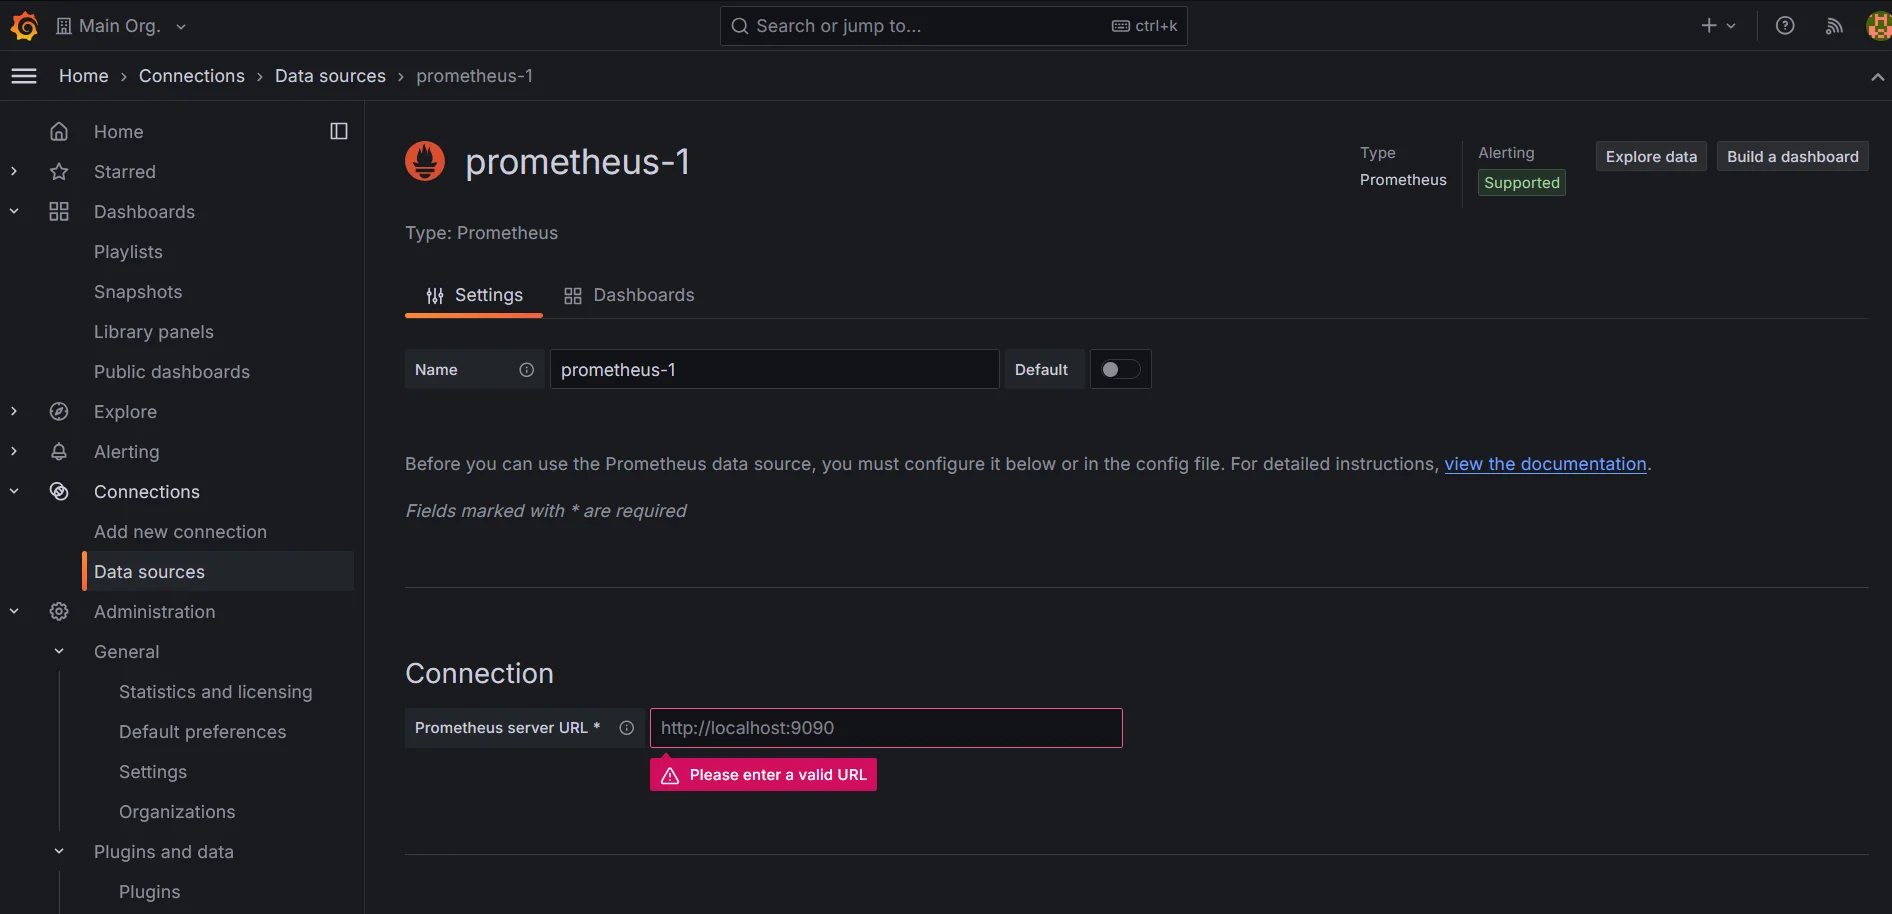
Specifying data source details - In Grafana, visit the “Data sources” section, and click on the
Create a new dashboard and add a panel.
Visit the
Dashboardssection and click on theNewbutton.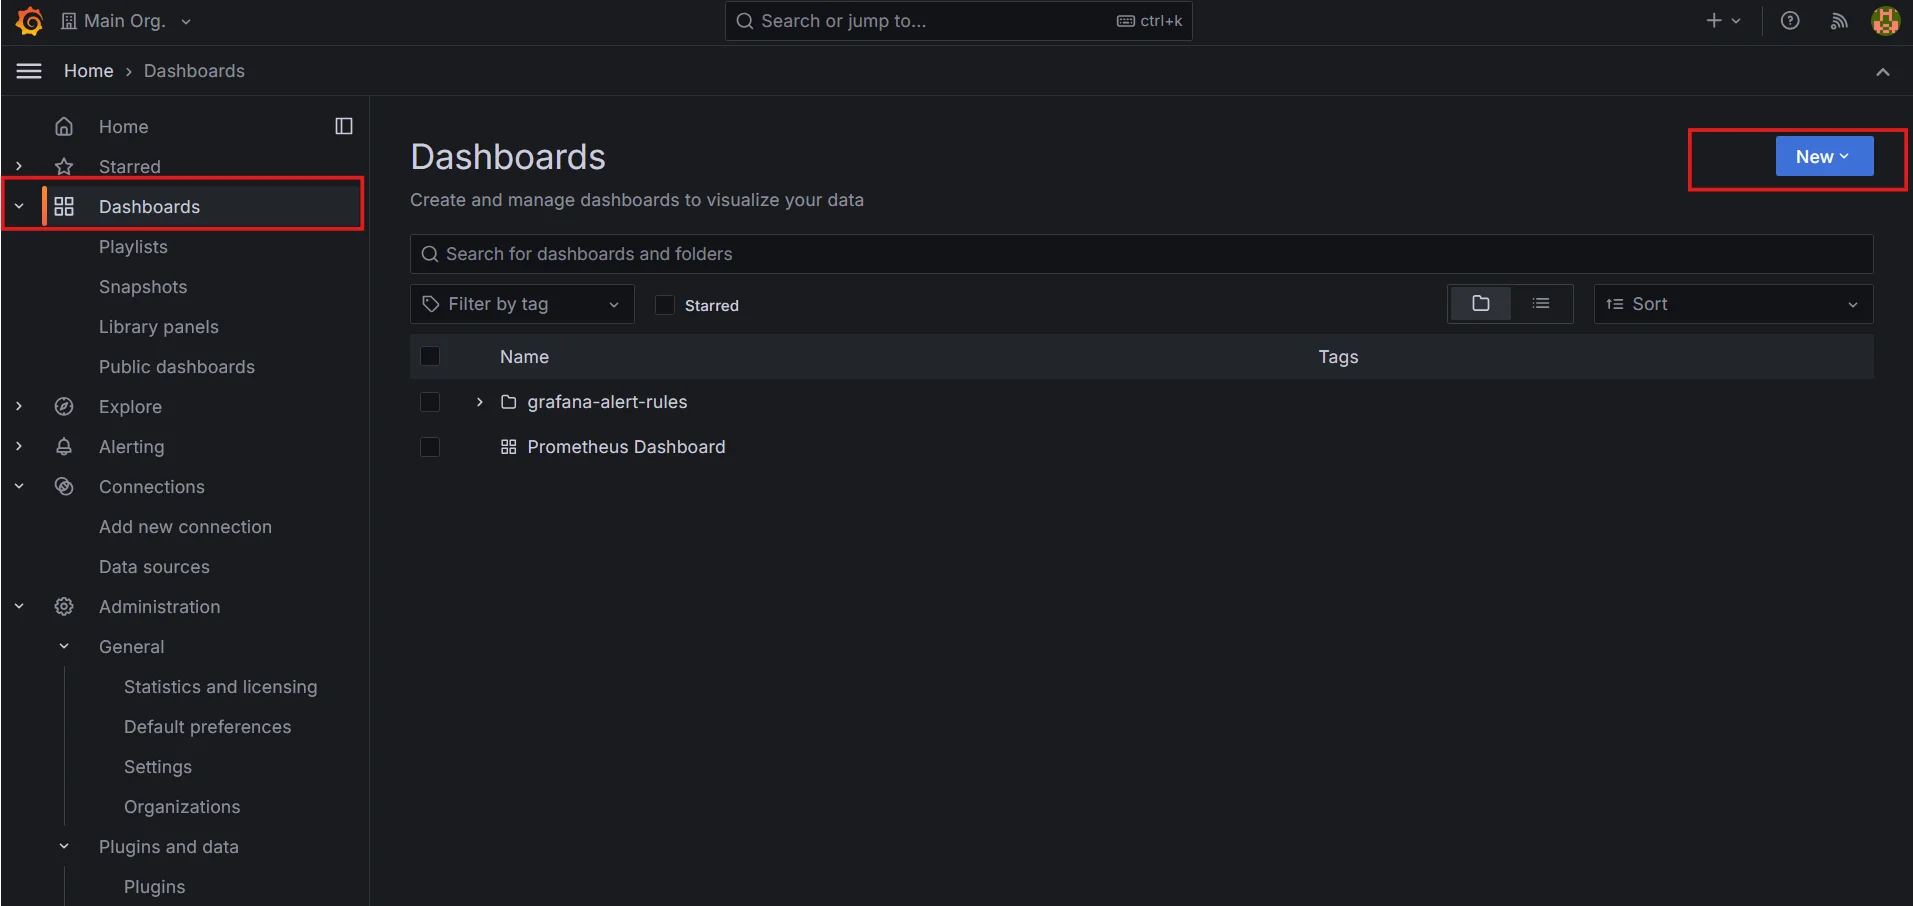
Creating new dashboards Add
New Dashboardand click theAdd visualizationbutton.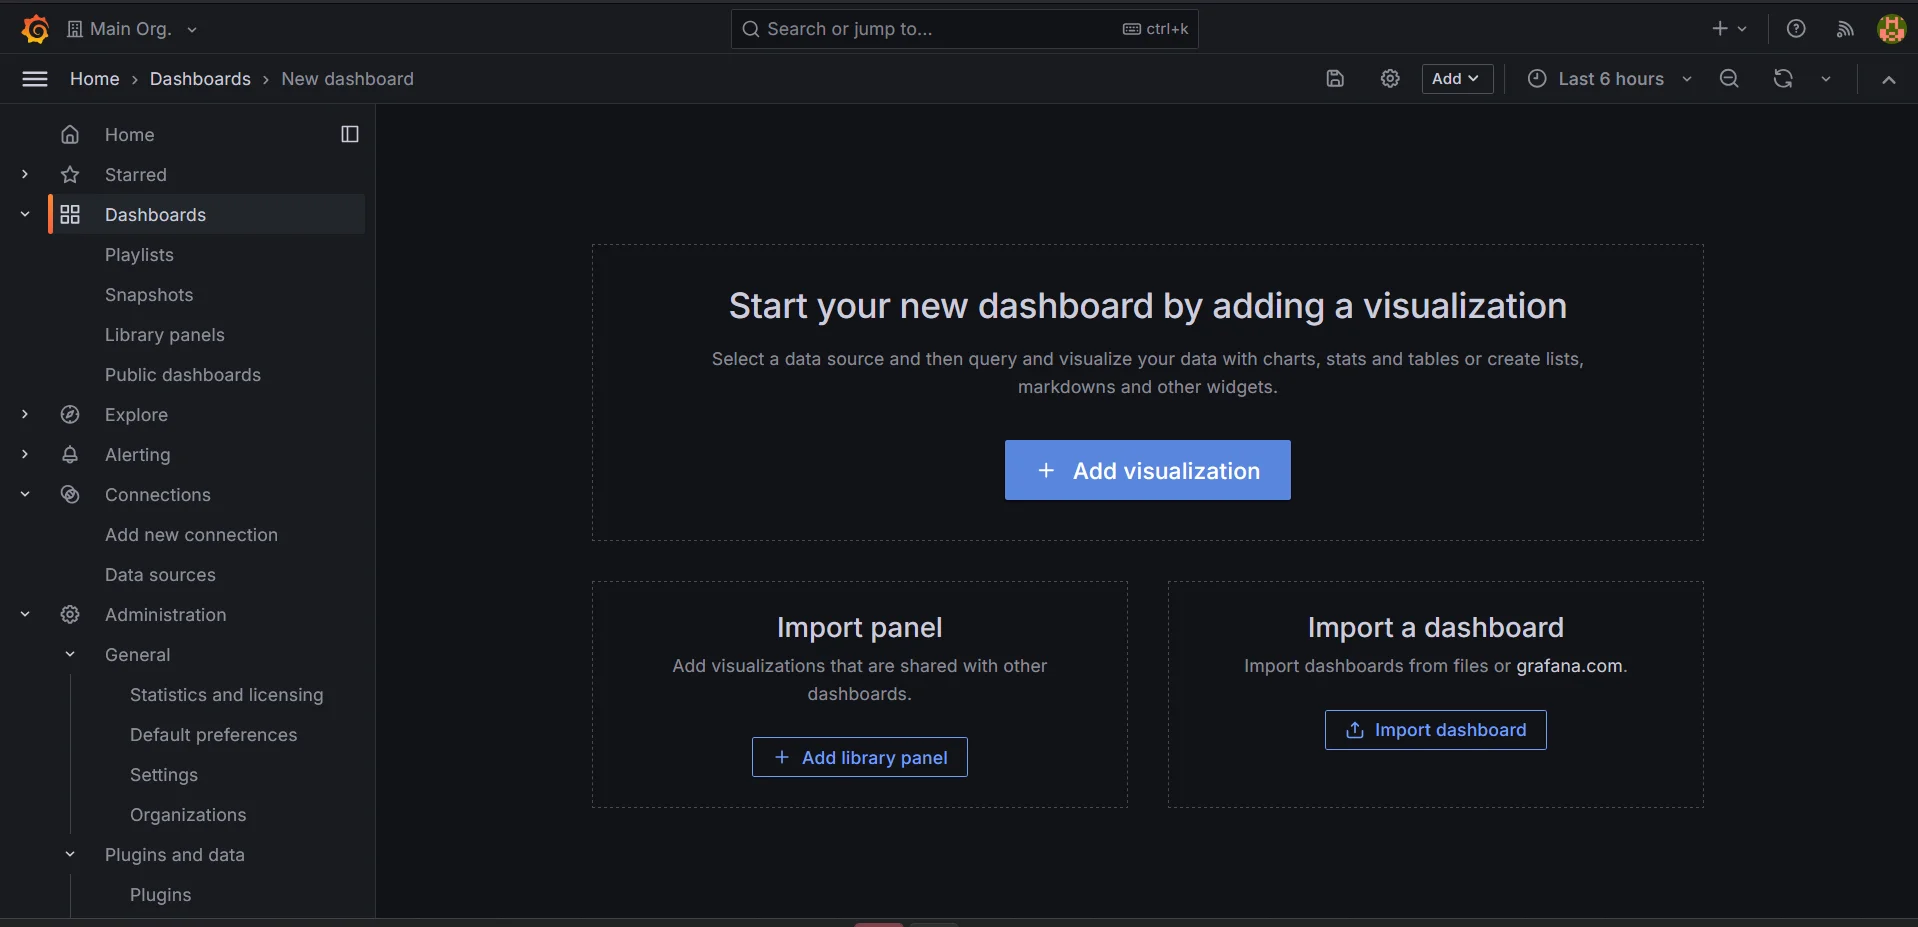
Adding visualization Select the data source created
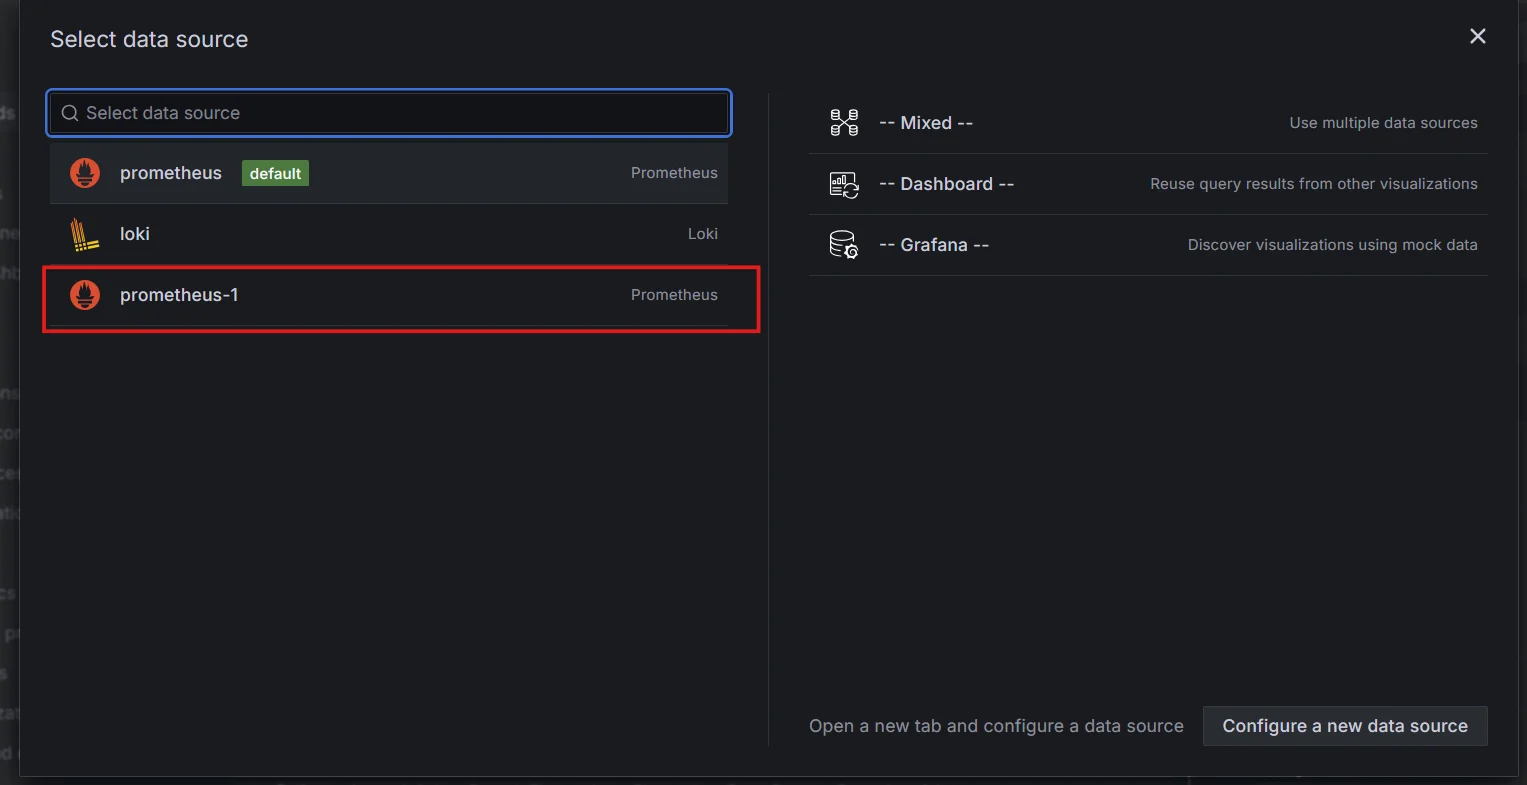
Selecting the datasource
Use PromQL to query your average of 95th percentile data.
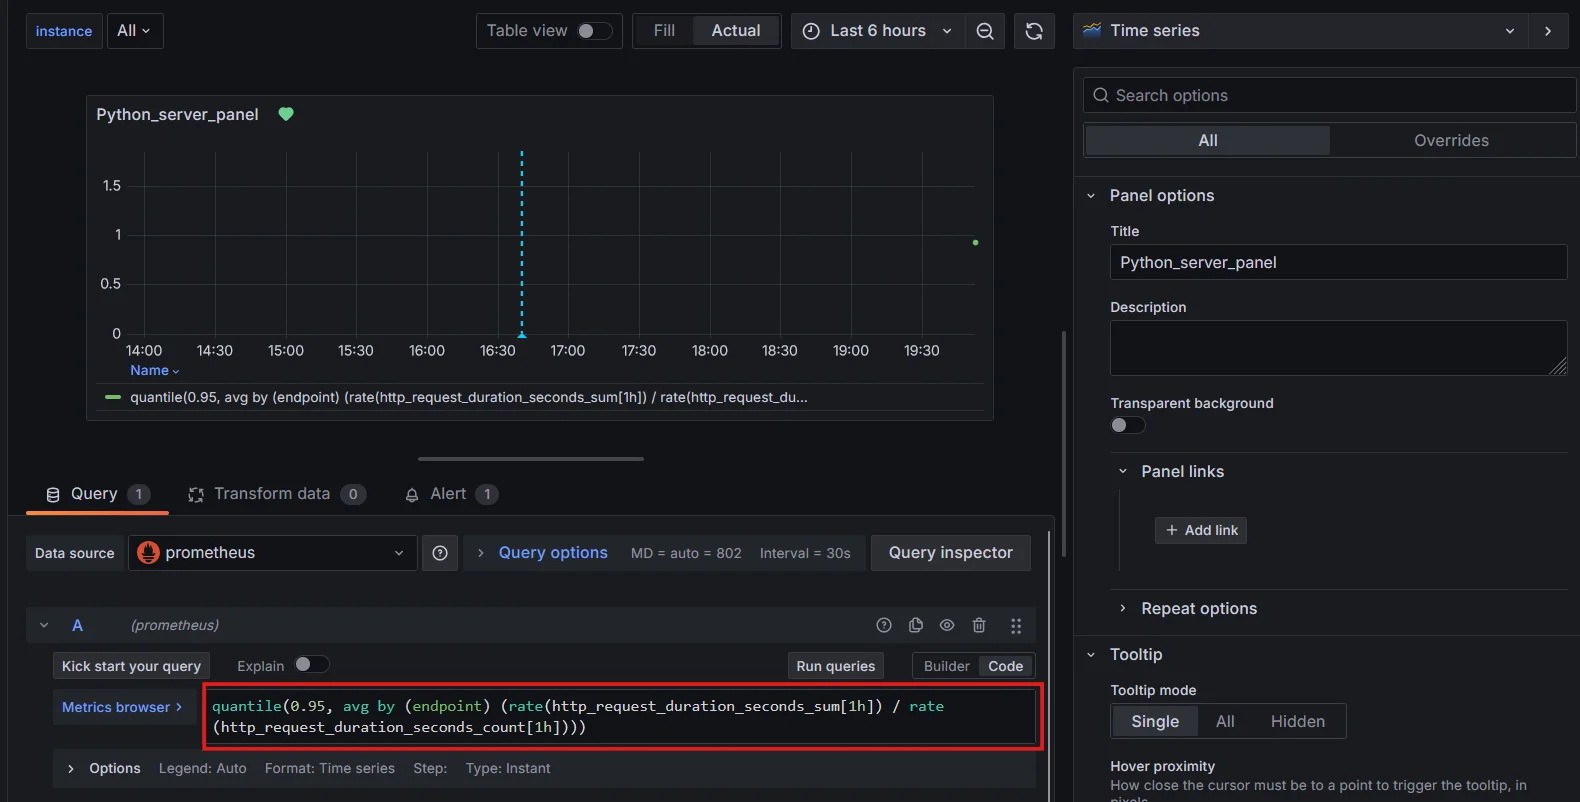
Using PromQL to query average of 95th percentile data. Choose appropriate visualization types—line charts or gauge work well for tracking average of percentiles over time.
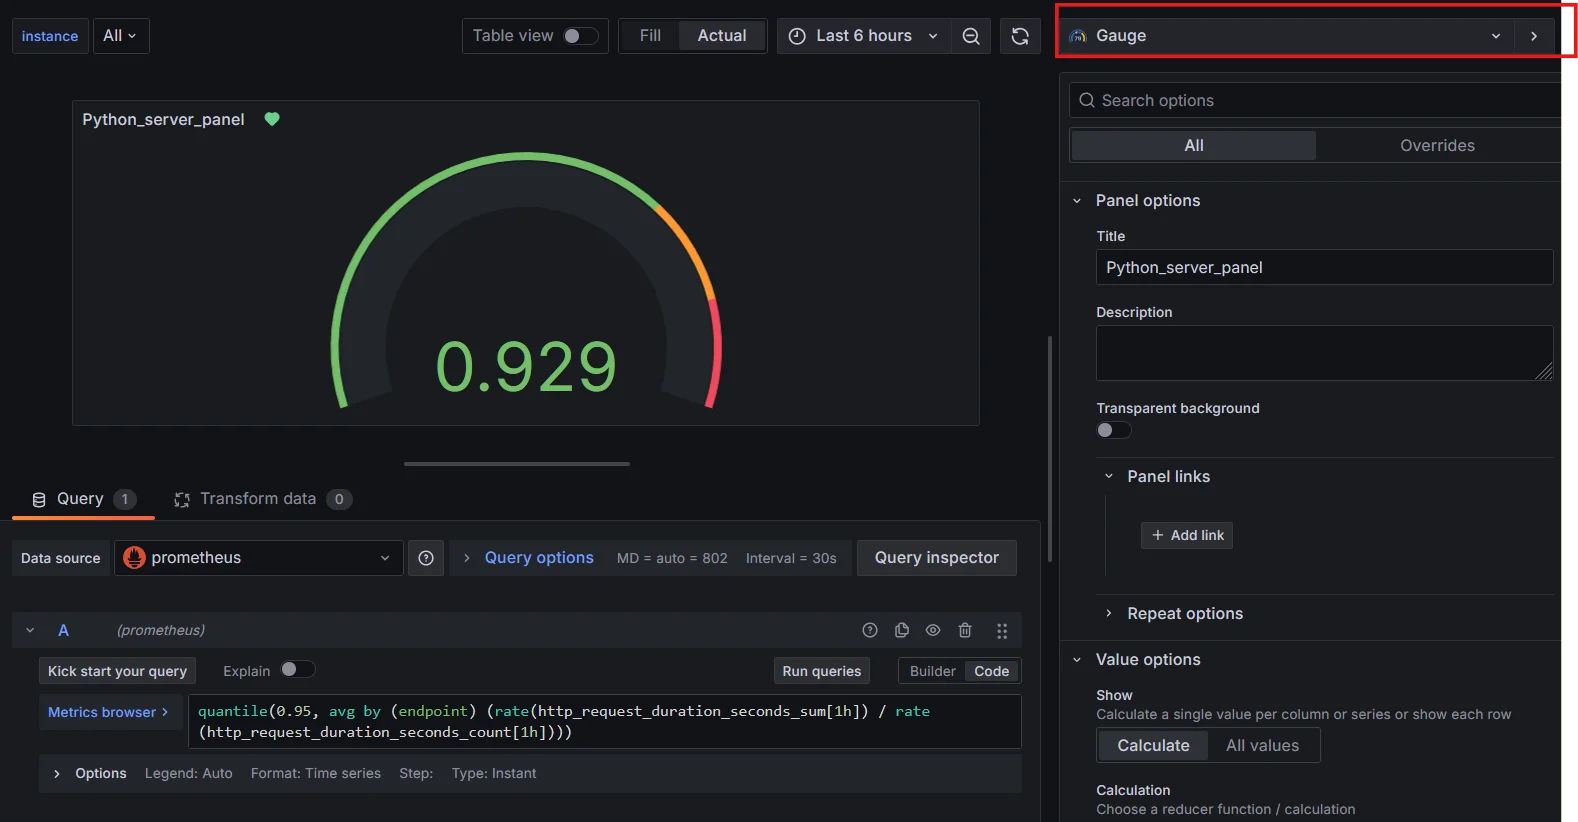
Choosing appropriate visualization type
Common Challenges and Troubleshooting
When working with percentiles, you might encounter these challenges:
- Data Skew: Extreme outliers can significantly impact percentiles. Consider using trimmed means or winsorization to mitigate this.
- Missing Data: Gaps in your data can affect percentile calculations. Ensure your data collection is reliable and consider how to handle missing data points.
- High Cardinality: Too many unique time series can slow down queries. Use label selectors and aggregation to reduce cardinality.
Enhancing Observability with SigNoz
While Prometheus is powerful, tools like SigNoz can simplify percentile calculations and visualization. SigNoz offers:
Built-in Advanced Percentile Calculations: SigNoz effortlessly calculates and displays various percentile metrics, such as p50, p90, and p99.
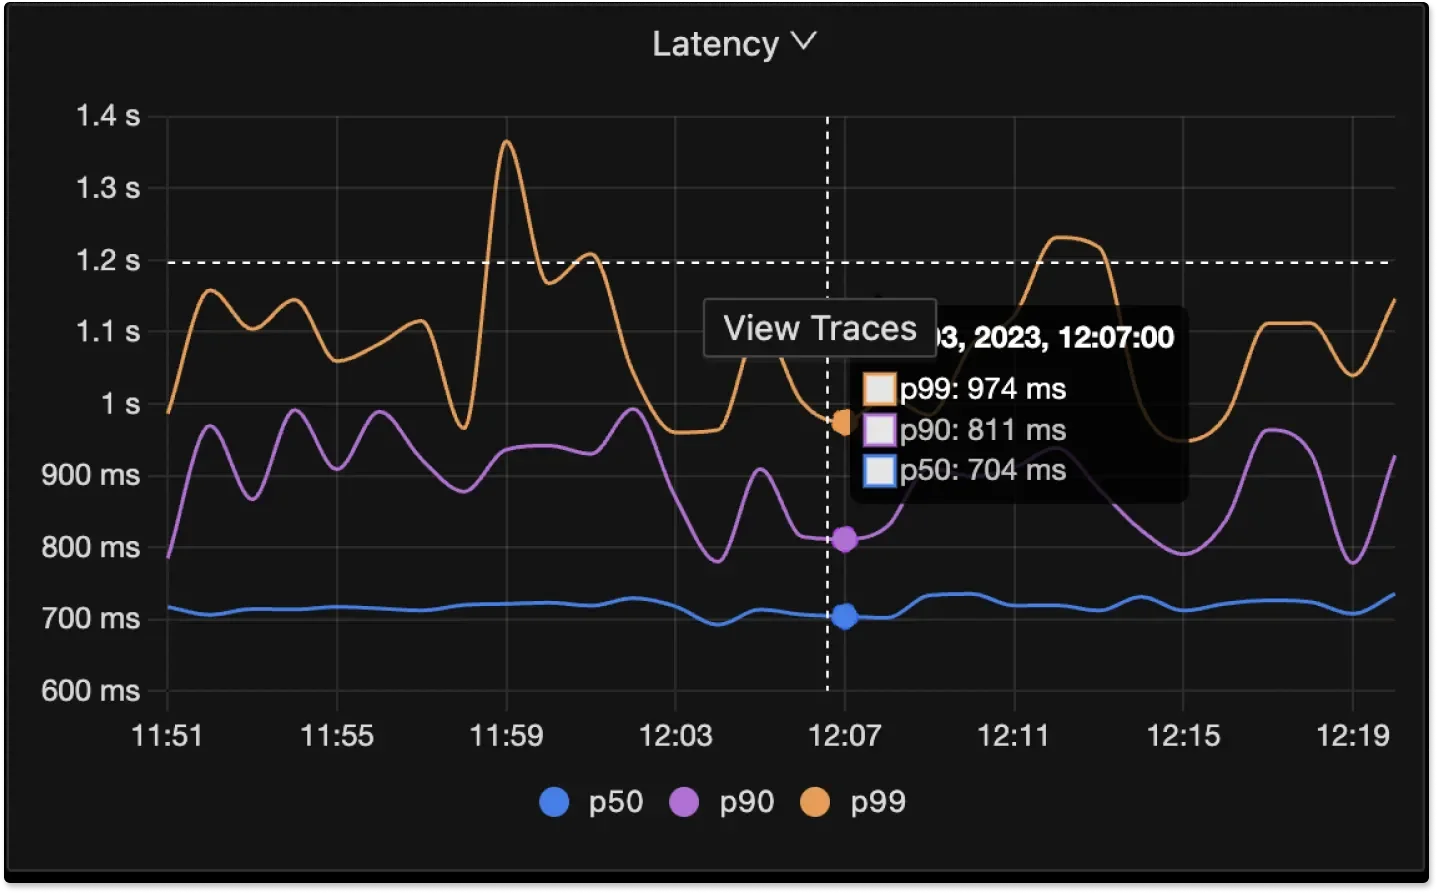
SigNoz Built-in percentile calculations User-Friendly Dashboards: Visualize performance metrics with intuitive dashboards that make data interpretation straightforward.
Integration with Tracing Data: Gain deeper insights through the integration of tracing data, allowing for more comprehensive performance analysis.
SigNoz Cloud is the easiest way to run SigNoz. Sign up for a free account and get 30 days of unlimited access to all features.
You can also install and self-host SigNoz yourself since it is open-source. With 24,000+ GitHub stars, open-source SigNoz is loved by developers. Find the instructions to self-host SigNoz.
SigNoz provides a more user-friendly interface for working with percentiles, making it easier to gain insights from your data without complex PromQL queries.
Key Takeaways
- The 95th percentile helps identify performance issues affecting a small but significant portion of requests.
- Prometheus offers multiple methods for calculating percentiles, each with its own trade-offs.
- Combining averages with percentiles provides a more comprehensive view of your system's performance.
- Tools like Grafana and SigNoz can enhance your ability to work with and visualize percentile data.
- Proper metric setup and query optimization are crucial for accurate and efficient percentile analysis.
FAQs
What's the difference between histograms and summaries in Prometheus?
Histograms allow server-side percentile calculations and are flexible for aggregating across multiple series. Summaries provide accurate client-side percentile calculations but lack aggregation capabilities.
How can I improve the accuracy of my 95th-percentile calculations?
Use histogram_quantile() with appropriately sized buckets, and consider increasing the number of buckets for finer granularity.
Is it possible to calculate percentiles across multiple time series?
Yes, you can use aggregation functions like sum() or avg() in combination with histogram_quantile() to calculate percentiles across multiple series.
How do I choose between client-side and server-side percentile calculations?
Choose client-side (summaries) for higher accuracy and lower query load, or server-side (histograms) for more flexibility and the ability to aggregate across multiple series.
