Observability vs. Visibility - Key Differences and Why They Matter
Site Reliability Engineers (SREs) and developers need more than basic monitoring – they require deep insights into system behavior. This is where observability comes in.
Observability goes beyond traditional visibility or monitoring by enabling teams to not only see that something is wrong, but understand why and where it’s wrong in real time.
In the sections below, we’ll explore what observability and visibility mean, how they differ, and why observability has become essential for ensuring reliability and performance in modern systems.
Observability vs. Visibility
Visibility generally refers to the ability to see into a system’s operations using available data (metrics, logs, etc.). It is often retrospective – you gather predefined metrics or logs and detect when something has gone wrong.
For example, a basic network monitor might show that a server’s CPU spiked or that an error log was recorded, indicating an issue. Visibility asks “What information do we have, and does it show something is wrong?” and is typically associated with traditional monitoring tools and dashboards.
Observability, on the other hand, is a more holistic property of a system. It is the ability to infer the internal state of the system based on its external outputs (telemetry data such as logs, metrics, traces, etc.) Observability is about having context and the capacity to explore unknown issues. It asks
“What data do we need to understand why the system is behaving this way?”
and enables active investigation of problems that were not predefined. In practice, observability means correlating data from across the stack (applications, infrastructure, network) to explain why an anomaly occurred, not just flag that it happened. While visibility might tell you something is down , observability helps you pinpoint why it’s down and what to do next.
TLDR;
- Visibility – focuses on known conditions and predefined measurements (often reactive; e.g. “Alert: CPU > 90%”). It tells you when something failed.
- Observability – provides insight into unknown or complex conditions by analyzing all telemetry in context (proactive and investigative; e.g. “Service X is slow because calls to Service Y are timing out due to a bad deploy”). It helps you understand why something failed.
A helpful analogy from industry compares monitoring/visibility to just hearing an alarm vs. observability to listening and understanding the full situation. Visibility gives a signal, while observability gives you the story.
Key Components of Observability (and Visibility)
Both observability and traditional visibility rely on gathering data from systems. The core data components – often called the “three pillars” of observability – are metrics, logs, and traces, all of which fall under the umbrella of telemetry. Below we define each and how they contribute to understanding system state:
Metrics
Numerical measurements that reflect the performance or health of a system over time. Metrics are typically time-series data points – for example, CPU usage, request throughput, memory consumption, error rate, etc.
Metrics are great for high-level monitoring and alerting (e.g. a spike in latency or error count). They provide a quantifiable pulse of your system at a glance. However, metrics alone may lack detail for root cause analysis (they show that a problem exists but not always the full context). Metrics are the first clue that something might be wrong (e.g. high latency, increased error rate)
Logs
Immutable, timestamped records of discrete events that happened in the system. Logs can be structured (like JSON events) or unstructured text, and they contain details about specific events or errors (stack traces, messages, user IDs, etc.).
Logs are essential for drilling into what happened at a particular time – they answer the “who, what, when, where” of an event. Traditional visibility heavily relies on log files for troubleshooting after an incident. Logs provide rich context but can be voluminous and hard to analyze in isolation. In context, logs help explain why something happened by providing error details or state information leading up to an issue.
Traces
Traces represent the end-to-end path of a single request or transaction through a distributed system. A trace is composed of spans, each span representing a unit of work (e.g. a service call, a database query) along that request’s journey.
Distributed tracing is key to observability in microservices and cloud-native architectures – it allows you to follow a user request as it hops through multiple services and see where delays or errors occur. Traces visualize the flow and timing across components, making it easier to pinpoint bottlenecks or failing interactions. Traditional monitoring usually lacked this cross-service visibility. Traces tell you where a problem occurred across a workflow (e.g. which service or call in the chain is slow or failing)
Telemetry & Events
The term telemetry encompasses all the data signals emitted by systems – metrics, logs, traces, and also events.
Events can include things like deploys, configuration changes, or security alerts. Modern observability often references MELT data: Metrics, Events, Logs, and Traces. These are the raw materials of observability. A robust observability setup will collect telemetry from across the stack (applications, infrastructure, network, etc.). The key difference is that observability platforms correlate and analyze this telemetry together, rather than examining each data type in a silo.
Why combine these?
Because each of the three pillars offers a different viewpoint. When you layer them, you get a much clearer picture. For example, an increase in an error-rate metric might alert you to a problem, a trace can show which service in a workflow is throwing those errors, and the logs from that service will reveal the exact error message or exception causing failures. Correlating metrics, logs, and traces gives a holistic view that is essential for troubleshooting complex issues.
Metrics indicate that there is an issue, traces show where in the system it is, and logs explain why it happened.
Use Cases: How Observability Adds Value Over Basic Visibility
To make this more concrete, let’s look at scenarios where observability provides clear advantages over traditional visibility:
Debugging Microservices in Production
Imagine a user-facing application composed of dozens of microservices.
A user action (like placing an order) might invoke a chain of service calls (user service → order service → inventory service → payment service, etc.). If the user’s order fails or is slow, traditional monitoring might show an error count increment on the front-end service or a generic “500 error” log.
But which service in the chain caused it?
With observability, SREs can pull up a distributed trace for that request and see the entire call graph. For instance, the trace might reveal that the inventory service took 3 seconds to respond, delaying the whole request. Drilling into inventory service logs could then show a database timeout error.
This end-to-end view drastically reduces debugging time. Teams at Netflix, Google, etc., rely on tracing to debug production issues that span multiple services – something basic metrics would not easily reveal.
Anomaly Detection and Outage Prevention
Observability can catch anomalies that basic monitoring might overlook.
For example, suppose a new deployment causes one microservice to intermittently throw authentication errors downstream. A traditional system might not trigger an alert if the error rate is below a fixed threshold, and the ops team might only notice when it becomes a major outage.
An observability platform with anomaly detection could recognize the unusual spike in error percentage for that service or correlate that the error coincided with a deploy event.
Another scenario: anomaly detection might catch a memory leak early – e.g. if a service’s memory usage starts trending higher than its typical pattern, an AI-driven insight can flag it before the service actually crashes.
This proactive detection lets SREs fix issues before they escalate into outages. Basic visibility tools, reliant on human-set thresholds, often miss these subtle early warnings.
Performance Optimization and Bottleneck Identification
Beyond firefighting outages, observability is invaluable for performance tuning. In complex systems, the slowest component determines the user experience.
Observability data helps locate slownesses and inefficiencies. For instance, consider a web page that is loading slowly. Metrics might show the page load time is high (alerting you to the problem). With an observability approach, you could pull up a trace of a slow request and see which step took the longest – maybe a call to the reviews service is unusually slow. Then you check logs for that service around the same timestamp and find that a database query was sluggish (perhaps due to an inefficient query or lock contention). By correlating these signals, you’ve identified a specific bottleneck to fix.
Slow query: SELECT * FROM reviews...
As a general pattern: *metrics can signal high latency, traces will spotlight which service is the culprit, and logs provide the detailed reason (e.g. a slow SQL query)*. This capability is especially useful in microservices and serverless architectures where performance issues can creep in at unexpected places.
Complex Outage Resolution and Root Cause Analysis
When major incidents occur, observability helps resolve them quickly by:
- Correlating cascading failures across services into a coherent timeline
- Providing context before and after incidents through rich telemetry
- Enabling quick root cause analysis by showing relationships between events
- Reducing MTTR through comprehensive system visibility
For example, in a chain reaction failure where Service A's crash triggers issues in Services B and C, observability platforms can show the exact sequence and timing of events. This turns a confusing set of alerts into a clear narrative, helping teams identify and fix the root cause faster.
Analytics and Business Insights
Observability also connects technical metrics to business outcomes by enabling questions like:
- How do service latency spikes impact conversion rates?
- What's the performance difference between premium vs free users?
- How do new feature deployments affect system performance?
This "observability-driven development" helps teams:
- Make data-driven engineering decisions
- Prioritize optimizations that matter to users
- Bridge the gap between technical and business metrics
- Guide continuous improvement efforts
For instance, observing that a specific microservice frequently delays checkouts helps teams prioritize fixes that directly impact revenue. This goes beyond basic monitoring to provide actionable business intelligence.
In all these scenarios, observability not only helps to resolve problems faster but often to preempt issues or understand them more deeply. It transforms the way engineers interact with production systems – from passively receiving alerts to actively exploring and querying live system data.
Challenges in Implementing Observability
While observability brings significant benefits, teams face several key challenges when adopting these practices:
Data Management Challenges
Observability generates massive amounts of telemetry data - often hundreds of gigabytes daily. This volume can overwhelm both tools and teams, making it difficult to extract meaningful insights. Teams must carefully balance data retention with analysis needs, while managing storage costs and query performance.
Tool Integration & Complexity
Implementing observability often requires integrating multiple specialized tools into a cohesive stack. Many organizations struggle with data silos between different monitoring systems. While standards like OpenTelemetry help, deploying and maintaining an observability platform requires significant engineering effort and expertise.
Cost Considerations
The infrastructure and licensing costs for observability can escalate quickly. Storage, compute, and commercial platform fees add up, especially at scale. Teams need to make strategic decisions about data sampling, retention periods, and instrumentation overhead to keep costs manageable while preserving valuable insights.
Privacy & Security
Telemetry data often contains sensitive information that requires careful handling. Organizations must implement proper data governance, including sanitization processes and compliance with retention regulations. This adds another layer of complexity to observability implementations.
Cultural Adoption
Perhaps the biggest challenge is cultural - observability requires changes in how teams work. Developers need to embrace instrumentation as part of their workflow. Operations teams need new processes for using observability data effectively. Success requires strong leadership support and demonstrated value through concrete wins.
Despite these challenges, organizations continue investing in observability because the alternative - flying blind in production - is costlier in the long run. The key is taking a measured approach: start small, demonstrate value, and expand thoughtfully while addressing challenges along the way.
Tools & Technologies for Observability vs Visibility
The landscape of tools for observability has expanded rapidly. Here we’ll compare popular observability tools with some traditional visibility/monitoring tools, highlighting their roles:
Observability Tools and Platforms
These are tools designed to gather and correlate metrics, logs, and traces, often across distributed systems:
OpenTelemetry (OTel) with SigNoz:
OpenTelemetry is an open-source framework and collection of libraries for instrumenting applications and collecting telemetry data (metrics, logs, traces) in a standardized way. It’s not a monitoring solution by itself, but rather the plumbing that enables observability – think of it as the unified client libraries and agents you add to your code to emit data. With OpenTelemetry, you can instrument your services to send data to backends of your choice.
The key benefit is vendor-neutrality and consistency: you use the same instrumentation for many backends. OpenTelemetry supports many languages and has autoinstrumentation for popular frameworks, making it easier for devs to produce telemetry. In an observability stack, OTel might be used to collect data, which is then sent to a metrics system, a tracing backend, etc. (For example, you might use OTel libraries in your code, and point them to send traces to Jaeger and metrics to Prometheus or SigNoz for an all in one solution).
SigNoz is an open-source APM and observability platform that provides a unified solution for metrics, traces, and logs. It's designed as a more cost-effective, self-hosted alternative to commercial observability platforms like Datadog or New Relic. SigNoz uses OpenTelemetry for data collection, making it vendor-neutral and future-proof.
Key features of SigNoz include:
- Application metrics monitoring with pre-built dashboards
- Distributed tracing with flamegraphs and service dependency graphs
- Log management with full-text search and correlation with traces
- Infrastructure Monitoring, exception tracking and error monitoring
- Custom dashboards and alerts
- Support for multiple programming languages via OpenTelemetry
SigNoz is particularly appealing for teams that want full control over their observability data while avoiding vendor lock-in. It can be deployed on Kubernetes or docker-compose, and provides a single UI for all observability needs. For example, when troubleshooting a performance issue, you can start with application metrics, drill down into relevant traces, and correlate with logs – all within the same interface.
SigNoz Cloud is the easiest way to run SigNoz. Sign up for a free account and get 30 days of unlimited access to all features.
You can also install and self-host SigNoz yourself since it is open-source. With 24,000+ GitHub stars, open-source SigNoz is loved by developers. Find the instructions to self-host SigNoz.
Grafana + Prometheus:
Prometheus is a popular open-source metrics monitoring system for cloud-native environments. It collects metrics from services via HTTP endpoints and stores them as time-series data. Key features include real-time metrics collection, powerful PromQL querying, Kubernetes integration, and alerting capabilities. It enables monitoring of CPU, memory, request rates, error rates, and other metrics with threshold-based alerts.
Prometheus handles the metrics pillar of observability, particularly for golden signals (latency, traffic, errors, saturation). While it focuses on metrics only, it integrates well with other tools for a complete observability stack. It's commonly used with Grafana for visualization and can scale via solutions like Cortex/Thanos.
Grafana provides a unified interface for metrics, logs, and traces through its LGTM stack (Loki, Grafana, Tempo, Mimir). This offers an open-source alternative for full observability. The ecosystem includes Prometheus Alertmanager for alerts and emerging tools for continuous profiling like Pyroscope/Parca. Organizations typically combine these tools based on their needs, unless opting for a SaaS solution.
Elastic Stack (ELK/Opensearch):
A common approach for logs is the ELK stack – Elasticsearch, Logstash, Kibana – or its open-source fork OpenSearch/OpenSearch Dashboards. These systems store and index logs, and provide search and visualization capabilities. In terms of observability, Elasticsearch/OpenSearch can serve as the log management component: aggregating logs from many services and making them searchable in near real-time. Kibana (or OpenSearch Dashboards) can be used to set up log analytics and some basic correlations (for example, you can correlate logs with metrics if you ship metrics into Elasticsearch too, though that’s less common). Elastic has an “Observability” solution that ties together logs, metrics, and APM traces in their stack. So ELK/OpenSearch can be considered part of an observability toolkit (especially for the logging pillar). It’s a bit more DIY compared to all-in-one platforms; you need to run and scale the clusters. Many SRE teams set up centralized logging this way to improve visibility over the old approach of SSHing into servers to read log files.
Datadog:
Datadog is a popular commercial observability platform (SaaS) that offers a one-stop solution for metrics, logs, traces, and more. It provides agents to collect data from hosts and applications, and a unified cloud platform to store, visualize, and analyze that data.
One of the strengths of Datadog is correlation – in the Datadog UI, you can jump from an alerting metric directly to related logs or APM traces with a few clicks. Datadog’s APM (Application Performance Monitoring) features include distributed tracing similar to Jaeger, complete with service dependency maps and flame graphs of requests. It also has log management where you can tail and search logs, and a custom metrics database for all your app and infrastructure metrics. Additionally, Datadog includes machine-learning based anomaly detection and forecasting on metrics, and RBAC and integrations for a huge variety of technologies (AWS, Docker, MySQL, you name it).
Essentially, Datadog aims to be an all-in-one visibility and observability solution – replacing the need to run separate Prometheus, ELK, Jaeger, etc. It’s very convenient but can be costly at scale (since it charges based on hosts, volumes of logs, etc.).
Other notable commercial platforms in this space include New Relic, Dynatrace, Splunk Observability, Grafana Cloud, Honeycomb.io, and more – each with their own focus and strengths. For instance, Honeycomb is known for high-cardinality data exploration (great for debugging tricky problems with many dimensions), and Dynatrace has strong automated topology discovery and AI problem identification.
Traditional Visibility/Monitoring Tools
Prior to the modern observability movement, teams used a variety of simpler tools for monitoring and visibility. Some examples:
Infrastructure Monitoring (Nagios, Zabbix, Icinga):
Tools like Nagios (very popular in the 2000s) focus on host and service monitoring. They perform checks (ping this server, test this port, check this process) and report status (often just up/down or OK/warning/critical). They can send alerts if something is offline or a basic metric exceeds a threshold. These are great for basic infrastructure visibility – e.g., “is the web server running? is the disk full?” – but they don’t understand application-level issues or complex dependencies. As noted earlier, Nagios-style health checks are limited to known failure conditions and don’t provide insight into why a service is unhealthy. They also lack built-in log or trace analysis. Many organizations still use tools like Nagios or Icinga for system/network monitoring (e.g., verifying that all services are alive), but supplement them with observability tools for deeper insight.
Traditional Logging Systems:
In the past, “logging system” often meant a syslog server or simple log file aggregation. For example, using syslog protocol to collect logs from various servers into a central syslog server, or manually aggregating log files with scripts. Tools like the ELK stack improved on this by allowing search, but earlier on one might just use grep on combined logs or basic log rotation and retention schemes. Even today, some teams rely on cloud vendor logging solutions (like AWS CloudWatch Logs) which provide raw log access but minimal correlation. A “traditional” approach is to troubleshoot by logging into servers and reading logs – which is slow and doesn’t scale when you have hundreds of instances and ephemeral containers. Thus, moving to centralized log management was a huge step in visibility. Still, simply having all logs in one place (without linking to metrics/traces) is only part of observability. It’s often reactive (you go to the logs after an alert tells you something’s wrong).
APM (Application Performance Monitoring) Tools:
Before “observability” became a buzzword, APM suites (like earlier versions of New Relic, AppDynamics, etc.) provided a form of visibility into applications. They would instrument your app to measure things like response times, throughput, and maybe capture traces of slow transactions. Classic APM is somewhat a precursor to observability, but often more black-box – it gives you performance charts and maybe error analytics, but might not ingest arbitrary logs or allow flexible correlation. The distinction between APM and observability has blurred as APM vendors added log and trace features and as observability grew to include user-experience and business metrics. One could say observability is an evolution of APM with more openness and data sources.
Network Monitoring Tools:
Visibility can also refer specifically to network-level visibility. Tools such as SolarWinds Network Performance Monitor, Wireshark, or even simple SNMP-based monitors give insight into network devices, traffic flows, and connectivity. For example, a network monitor might show that a link is saturated or a router interface is down (which is crucial info). However, these operate at the network layer and don’t tell you the impact on application transactions directly. They’re often used by ops teams to troubleshoot connectivity or bandwidth issues.
In essence, older visibility tools are each good at a slice: uptime monitoring, resource metrics, logs, or network stats. They’re often not integrated and require human correlation. Modern observability tools aim to bring these slices together.
It’s worth noting that many of the observability tools we listed (SigNoz, Prometheus, Jaeger, etc.) are open-source and can be used à la carte, whereas many traditional tools were also open-source (Nagios, etc.) or simple scripts. Organizations might build an observability solution by composing open-source tools, or they might opt for a commercial platform that packages them together.
Observability vs. Visibility: Key Differences and Implications
While both observability and visibility aim to understand system behavior, they differ significantly in their approach and capabilities. Here’s a breakdown of the key distinctions:
| Feature | Observability | Visibility |
|---|---|---|
| Focus | Unknown, unexpected system behavior | Known, predefined issues |
| Approach | Proactive, exploring system behavior in real-time | Reactive, monitoring predefined metrics/logs |
| Goal | Understand why a system behaves a certain way | Know what is happening in a system at a given moment |
| Data Types | Metrics, logs, and traces | Primarily metrics and logs |
| Data Correlation | Seamless correlation between metrics, logs, and traces for faster root cause analysis | Correlation possible but often manual or limited |
| Troubleshooting | Enables deep root cause analysis, even for unknown issues | Limited to known issues, struggles with complex interactions |
| Scalability | Designed to scale with complex, dynamic systems | Challenges in scaling with complex systems |
| Key Limitation | Requires more effort in instrumentation and data analysis | Difficulty diagnosing unexpected issues in complex systems |
| Performance Overheads | Higher data ingestion and processing costs; optimized using trace sampling and log aggregation | Lower computational/storage footprint due to lightweight metric/log collection |
| AI-Driven Insights | AI-assisted anomaly detection, automated root cause analysis, and predictive issue prevention | Limited or rule-based alerting |
| Tool Examples | SigNoz, LGTM stack | Nagios, Zabbix |
Observability is a proactive approach that helps understand why a system behaves a certain way by correlating metrics, logs, and traces for deep root cause analysis. It scales well with complex, dynamic systems but requires more instrumentation effort.
Visibility, on the other hand, is reactive, focusing on predefined metrics and logs to show what is happening. It works well for known issues but struggles with unexpected failures and lacks seamless data correlation.
SigNoz: An Open-Source Solution for Modern Observability
SigNoz is an open-source observability platform designed to provide developers and Site Reliability Engineers (SREs) with comprehensive insights into their applications and infrastructure. Built on OpenTelemetry, SigNoz enables the seamless collection of logs, metrics, and traces, allowing teams to effectively monitor system health, identify performance bottlenecks, and troubleshoot issues in real-time.
SigNoz as an Observability Platform
SigNoz extends beyond traditional monitoring by offering deep visibility into system behavior, facilitating the understanding of complex interactions within distributed environments. It captures and correlates the three pillars of observability:
- Metrics: SigNoz excels at collecting and visualizing key performance indicators (KPIs) relevant to SREs, including the crucial Four Golden Signals (latency, traffic, errors, and saturation). This is facilitated by features like:
Custom Dashboards: Build personalized dashboards to monitor specific metrics, Service Level Objectives (SLOs), and Service Level Indicators (SLIs) in real-time.
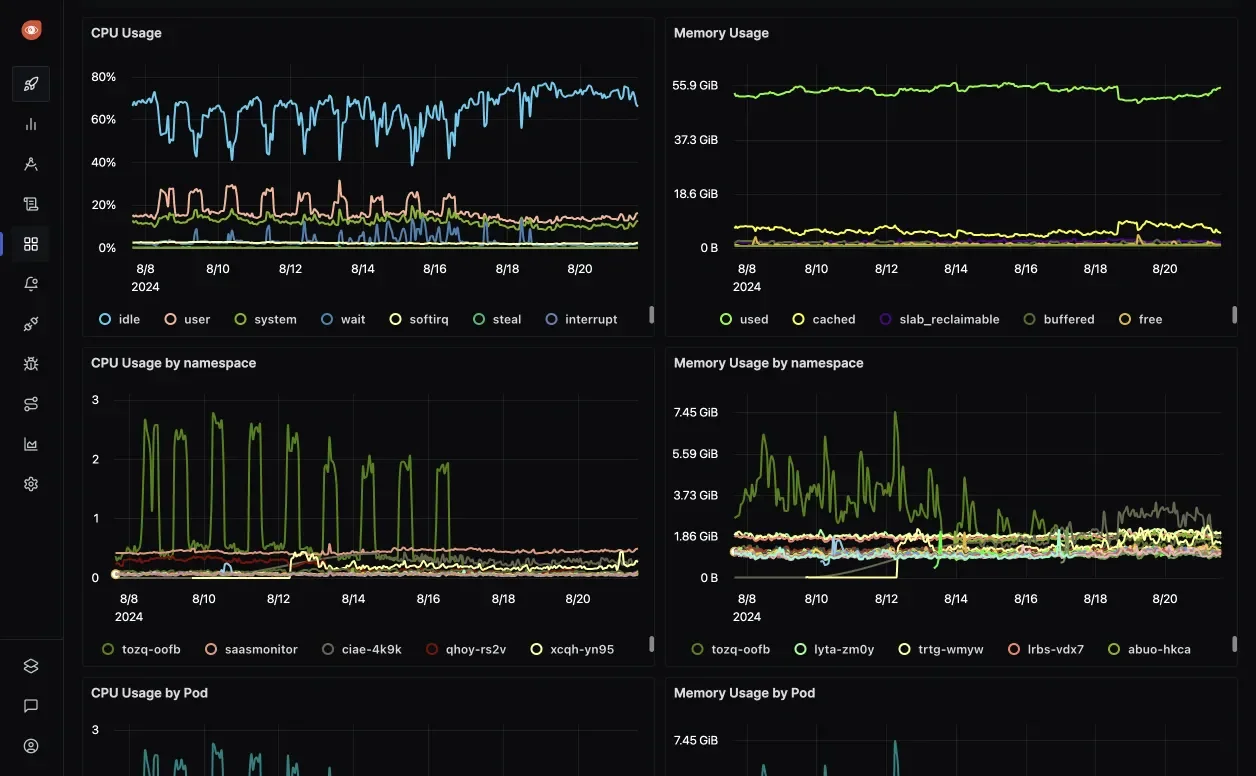
Custom Dashboards in SigNoz Intelligent Alerting: Define alerts based on metric thresholds, anomaly detection, or complex PromQL queries to identify performance issues proactively.

Alerts in SigNoz PromQL Compatibility: Fully compatible with Prometheus Query Language (PromQL), enabling users to leverage their existing Prometheus queries within SigNoz.
- Logs: SigNoz provides robust log management capabilities, enabling users to search, filter, and correlate logs with other observability data, providing valuable context during incident investigations. Key features include:
Powerful Log Querying: Search, filter, and analyze logs using an intuitive query interface to quickly find relevant events.
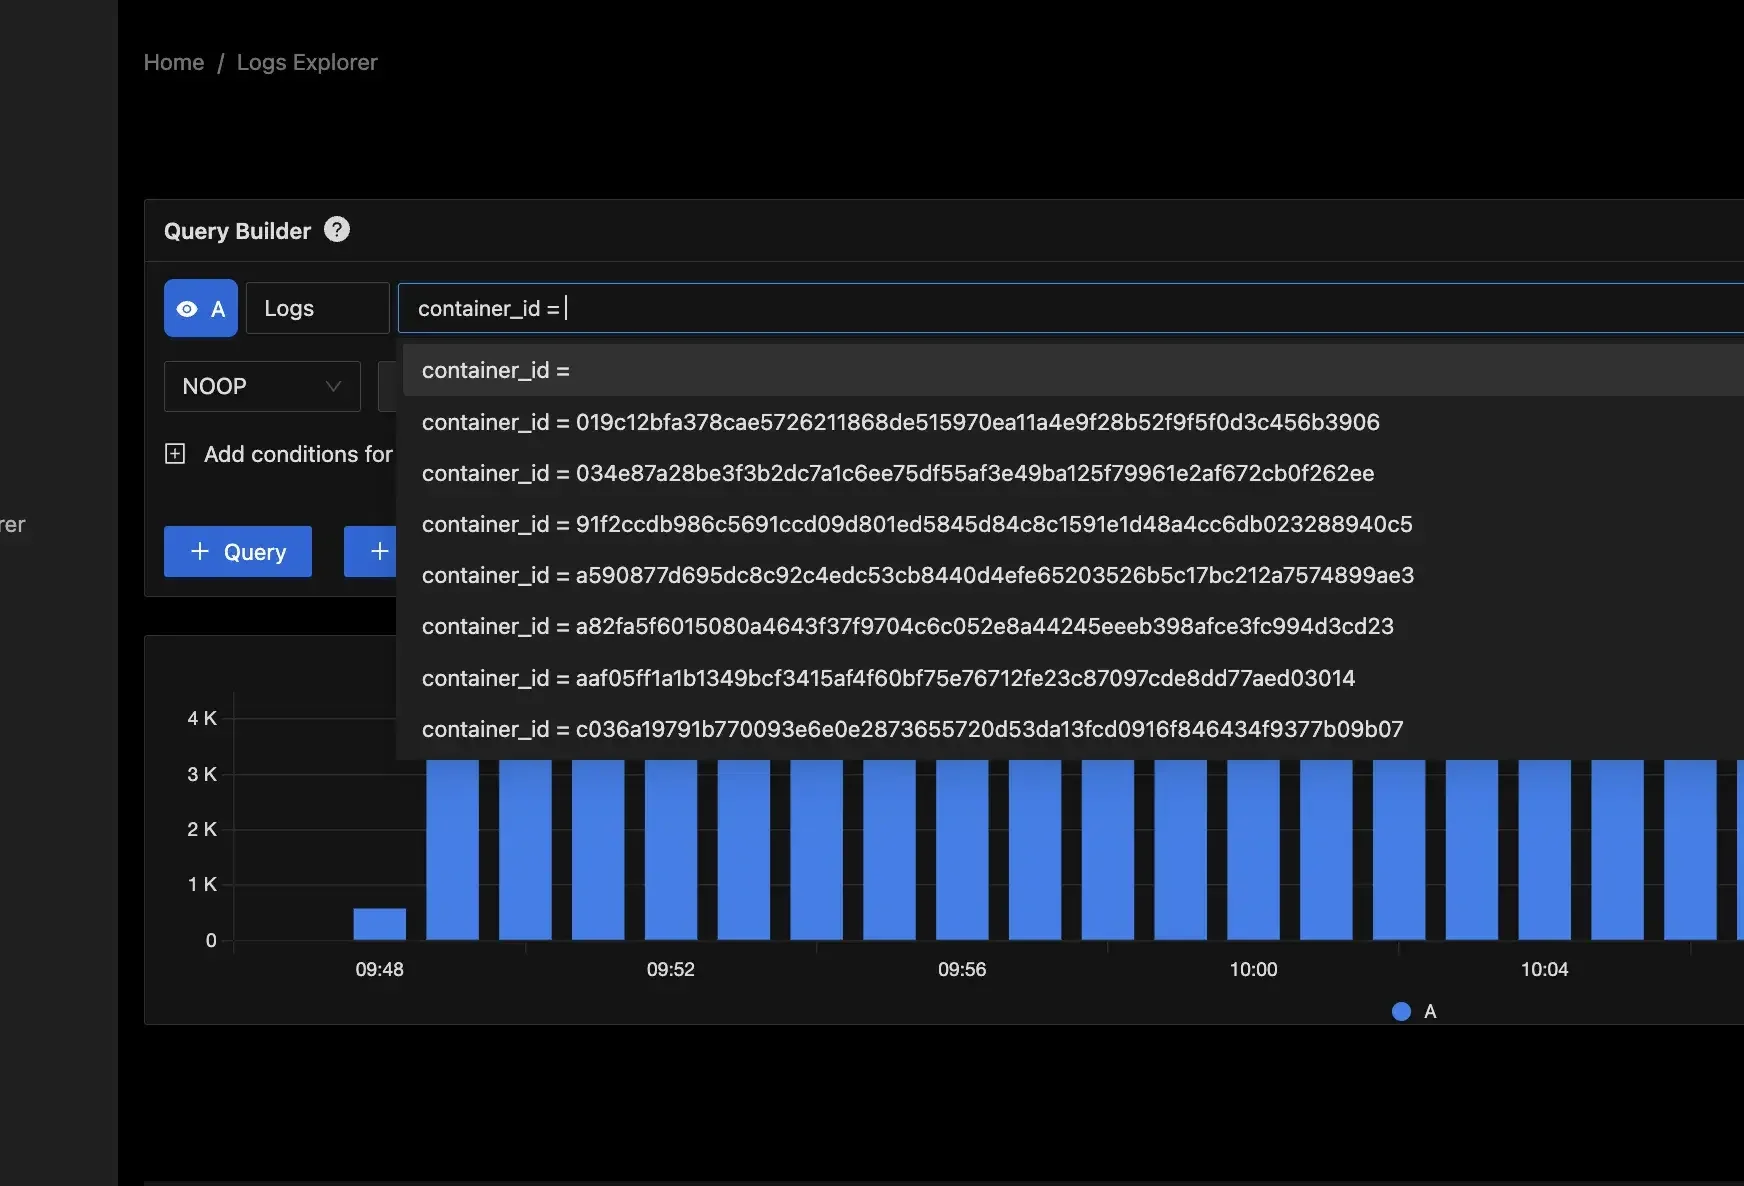
Log Queries in SigNoz Centralized Log Aggregation: Collect logs from various services into a single, searchable repository, making debugging and auditing easier.
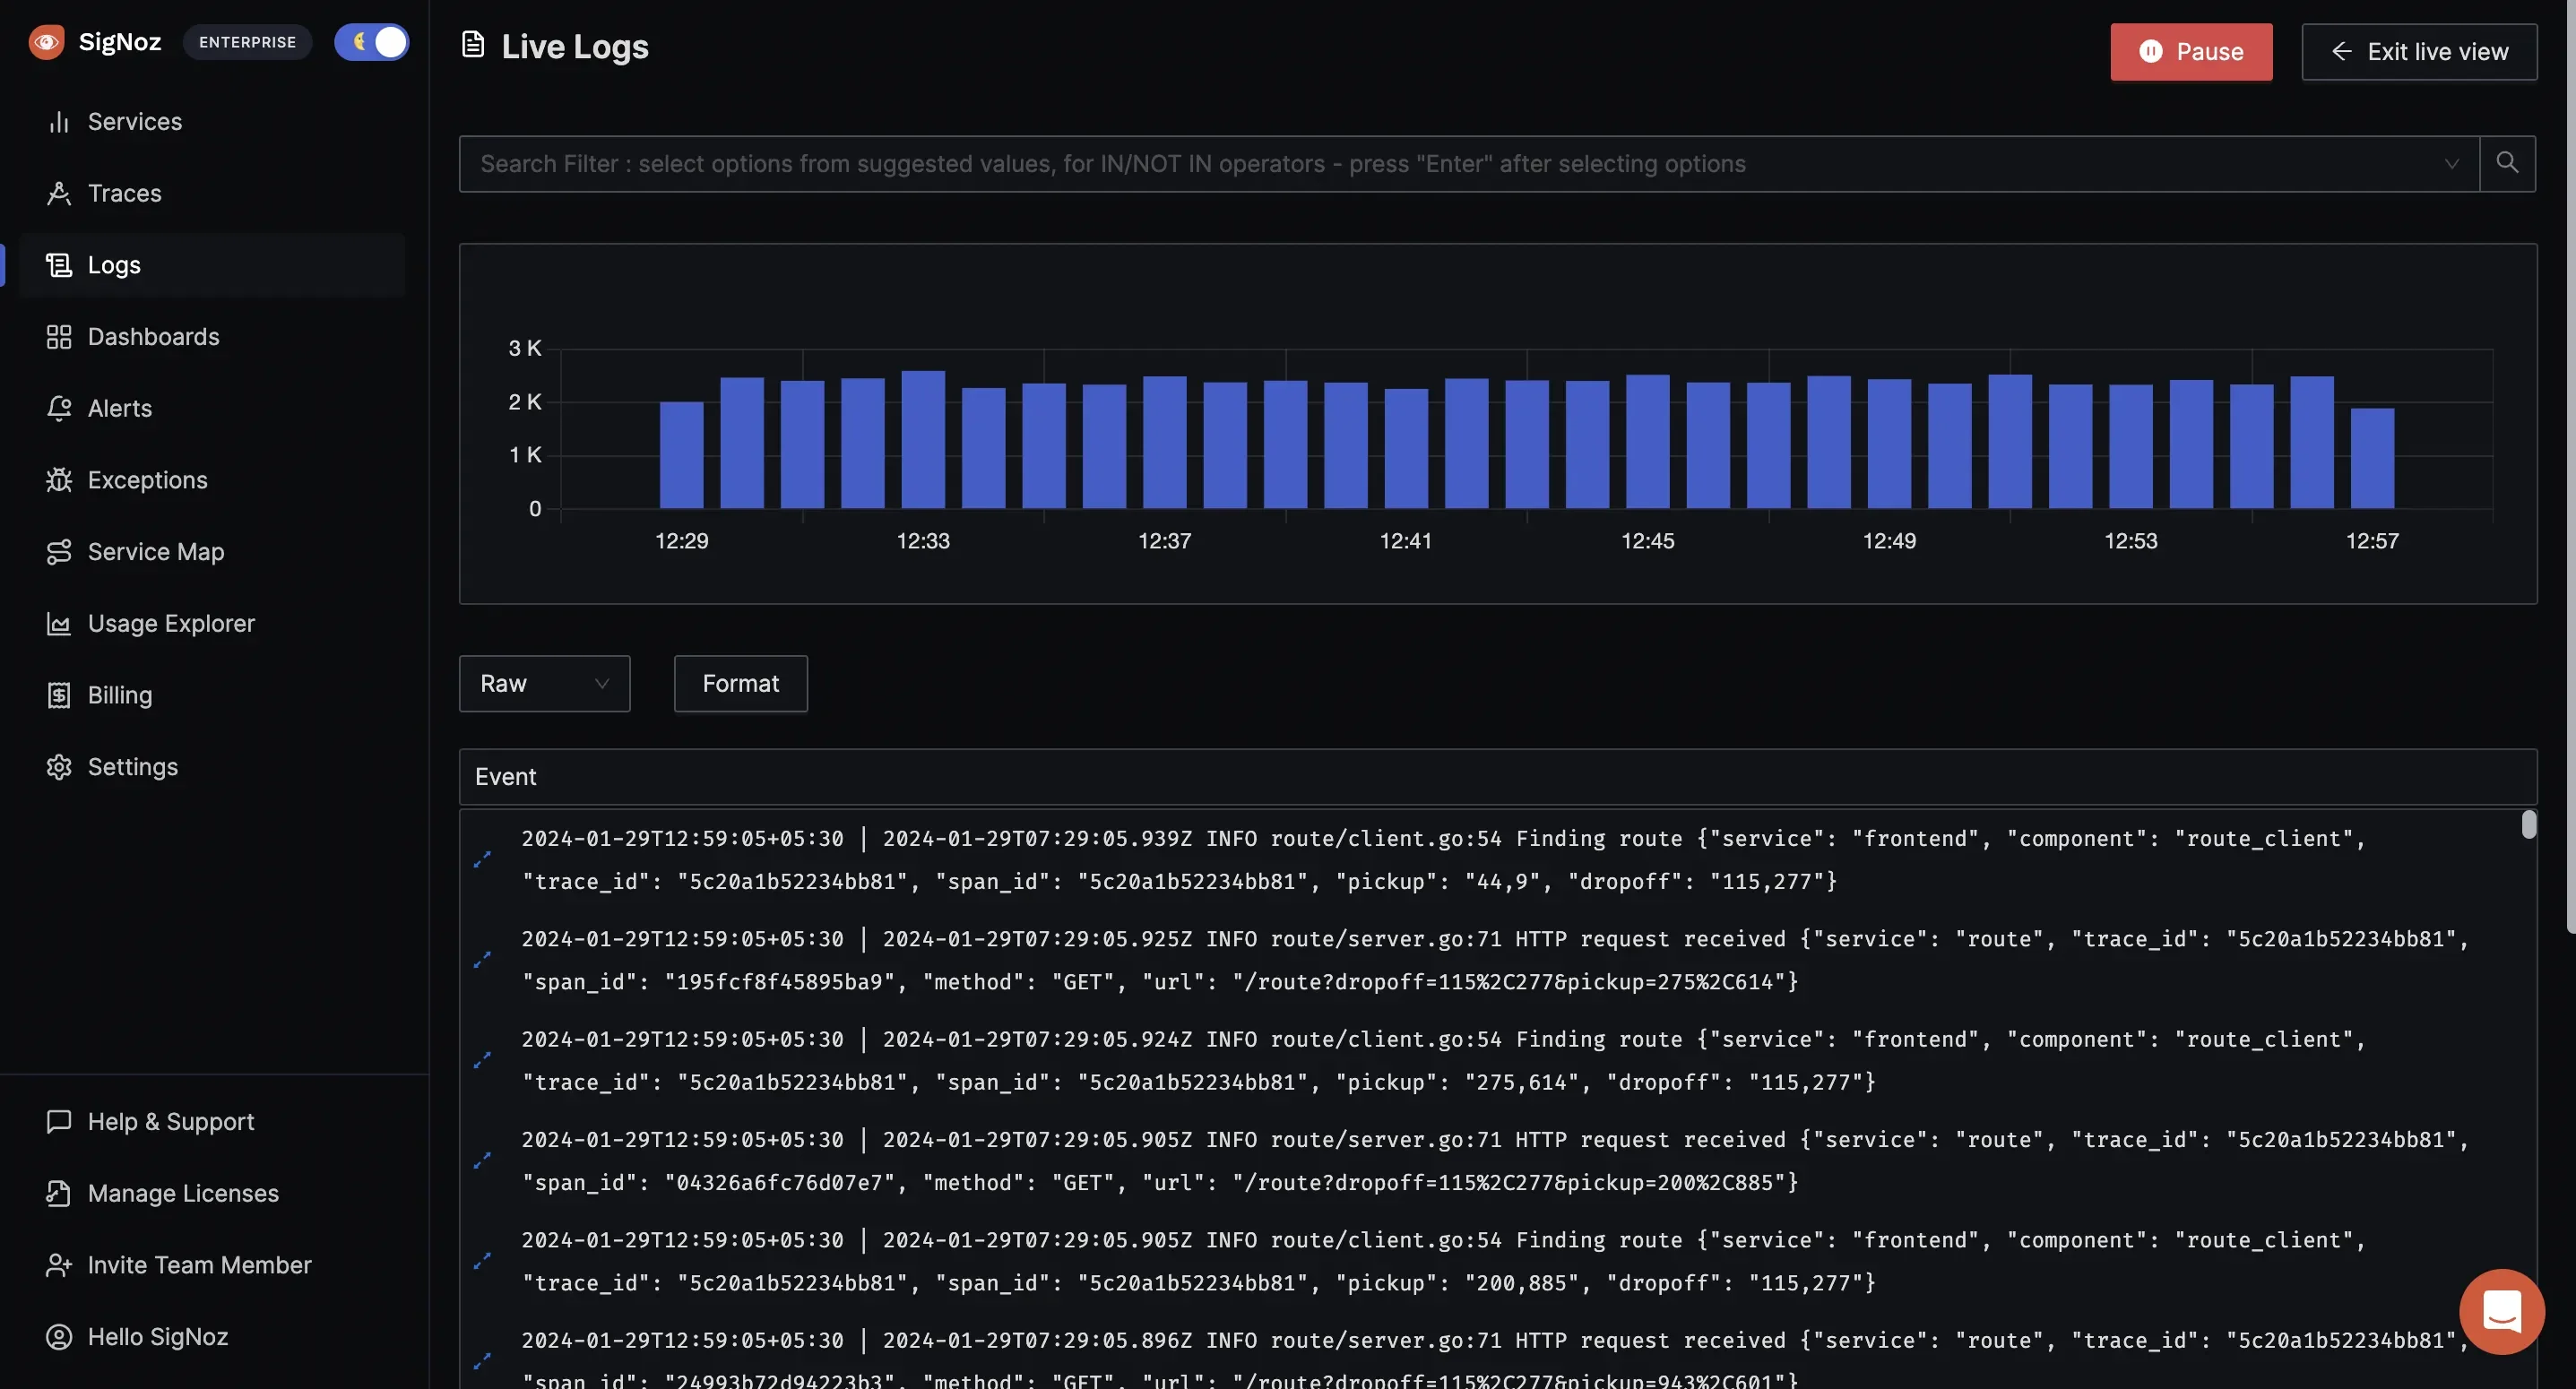
Centralized Log Aggregation in SigNoz Live Tail Logging: Monitor logs in real-time to instantly detect errors, anomalies, and performance issues as they occur.
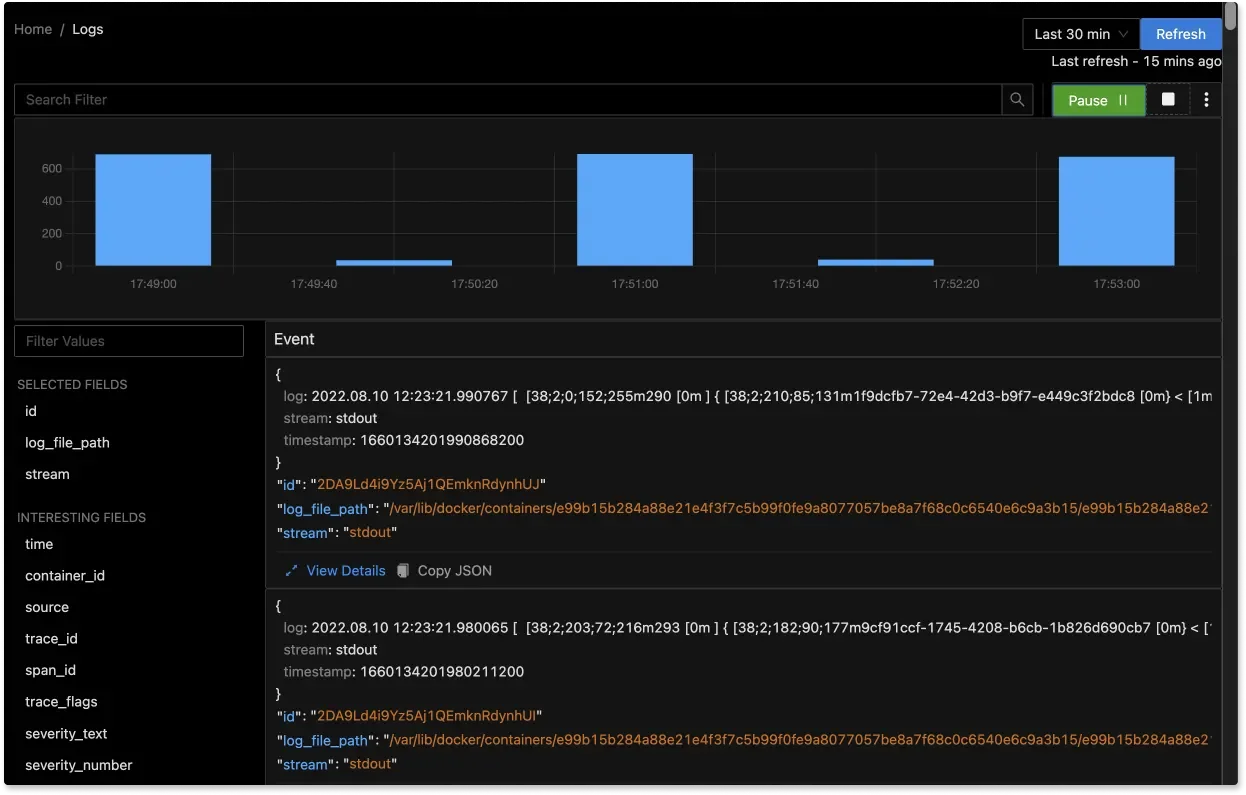
Live Tail Logging in SigNoz
- Traces: SigNoz’s tracing capabilities provide deep visibility into request flows across microservices, helping teams identify performance bottlenecks and understand complex service dependencies. This enables faster debugging and automated root cause analysis through features like:
Distributed Trace Visualization: Gain a clear, end-to-end view of how requests travel across services using Gantt charts.
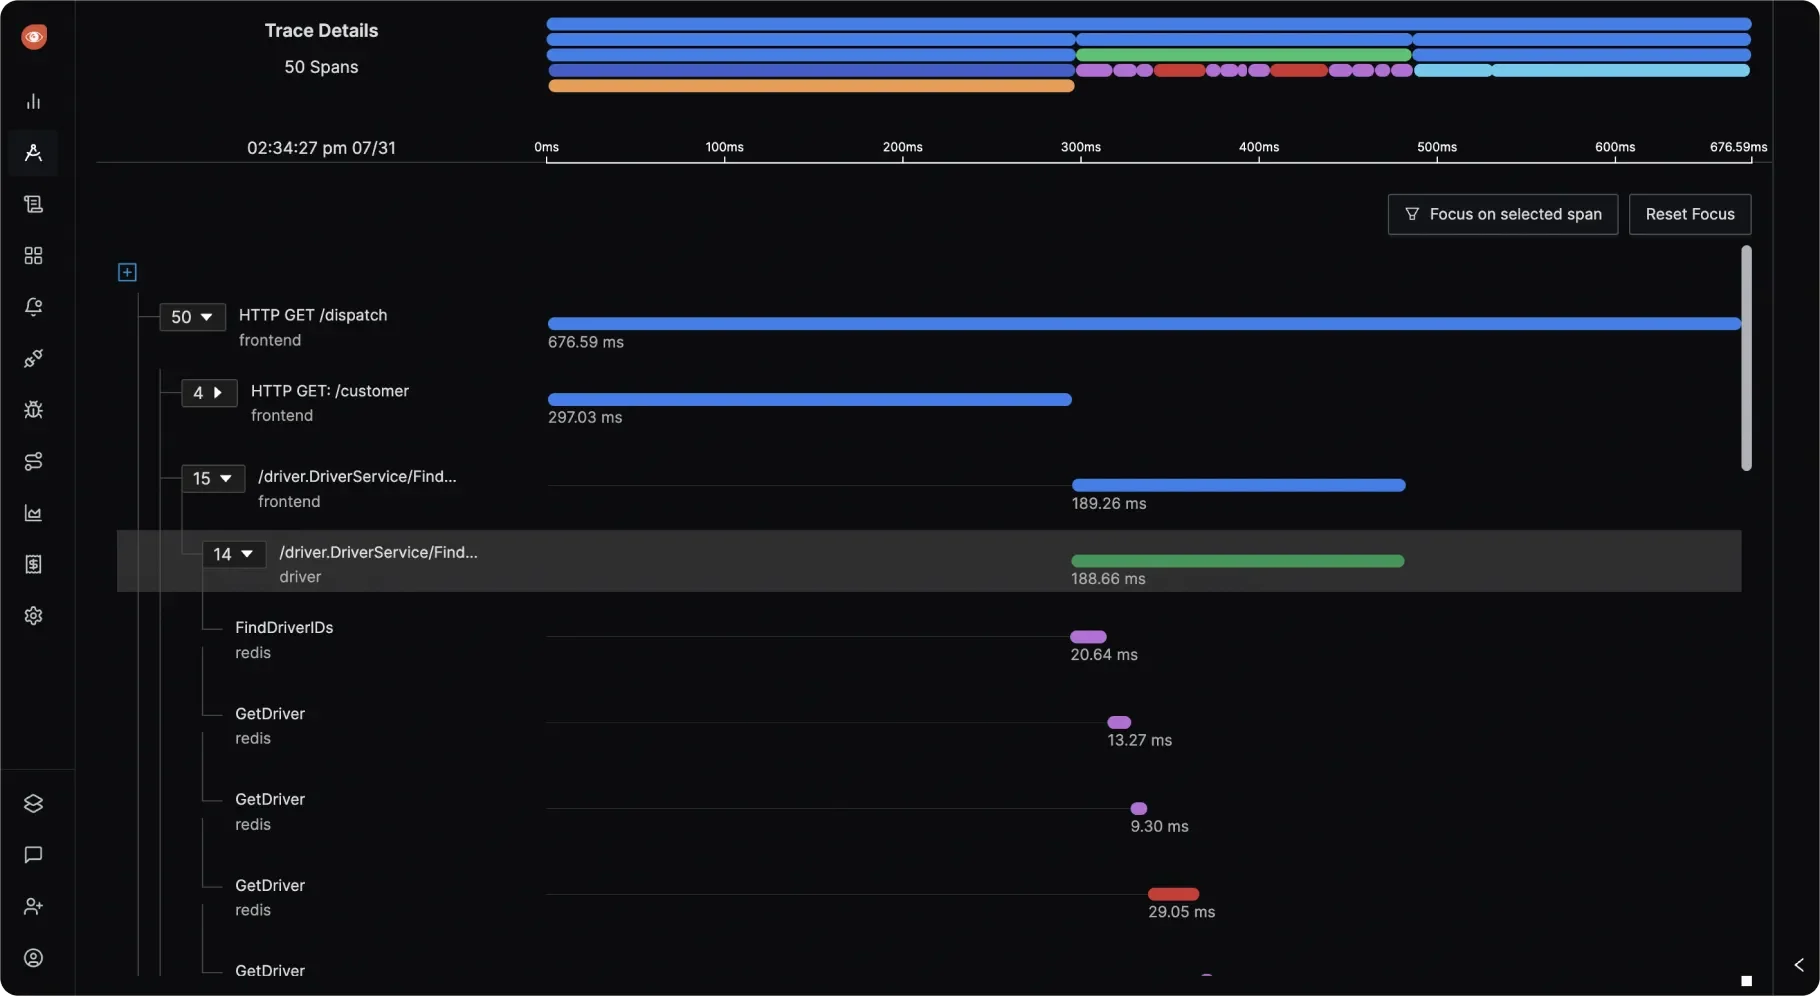
Distributed Trace Visualization in SigNoz Trace Filtering and Analysis: Quickly filter spans based on status codes, service names, operations, RPC methods, and more to isolate performance issues.
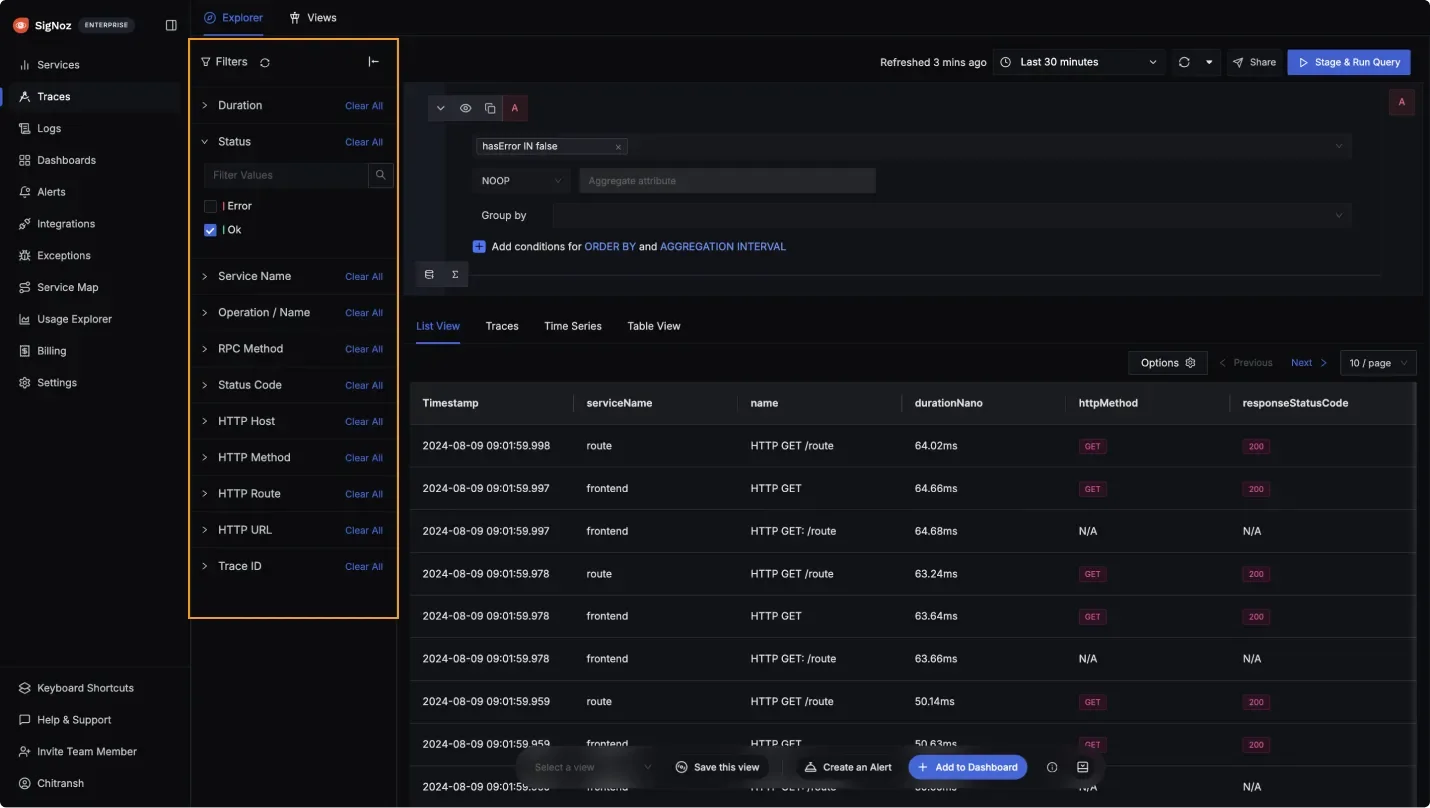
Trace Filtering and Analysis in SigNoz Correlation with Logs: Link traces with logs to get deeper context during debugging, allowing you to track errors and anomalies across different observability signals.
Automated Root Cause Analysis: By correlating traces, logs, and metrics, SigNoz pinpoints the root cause of issues, reducing time spent on troubleshooting.
By offering a unified view of these three crucial data types, and by providing these features, SigNoz empowers teams to move beyond reactive monitoring and embrace a proactive approach to maintaining system reliability.
SigNoz Cloud is the easiest way to run SigNoz. Sign up for a free account and get 30 days of unlimited access to all features.
You can also install and self-host SigNoz yourself since it is open-source. With 24,000+ GitHub stars, open-source SigNoz is loved by developers. Find the instructions to self-host SigNoz.
Refer to the documentation to get more insights into observability with SigNoz.
Key Takeaways
To put it succinctly, using traditional visibility focused monitoring is like having separate security cameras for each room – you can see what happened in one area. Using observability is like having a 360-degree view that stitches all cameras together – you get the full story of an intruder moving through the building, not just isolated snapshots.
- Visibility relies on predefined metrics to detect known issues ("What?"), while observability enables flexible querying to investigate unknowns ("Why?"), making it essential for proactive problem-solving.
- Traditional monitoring focused on visibility struggles with complex systems, root cause analysis, and scaling high-cardinality metrics.
- Observability proactively uses metrics, logs, and traces to understand system behavior and detect unknown issues, offering deeper insights, root cause analysis, and scalability compared to visibility's limitation to predefined issues.
- The three pillars of observability—metrics, logs, and traces—work together to provide a holistic view of system behavior.
- Microservices and cloud-native environments require observability for effective monitoring and troubleshooting due to their complexity and dynamic nature.
- Observability tools like SigNoz provide real-time correlation of metrics, logs, and traces, aiding in complex issue diagnosis.
FAQs
What’s the core difference between observability and visibility?
Visibility relies on predefined metrics and known system behaviors, answering "what" is happening. Observability goes beyond this by enabling dynamic, ad-hoc exploration of system state, allowing teams to investigate unknown issues and understand "why" they occur without being limited to predefined data.
How does observability differ from traditional monitoring, and what advantages does it offer?
Traditional monitoring is reactive, relying on threshold-based alerts for predefined metrics. In contrast, observability is proactive, leveraging logs, traces, and correlations to detect unknown issues before they escalate. This deeper insight enables faster troubleshooting, automated root cause analysis, and improved system resilience in complex environments.
How does observability help with troubleshooting and root cause analysis in distributed systems?
Observability empowers engineers to trace requests across multiple services, identify bottlenecks, and understand the impact of failures. It helps by:
- Correlating data from different sources (metrics, logs, traces).
- Visualizing complex interactions between services.
- Enabling drill-down into specific requests or events.
- Providing context for understanding the impact of changes.
Why is observability more important than ever in cloud-native and microservices architectures?
Cloud-native and microservices environments are highly dynamic and distributed, making traditional monitoring approaches inadequate. Observability is crucial for understanding the complex interactions within these systems, enabling teams to maintain reliability, optimize performance, and troubleshoot effectively.
How can organizations implement observability practices and tools like SigNoz to improve reliability and performance?
Organizations can implement observability by:
- Instrumentation: Instrumenting their applications to collect metrics, logs, and traces.
- Centralized Platform: Using a centralized platform like SigNoz to ingest, store, and analyze this data.
- Data Analysis: Analyzing the data to identify patterns, anomalies, and potential issues.
- Alerting and Dashboards: Setting up alerts and dashboards to monitor key metrics and provide real-time insights.
- Continuous Improvement: Continuously refining their observability practices based on the insights gained.
