Sending Logs to SigNoz - OpenTelemetry NodeJS
This article is part of the OpenTelemetry NodeJS series:
- Previous Article: Setting up Custom Metrics - OpenTelemetry NodeJS
- You are here: Sending Logs to SigNoz - OpenTelemetry NodeJS
- Next Article: Correlating Traces, Logs, and Metrics - OpenTelemetry NodeJS
Check out the complete series at: Overview - Implementing OpenTelemetry in NodeJS with SigNoz - OpenTelemetry NodeJS
structured logging Logs records sequential events that happen within an application, giving context to operations and aiding in debugging. This article will guide you through enhancing the Order with structured logging, using OpenTelemetry for observability and SigNoz for visualization.
Prerequisites
- Familiarity with Node.js and Docker.
- Basic understanding of microservices architecture and OpenTelemetry.
- Access to an environment where SigNoz and OpenTelemetry are set up.
Why Structured Logging?
Structured logging captures log data in a consistent and machine-readable format, enabling better searchability and analysis than traditional plain text logs. Integrating structured logs with observability tools like SigNoz allows for more dynamic data querying and actionable insights.
Setting Up the Environment
Before diving into logging, ensure your microservices, including the Order and Product services, are containerized with Docker, and the OpenTelemetry Collector is configured to handle logs. If you have followed the tutorial till now then you don’t need to worry about this.
Integrating Pino for Logging
Pino is a high-performance JSON-based logging library for Node.js. It's particularly well-suited for production environments due to its low overhead.
If you are new to Pino, the Pino logger guide walks through configuration before you wire it into OpenTelemetry.
Now, let's look at the steps for integration to understand how Node.js logging works:
-
Installation: Add Pino to your Node.js service:
npm install pino pino-pretty -
Configuration: Setup Pino in your Order service:
// logger.js
import pino from "pino";

const logger = pino({
  transport: {
    target: "pino-pretty",
  },
});

export default logger;
Implementing Logging in the Order Service
Enhance the validateOrder function within your Order service to include detailed logging:
-
Import the logger: Import the logger that we set up in the previous step.
// ... code as it is import { performance } from "perf_hooks"; **// Import the logger import logger from "./logger.js";** // ... code as it is -
Start of Validation: Log the initiation of the order validation process.
logger.info({ orderId: order._id.toString() }, "Starting order validation"); -
Product Check: Log the availability check for each product.
logger.info( { orderId: order._id.toString(), productId: item.productId, quantity: item.quantity, }, "Checking product availability" ); -
Validation Result: Log the outcome of the validation, especially detailing any failures.
logger.info(
        { orderId: order._id.toString(), duration },
        "Order validation completed successfully"
      );
In the catch block, include:
logger.error(
        { orderId: order._id.toString(), error: error.message },
        "Order validation failed"
      );
The entire validateOrder will look like this now:
async function validateOrder(order) {
  const startTime = performance.now(); // Start timing
  logger.info({ orderId: order._id.toString() }, "Starting order validation");

  // Creating a histogram to track order validation duration
  const orderValidationDurationHistogram = meter.createHistogram(
    "order_validation_duration",
    {
      description: "Measures the duration of order validation",
      unit: "ms", // unit of measure
    }
  );

  // Start a new span for the validation process
  return tracer.startActiveSpan("validate-order", async (span) => {
    try {
      // Add an event indicating the start of validation
      span.addEvent("Order validation started");

      // Set attributes to provide more context
      span.setAttribute("order.id", order._id.toString());

      let total = 0;

      // Validate each product in the order
      for (const item of order.products) {
        logger.info(
          {
            orderId: order._id.toString(),
            productId: item.productId,
            quantity: item.quantity,
          },
          "Checking product availability"
        );

        // Fetch product details from the Product service
        const productResponse = await fetch(
          `http://product:3003/products/${item.productId}`
        );
        const product = await productResponse.json();

        // Check product availability
        if (!product || product.stock < item.quantity) {
          logger.error(
            {
              orderId: order._id.toString(),
              productId: item.productId,
              required: item.quantity,
              available: product ? product.stock : "N/A",
            },
            "Product is out of stock or does not exist"
          );
          throw new Error(
            `Product ${item.productId} is out of stock or does not exist.`
          );
        }

        // Decrement product stock via the Product service
        const updateResponse = await fetch(
          `http://product:3003/products/${item.productId}/decrement-stock`,
          {
            method: "POST",
            headers: { "Content-Type": "application/json" },
            body: JSON.stringify({ decrementBy: item.quantity }),
          }
        );

        // Check if stock update was successful
        if (!updateResponse.ok) {
          throw new Error(
            `Failed to update stock for Product ${item.productId}.`
          );
        }

        // Calculate the total amount
        total += product.price * item.quantity;
      }

      // Add the total as an attribute to the span
      span.setAttribute("order.total", total);

      // Add an event indicating the completion of validation
      span.addEvent("Order validation completed");

      // End timing and record the duration
      const duration = performance.now() - startTime;

      orderValidationDurationHistogram.record(duration, {
        "order.id": order._id.toString(),
        status: "validated",
      });

      span.setStatus({ code: SpanStatusCode.OK });

      logger.info(
        { orderId: order._id.toString(), duration },
        "Order validation completed successfully"
      );
    } catch (error) {
      logger.error(
        { orderId: order._id.toString(), error: error.message },
        "Order validation failed"
      );
      // Record the error and set the span status to error
      span.setStatus({ code: SpanStatusCode.ERROR, message: error.message });
      span.recordException(error);
      throw error;
    } finally {
      // End the span
      span.end();
    }
  });
}
Now you can run and see the logs in your console. Next we will be transporting these logs to SigNoz.
Setting up the Logs Pipeline in Otel Collector
Modify your logger.js to send the logs to the Otel collector:
// logger.js
import pino from "pino";
import { trace } from "@opentelemetry/api";

const logger = pino({
  transport: {
    targets: [
      **{
        target: "pino-opentelemetry-transport",
        options: {
          resourceAttributes: {
            "service.name": "order-service",
          },
        },
      }**,
      {
        target: "pino-pretty",
        level: "info",
        options: { colorize: true },
      },
    ],
  }
});

export default logger;
Pino transports are used to transform and/or transmit log output to a particular target, in this case we are prettifying the logs and transmiting to the console using the default pino-pretty target.
transport: Defines how logs should be processed or transported. In this case, it specifies using a target.targets: An array where each item defines a specific log destination or processing method.target:- Specifies the
pino-prettymodule, which formats the logs in a more human-readable form. Pino-opentelemetry-transport: This transport integrates logging with OpenTelemetry, allowing log data to be collected as part of OpenTelemetry's observability framework. It's configured to include resource attributes, specifyingservice.nameas "order-service" to identify logs originating from this service in the monitoring tools.
- Specifies the
level: Sets the log level toinfo, meaning only logs at this level or higher will be captured (e.g.,info,warn,error).options: Provides additional settings for the target, such ascolorize: true, which adds color to the log output for better readability.
Viewing Logs in SigNoz
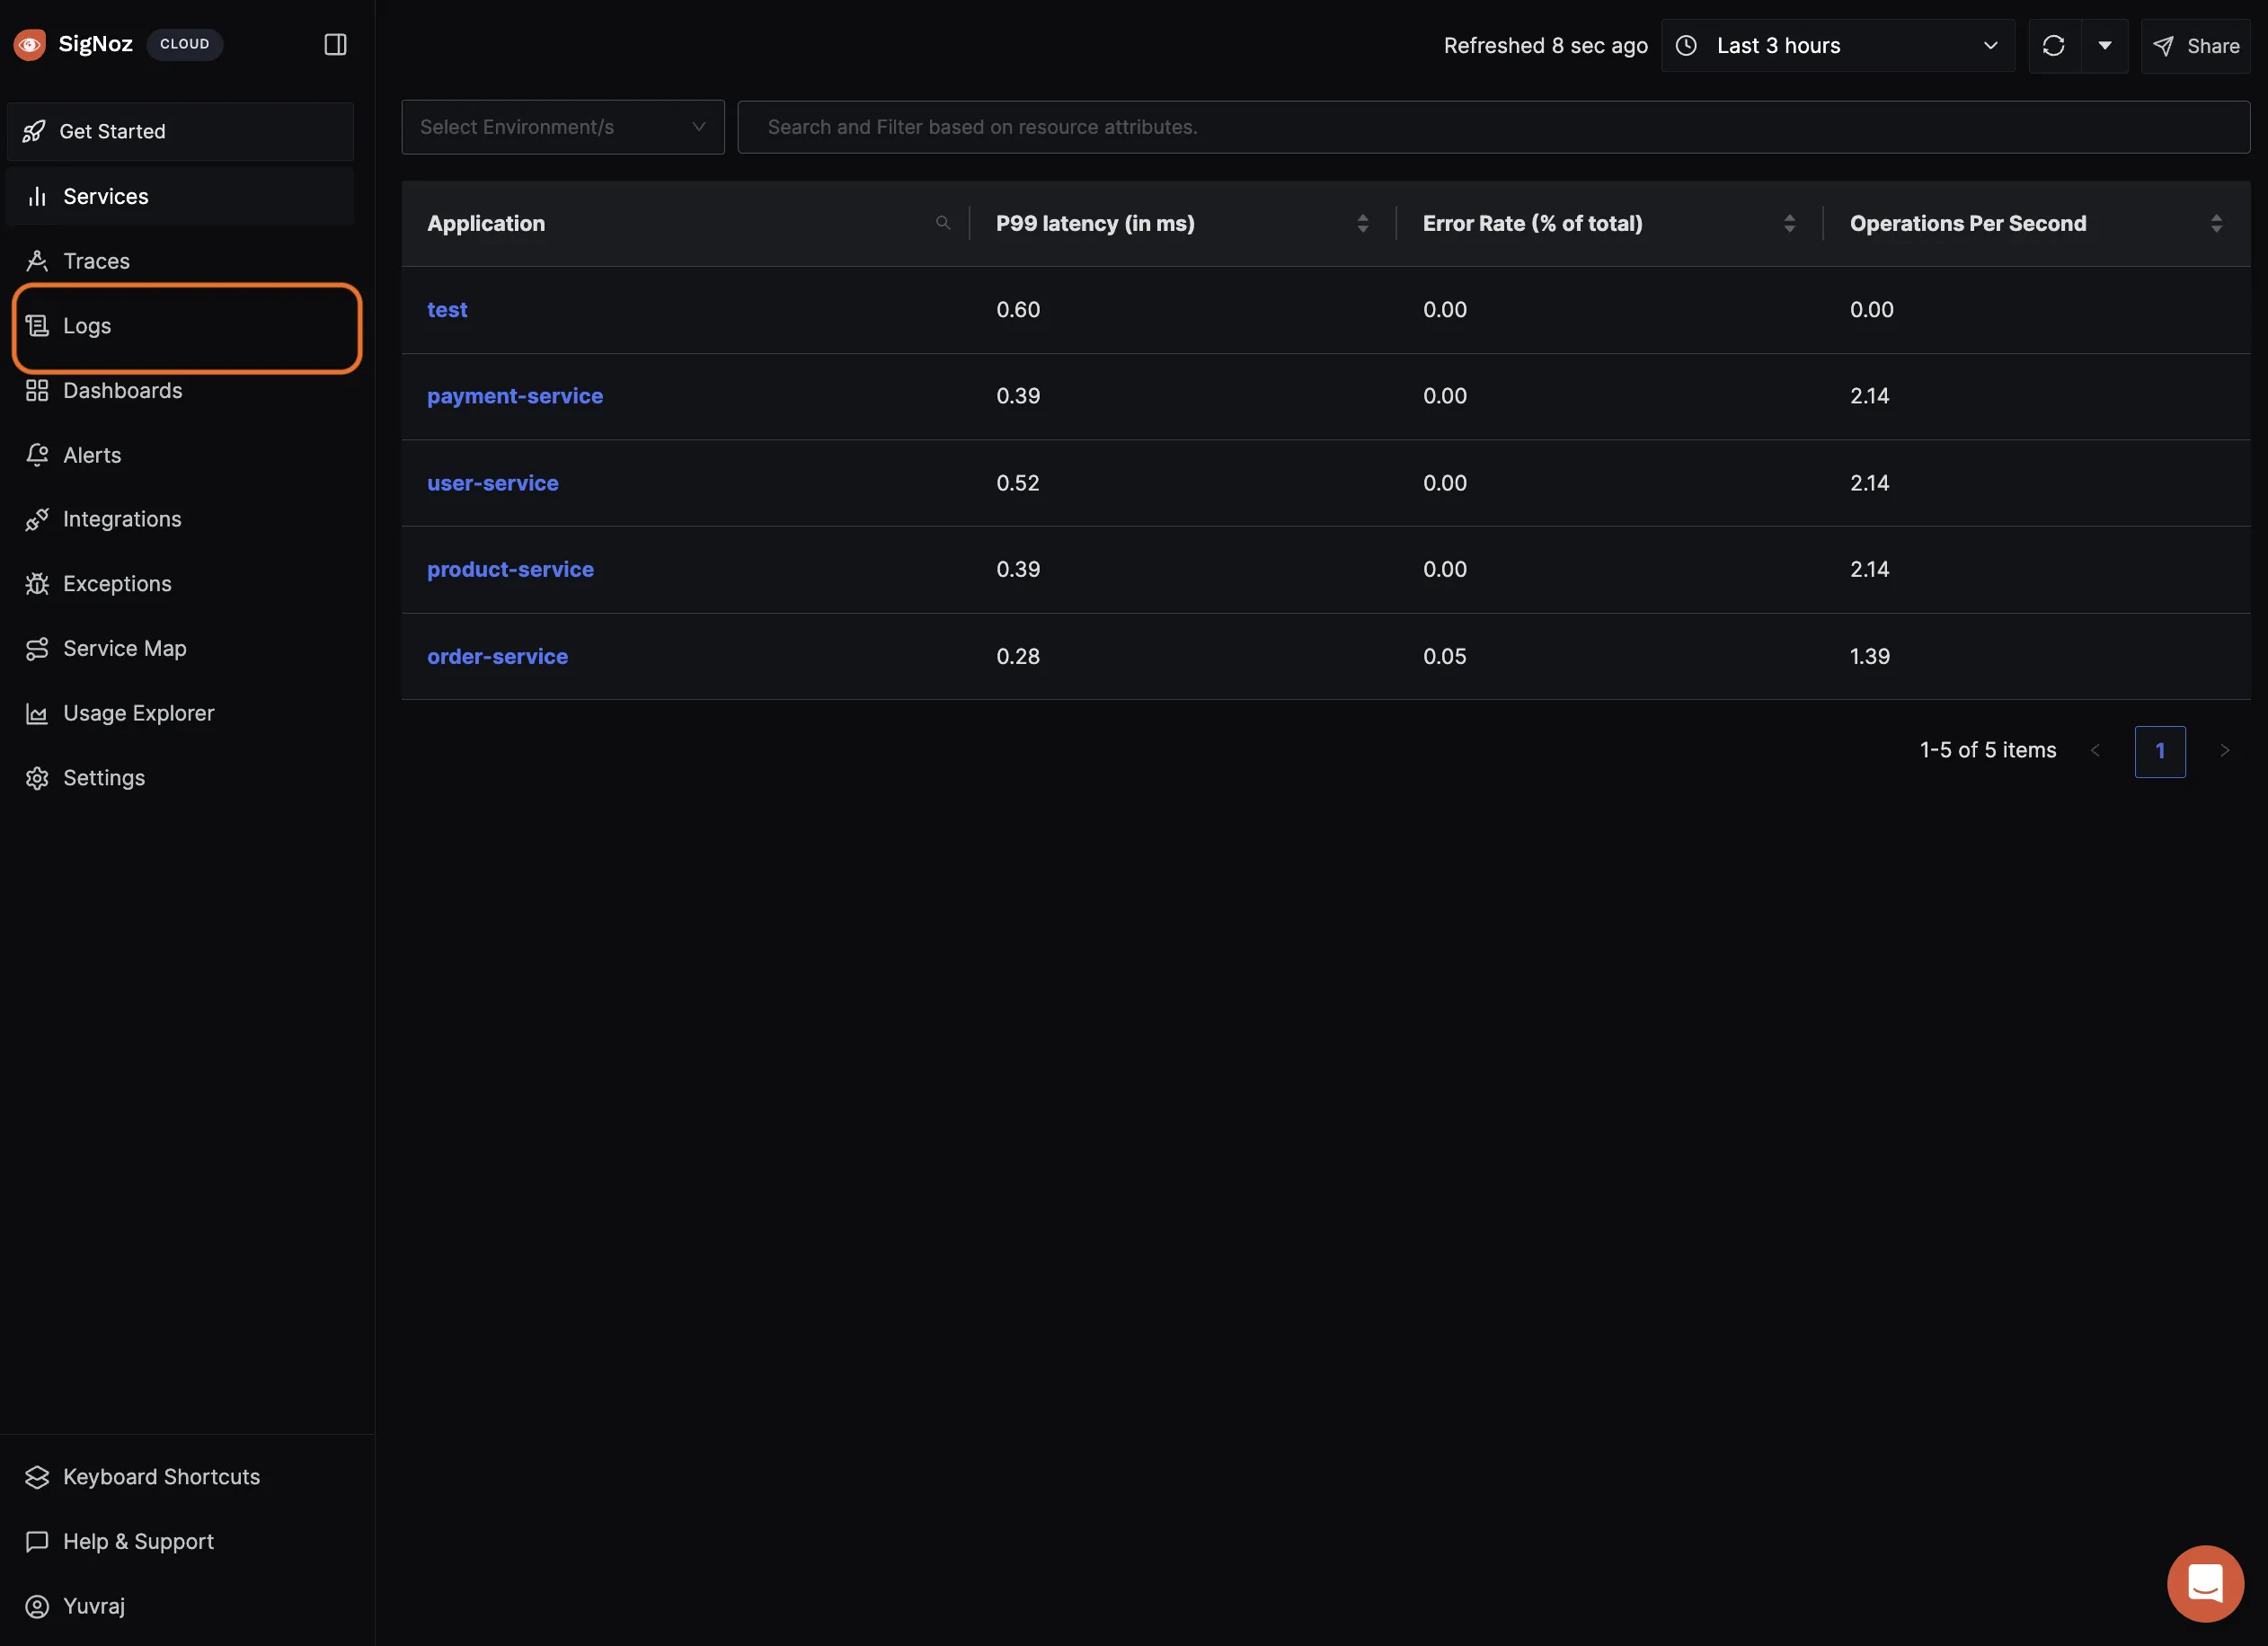
Run the services and hit the post request on the order-service endpoint and then navigate to the logs dashboard to see all the logs being set to SigNoz.
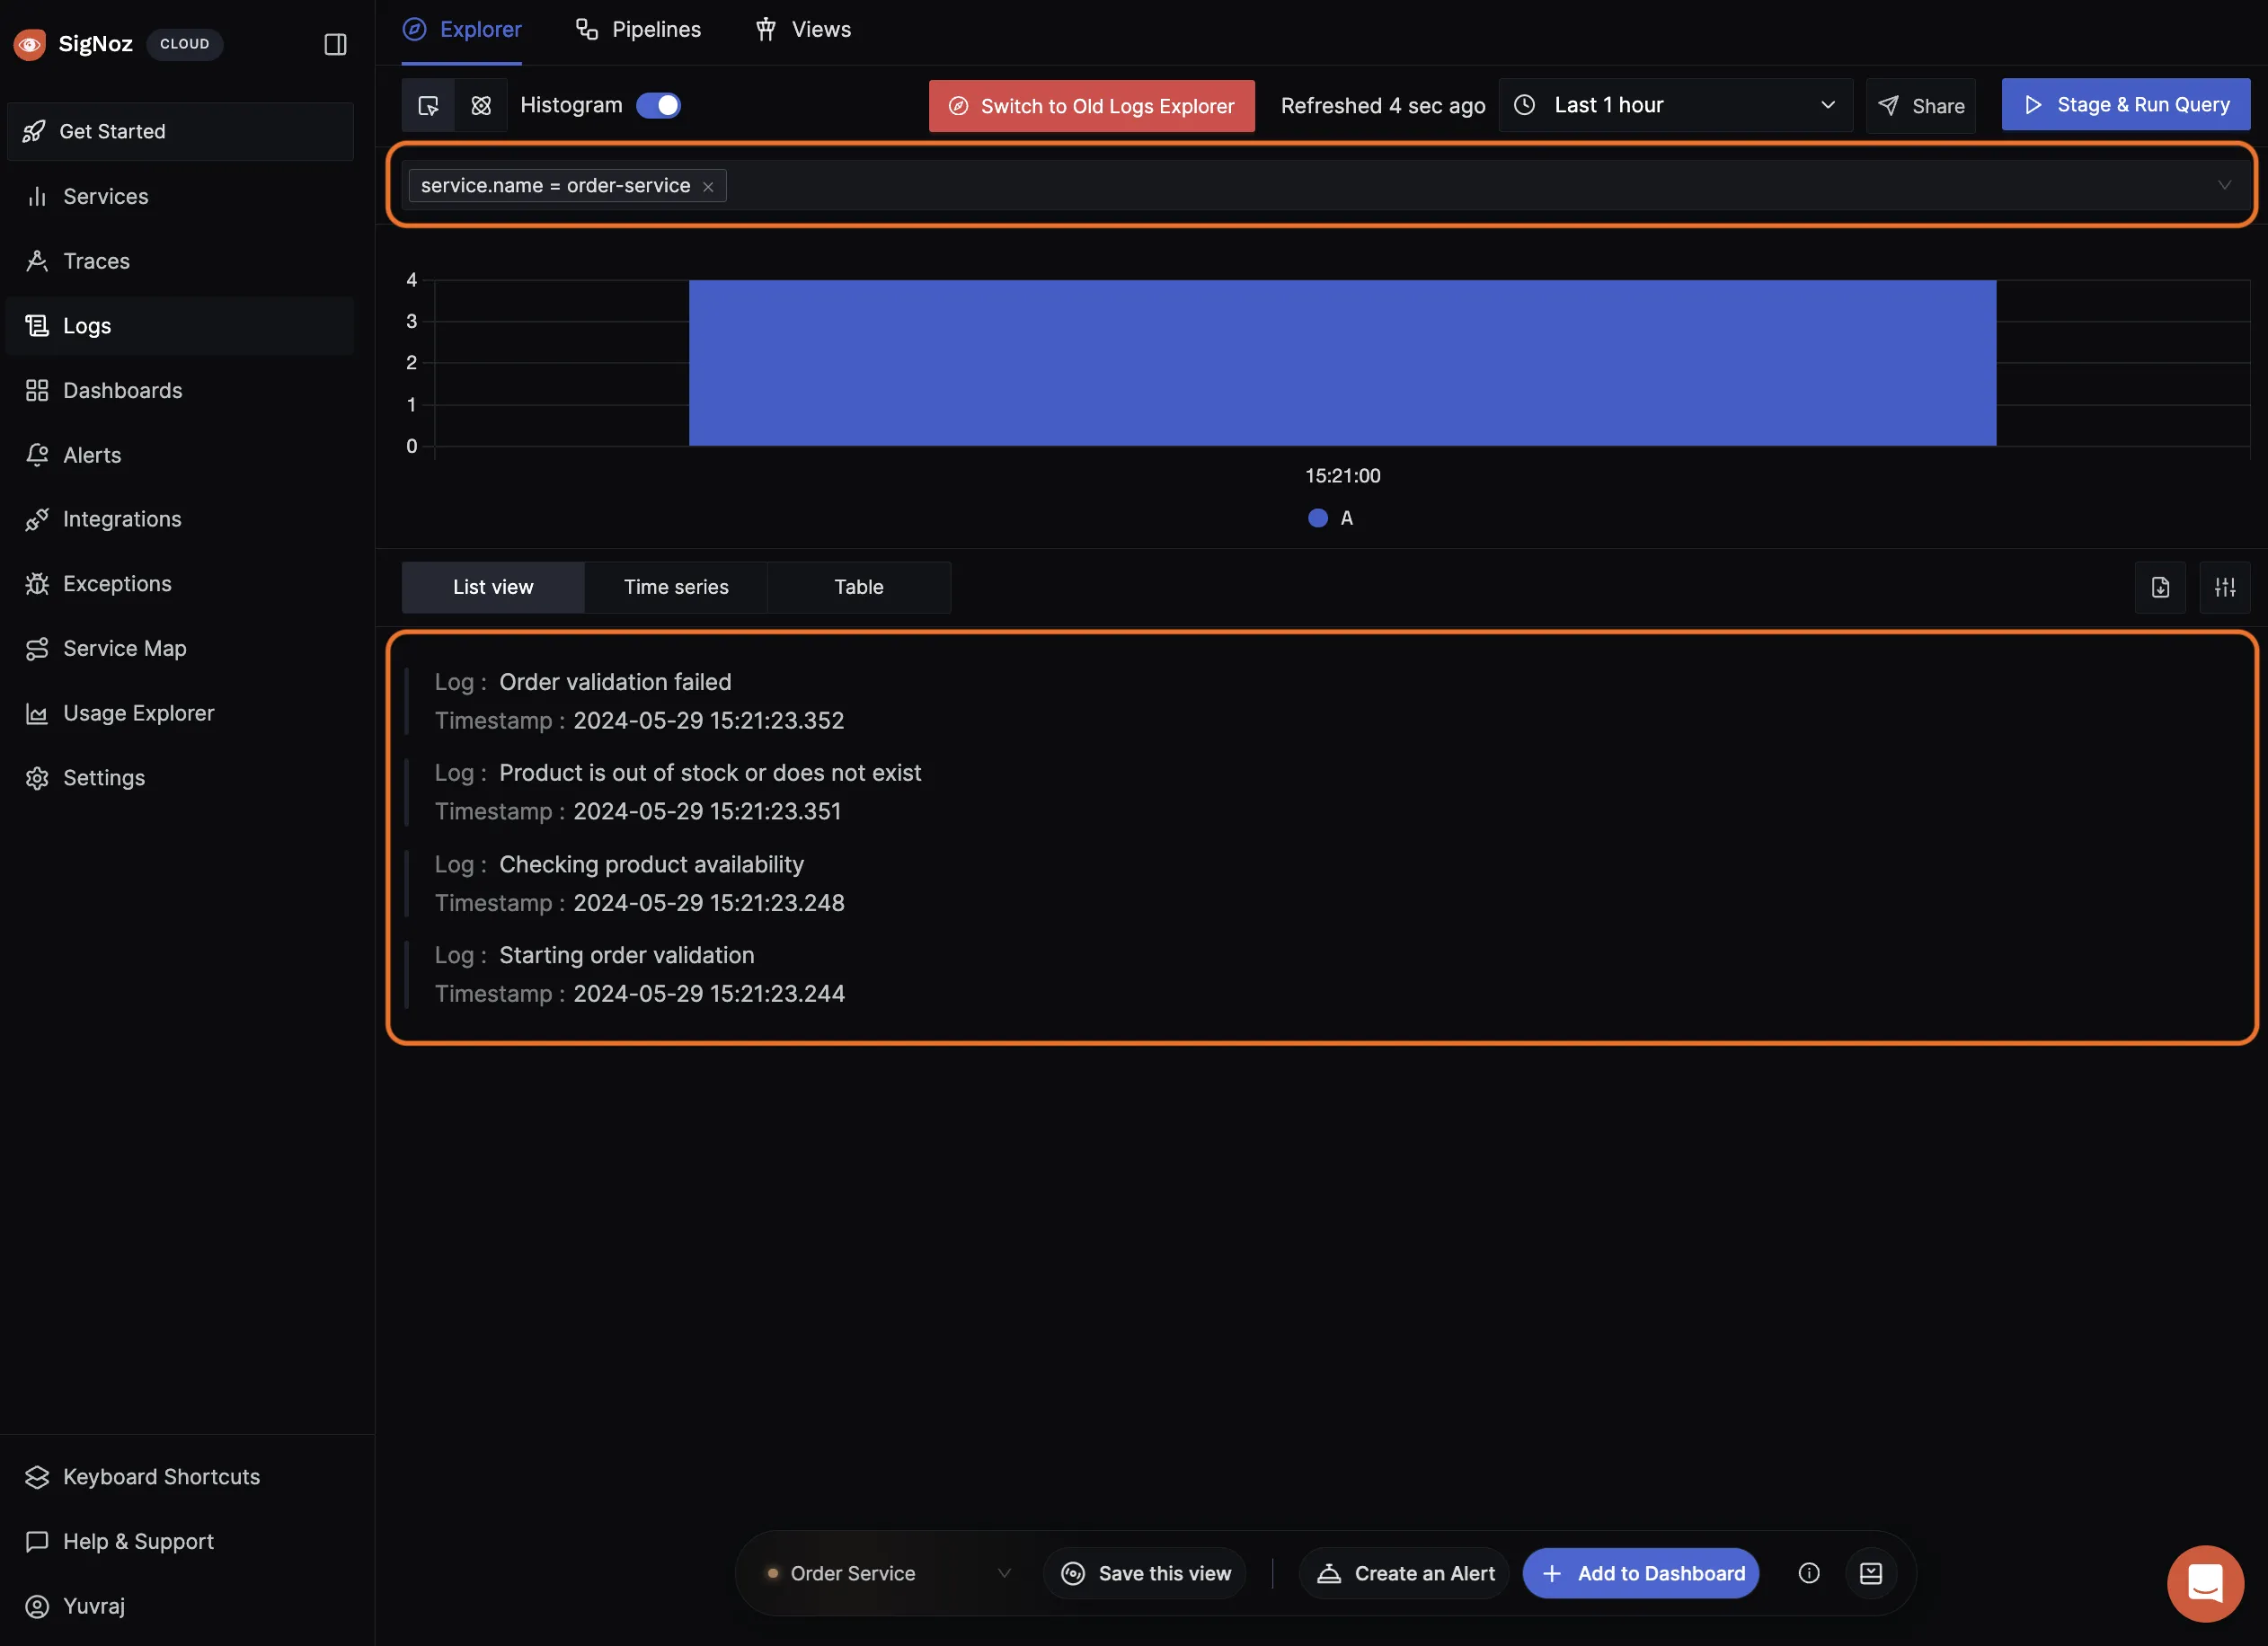
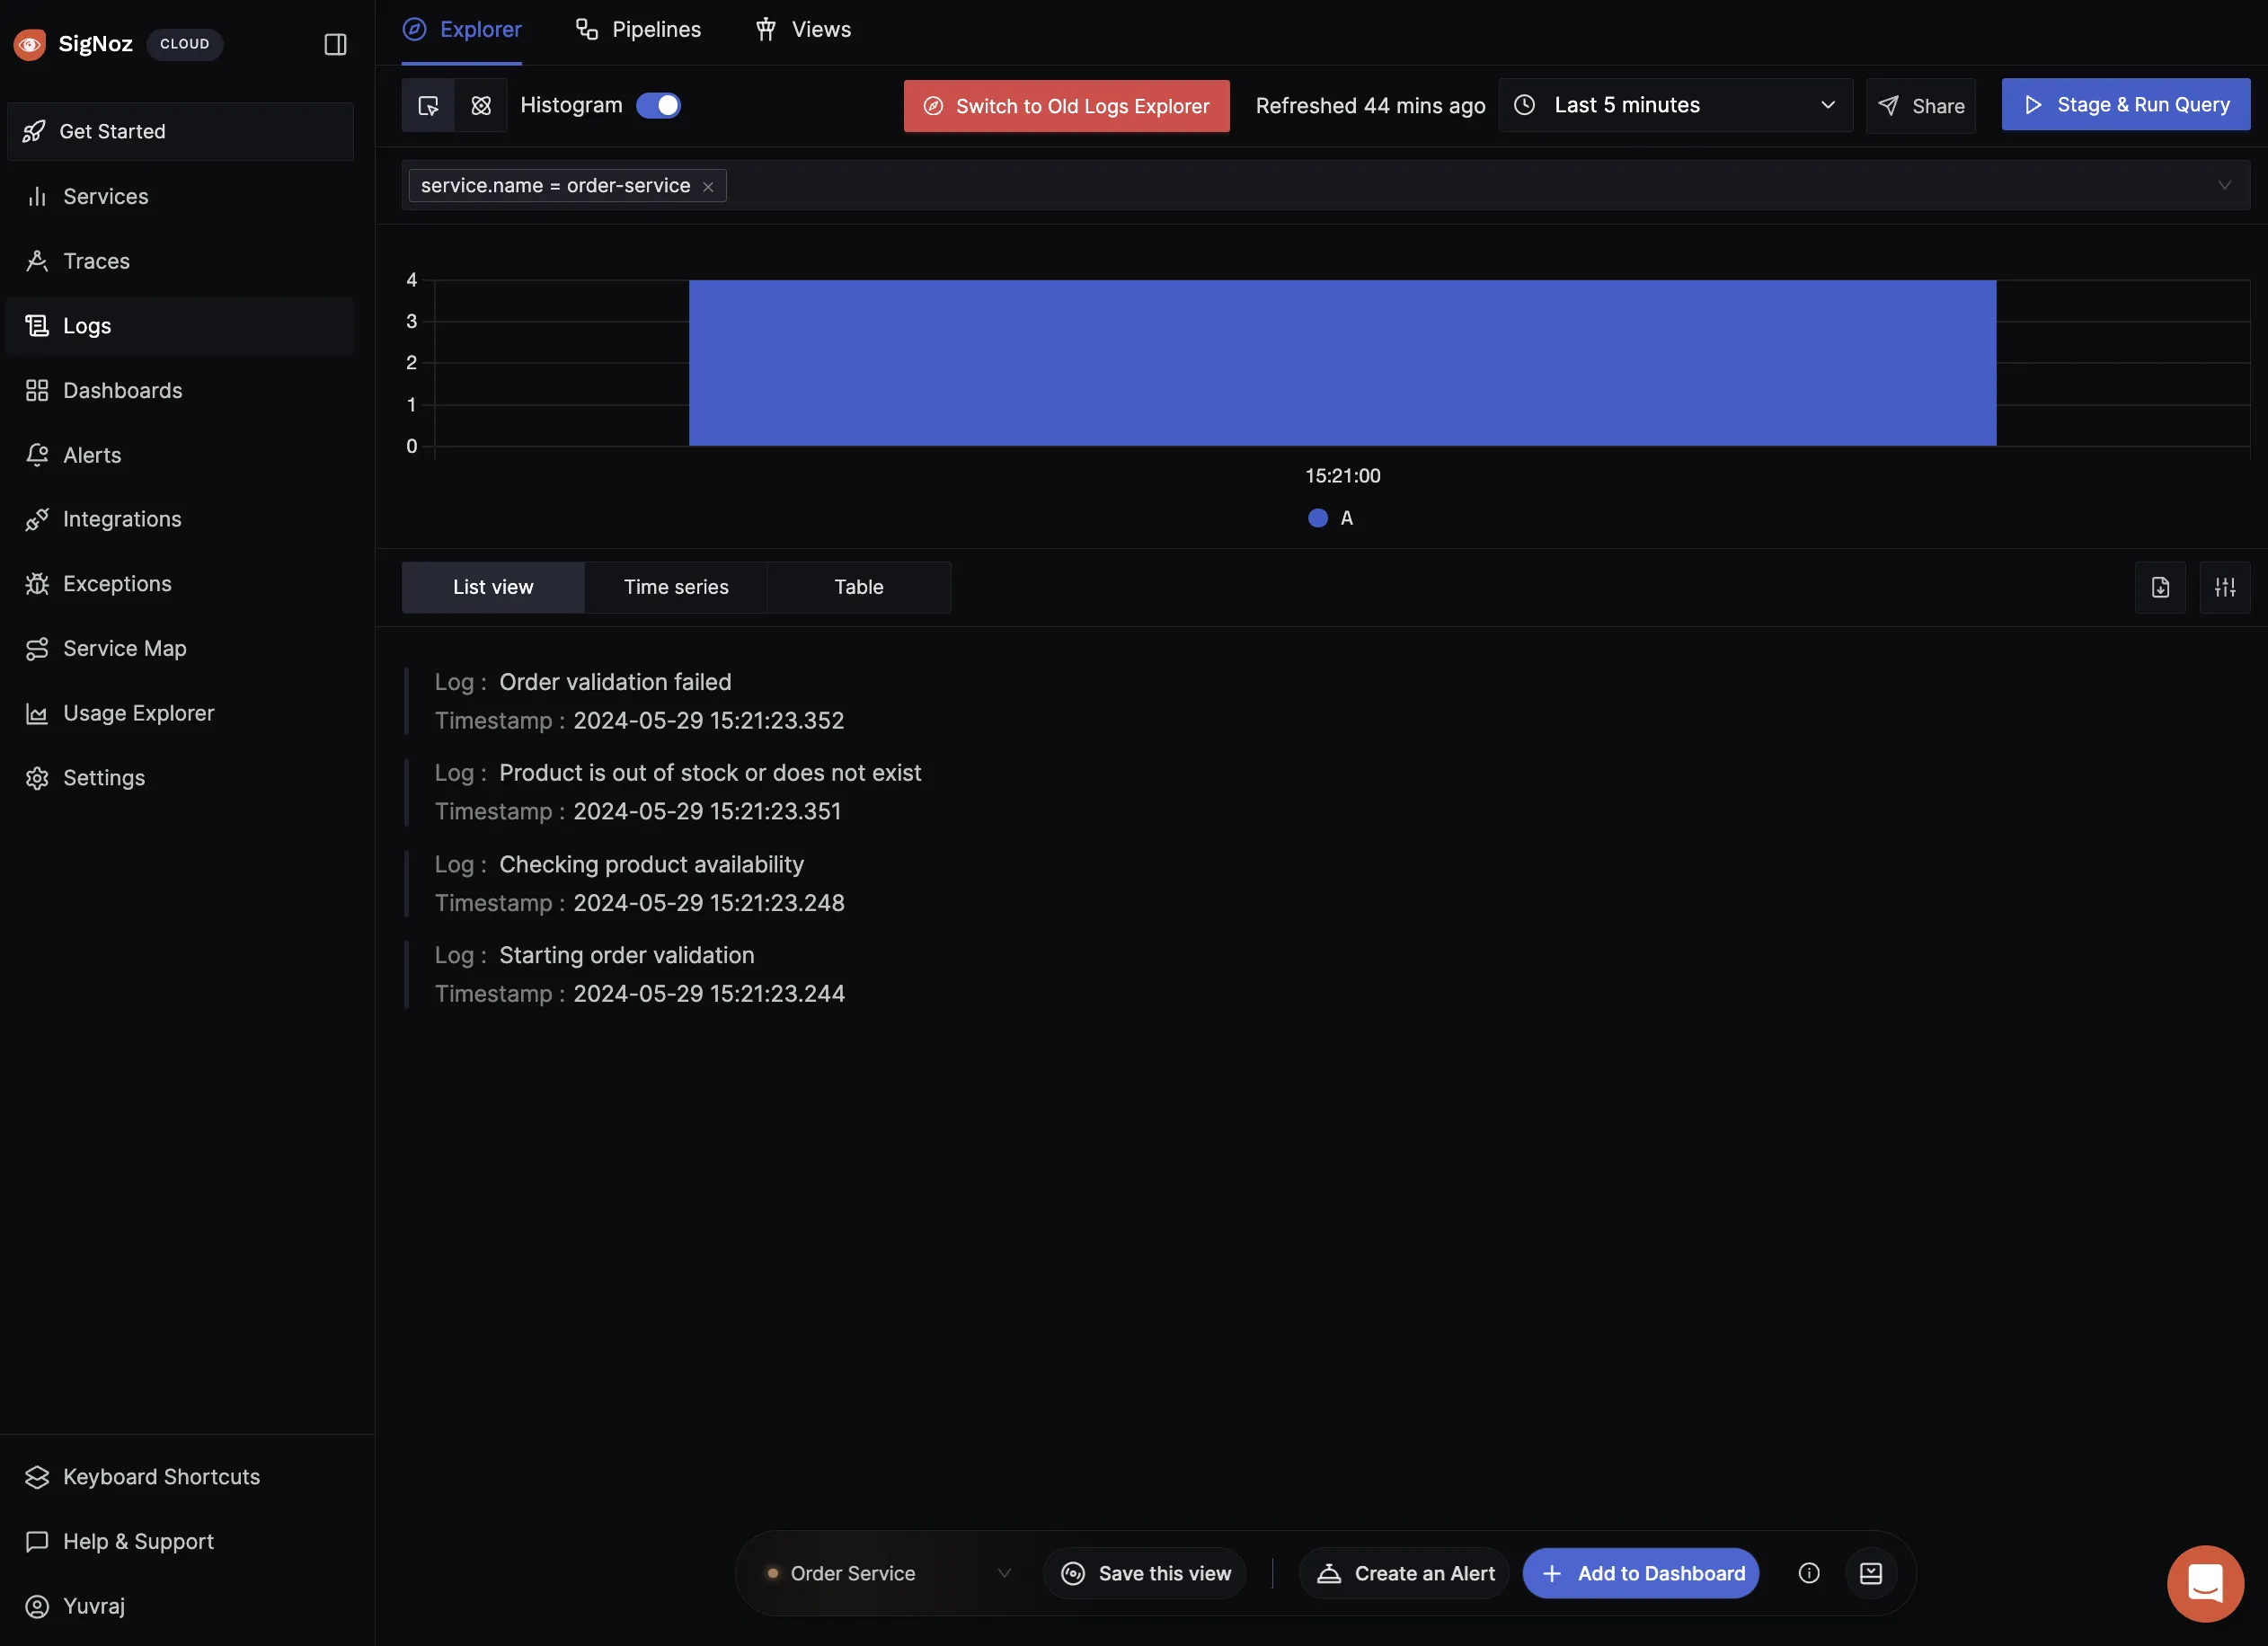
We can use the query builder to filter logs for a particular service as follow:
Best Practices for Logging in Microservices
- Logging Levels: Use different logging levels (info, warn, error) to categorize the significance of log messages.
- Message Clarity: Ensure log messages are clear and provide sufficient context.
- Security Considerations: Avoid logging sensitive information to protect user data and comply with regulations.
Exercise: Implementing Logging in Product Service
As an exercise to learn: For the Product service, consider logging inventory updates and any critical changes affecting product availability.
Conclusion
- Structured Logging Integration: We integrated Pino, a structured logging library, within the Order service, demonstrating how to enrich logging statements with detailed, contextual information like order IDs and validation results.
- Log Routing: We set up Logspout in our Docker environment to capture container logs and route them to the OpenTelemetry Collector.
- OpenTelemetry Collector Configuration: Modifications were made to the OpenTelemetry Collector configuration to accept logs from the Logspout service, demonstrating how logs are processed and forwarded to SigNoz.
- Visualization in SigNoz: By configuring SigNoz to receive structured logs, we showed how these logs can be visualized and queried, enhancing the monitoring capabilities and providing deeper insights into the system’s operational health.
Structured logging in microservices enhances observability, providing clear insights into application behaviors and aiding in quick troubleshooting. This approach ensures that both operational visibility and system reliability are maintained at high standards.
Next Steps: We will now see how to correlate traces, metrics, and logs in SigNoz.
Read Next Article of OpenTelemetry NodeJS series on Correlating Traces, Logs, and Metrics - OpenTelemetry NodeJS
