Exploring Metrics created via Traces in SigNoz - OpenTelemetry NodeJS
Metrics are fundamental to monitoring the performance and health of applications. They provide quantitative data that can be used to understand how your application is behaving over time. In this article, we will explore how OpenTelemetry traces can generate valuable metrics and how these metrics can be visualized in SigNoz.
Prerequisites
Before proceeding, ensure you have completed the previous article on autoinstrumentation for traces. You should also have a basic understanding of metrics in the context of observability.
What are Metrics and Why are They Helpful?
Metrics are numerical data points that represent the state or performance of various aspects of an application. They help in monitoring and understanding the behavior of the system. Common types of metrics include:
- Counters: Metrics that only increase, such as the number of requests received.
- Gauges: Metrics that can go up and down, such as current memory usage.
- Histograms: Metrics that track the distribution of values, such as response time.
Metrics are helpful because they provide:
- Real-time insights into application performance.
- Historical data to track trends and changes over time.
- Alerts and thresholds to notify when something goes wrong.
Generating Metrics from Traces
Traces provide detailed information about the flow of requests through your services. By analyzing these traces, you can generate various metrics that reflect the performance and health of your application. Some common metrics derived from traces include:
- Request Count: The number of requests handled by a service.
- Error Rate: The percentage of requests that resulted in errors.
- Latency Distribution: The time taken to process requests.
Visualizing Metrics in SigNoz
SigNoz automatically derives fundamental metrics from the traces collected via OpenTelemetry. This makes it easy to visualize key performance indicators without additional configuration.
Auto-Generated Metrics Dashboards
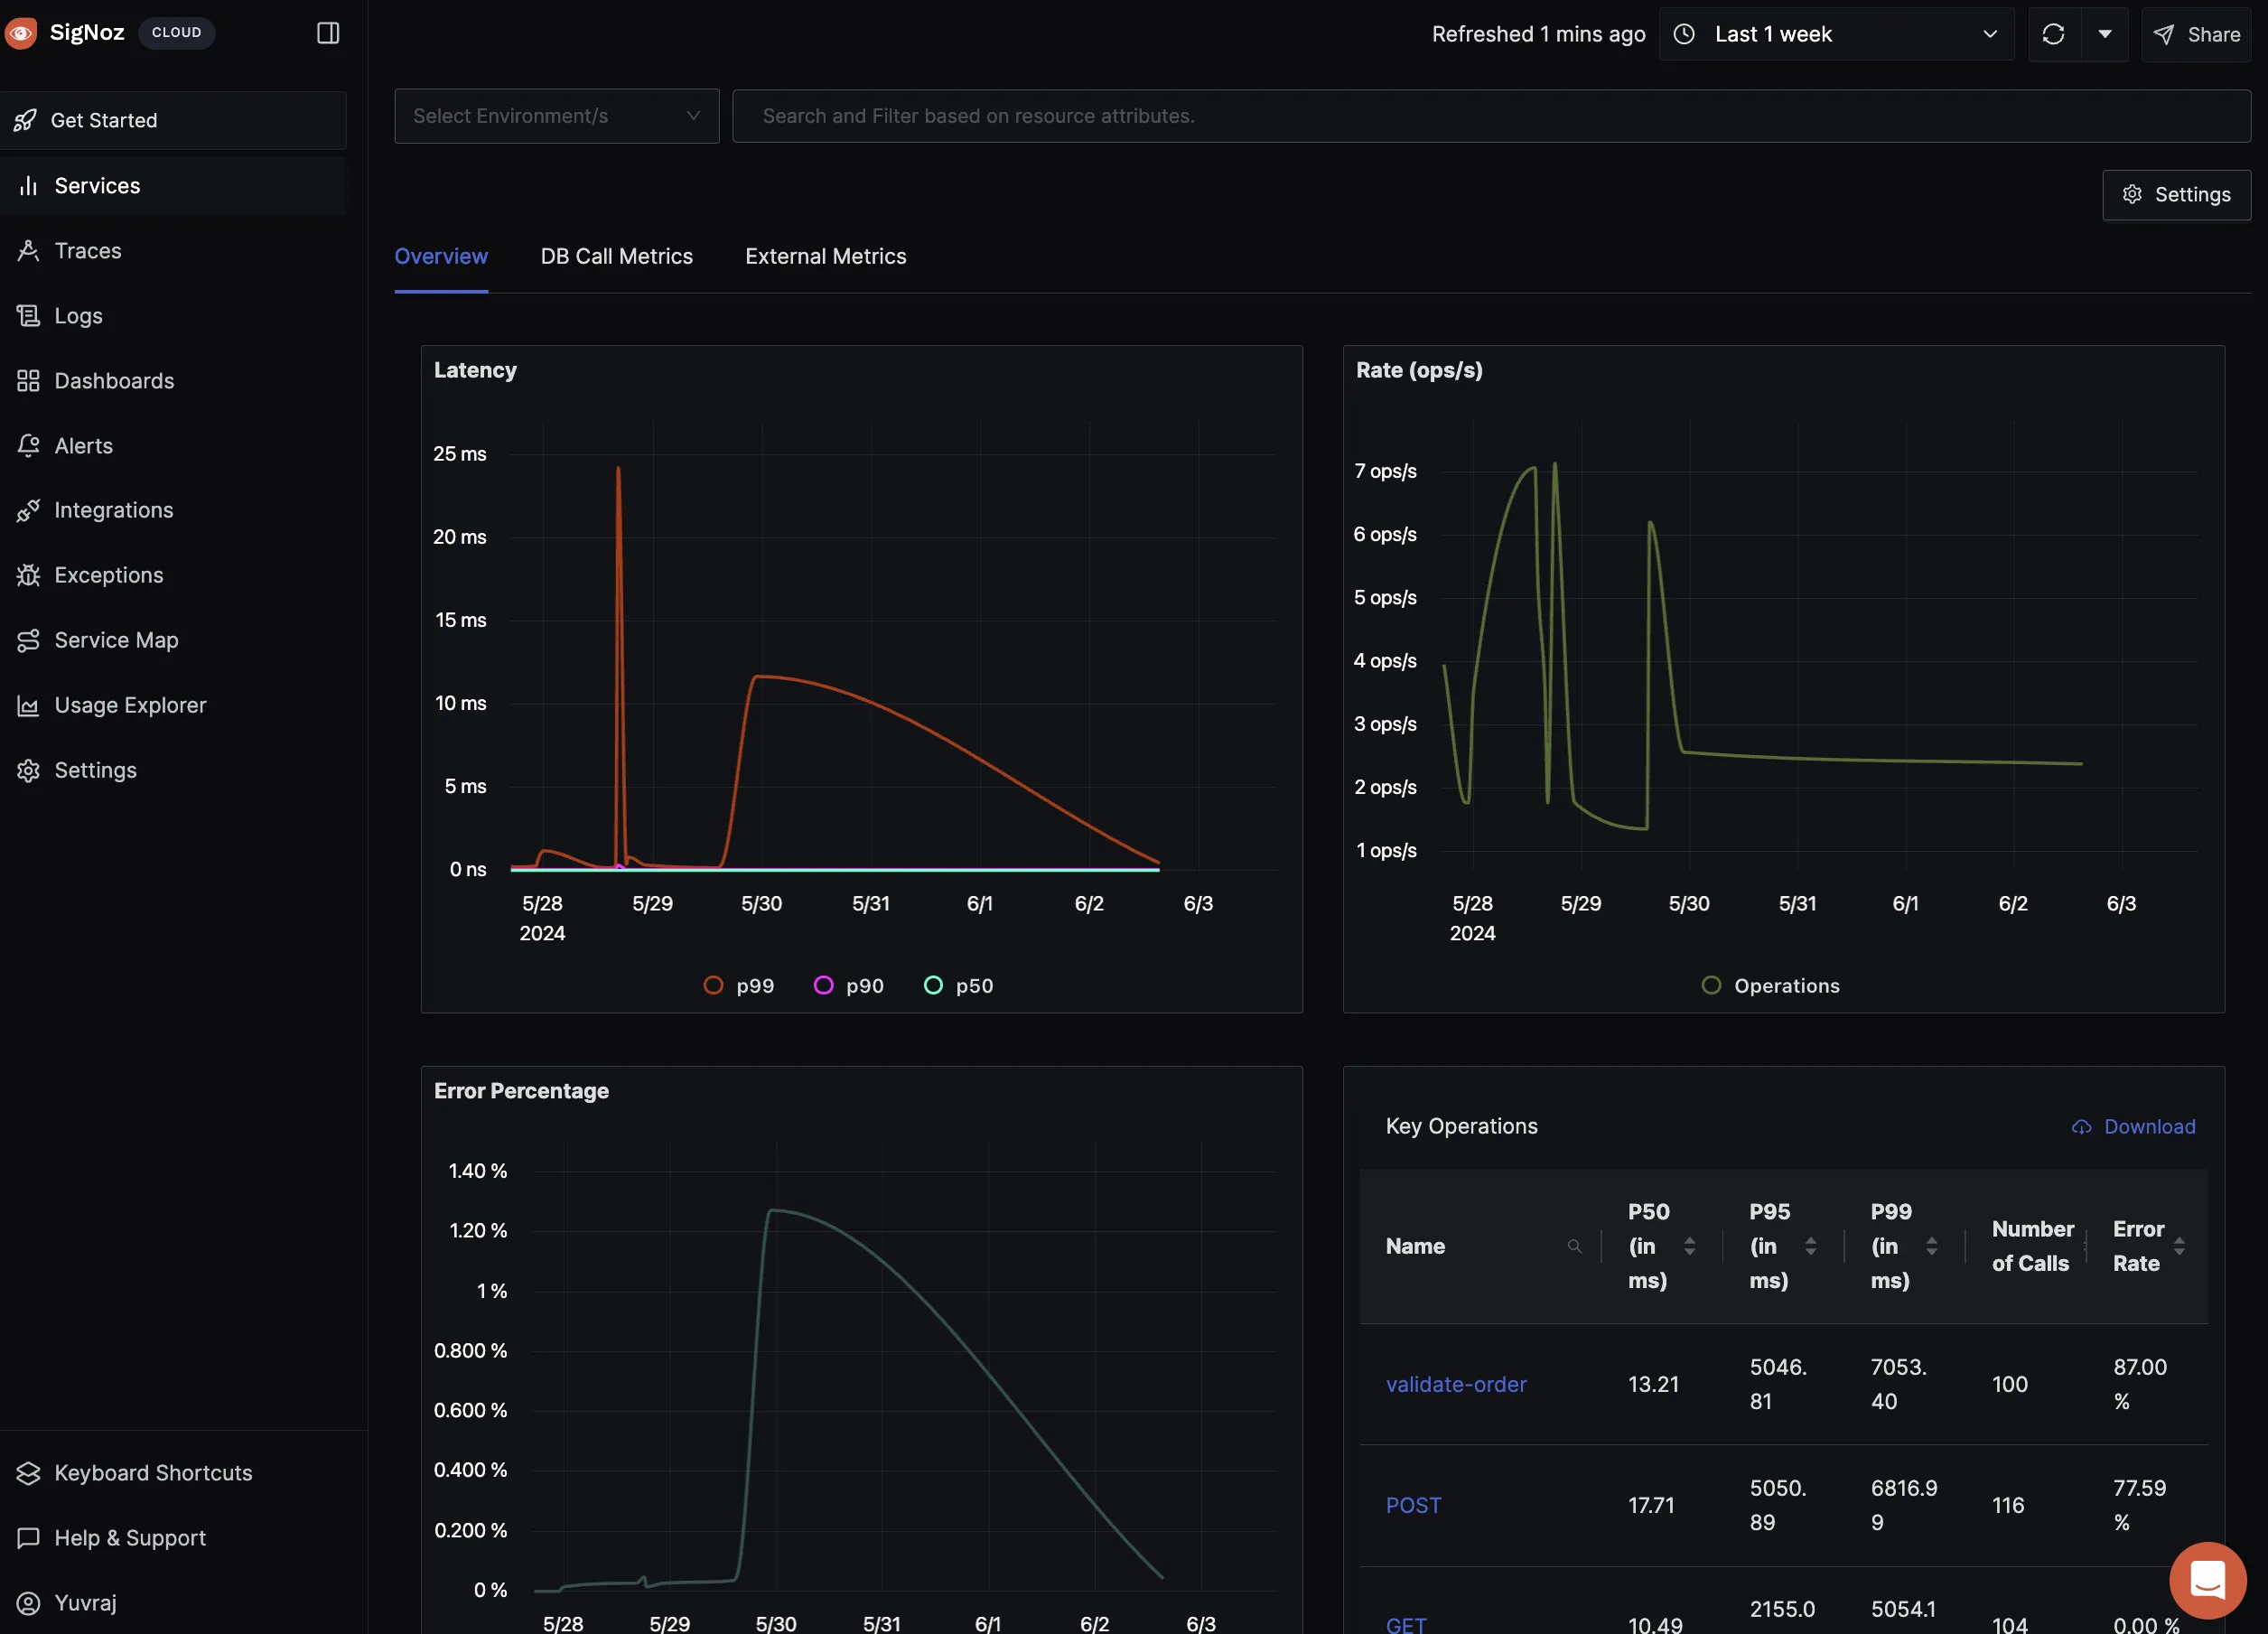
Once your services are instrumented with OpenTelemetry and sending traces to SigNoz, you can access the metrics dashboards in SigNoz. These dashboards provide a comprehensive view of the performance metrics derived from your traces.
- Latency Metrics: Distribution of request processing times.
- Request Rate: Number of requests per second.
- Error Rate: Percentage of failed requests.
Interpreting Metric Visualizations
Understanding the visualizations in SigNoz helps you gain insights into your application's performance. Some key visualizations include:
- Latency Metrics: Identify slow requests and performance bottlenecks.
- Request Rate: Monitor traffic patterns and load.
- Error Rate: Detect and respond to failures quickly.
Common Issues and Troubleshooting
While working with metrics, you might encounter some common issues. Here are a few tips to help you troubleshoot:
- Missing Metrics: Ensure that traces are correctly sent to SigNoz and that your services are instrumented properly.
- Incorrect Metrics: Double-check your environment variables and configurations to ensure they are set correctly.
- Visualization Issues: Refresh the SigNoz dashboard and verify that the data is up-to-date.
Conclusion
- Importance of Metrics: Metrics provide essential insights into the performance and health of your application.
- Generating Metrics from Traces: OpenTelemetry traces can be used to generate valuable metrics automatically.
- Visualizing Metrics in SigNoz: SigNoz provides powerful dashboards to visualize and interpret metrics derived from traces.
By understanding and utilizing these metrics, you can monitor your application more effectively, identify performance bottlenecks, and ensure a smooth user experience. In the next article, we will delve deeper into manual instrumentation techniques with OpenTelemetry to enhance your observability setup further.
