14,000+ GitHub stars, 4 Million Docker Downloads, in-context Logs and a Team Workation - SigNal 28
"Take risks in your life. If you win, you may lead; if you lose, you may guide.” Swami Vivekananda
Welcome to the 28th edition of our monthly product newsletter - SigNal 28! Our team shipped many features and improvements last month. We also had an amazing team workation in Goa, India.

Let’s dive in to see what humans at SigNoz were up to in the month of August 2023.
What we shipped?
We shipped new features like Apdex score, saved views, live view in new logs explorer, in-context logs and OpsGenie integration in our latest releases. We also shipped a lot of improvements to log management in SigNoz.
Latest release - v0.28.0
Earlier Releases - v0.27.0, v0.26.1, v0.26.0
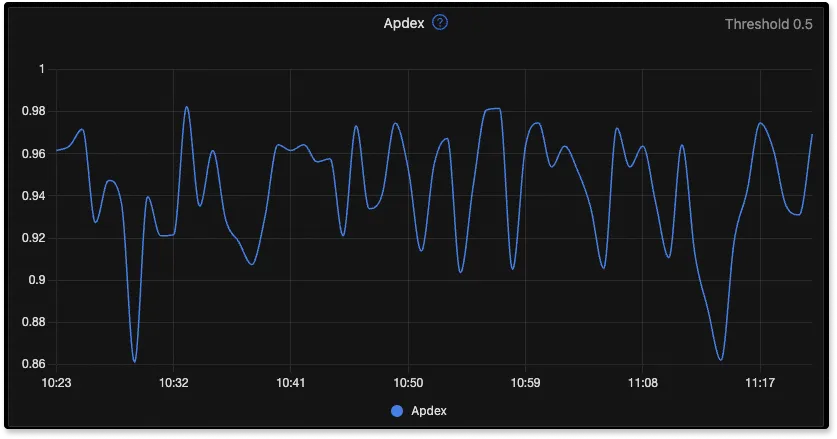
Apdex score
Apdex score is an open standard used to measure user satisfaction with the response time of application services. You can now get an Apdex score for your services in APM charts provided by SigNoz.
Save View for Explorer Pages
Our new explorer pages for logs now come with an option to Save View. You can also share the view with your teammates. Here’s a quick demo of how to use the feature.
OpsGenie Integration
We are building more alert channel integrations to cover the wide range of use cases of our users. You can now integrate alerts from SigNoz with OpsGenie. Here’s a guide on setting up alerts in SigNoz.
Just-in-time provisioning of SSO users
We have shipped just-in-time provisioning of SSO users for our enterprise customers. With this, our users can automate user account creation when the user first tries to perform SSO.
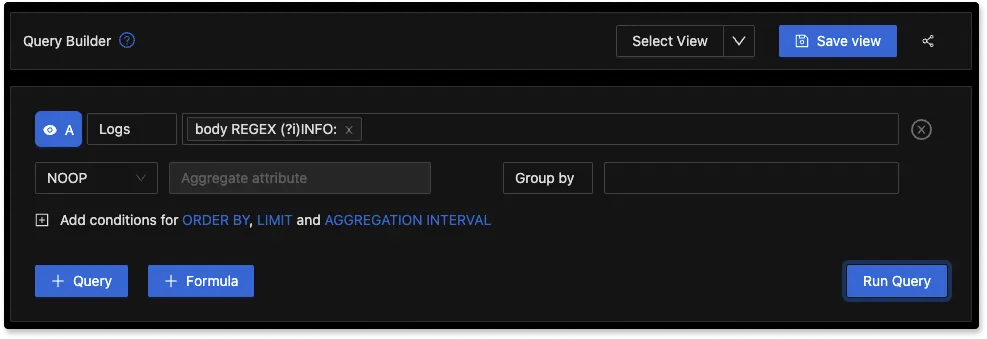
Regex support in Explorer Pages
Regex is now supported in the query builder of our new explorer pages. It will help developers write complex queries to search and filter logs and traces.
infoImprovements in Logs Management
We shipped improvements to log management in SigNoz.
With the latest release, you can have the same attributes with multiple data types. For example,
statuscan exist as a string with valuesok/fail, etc., andstatuscan exist as int with values200/202, etc. (Related PR)Previously, the docker container logs didn’t have
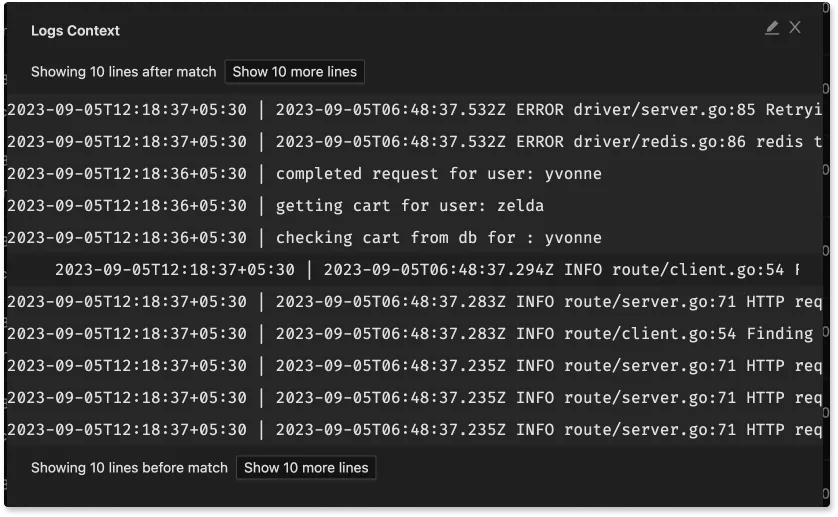
container_nameby default, because of which it was difficult to filter out logs by a container name. We have added Logspout as the default docker logs collector. Now, the container name is added to the metadata of logs. (Related PR)Check nearby lines of logs with in-context logs. (Related PR)
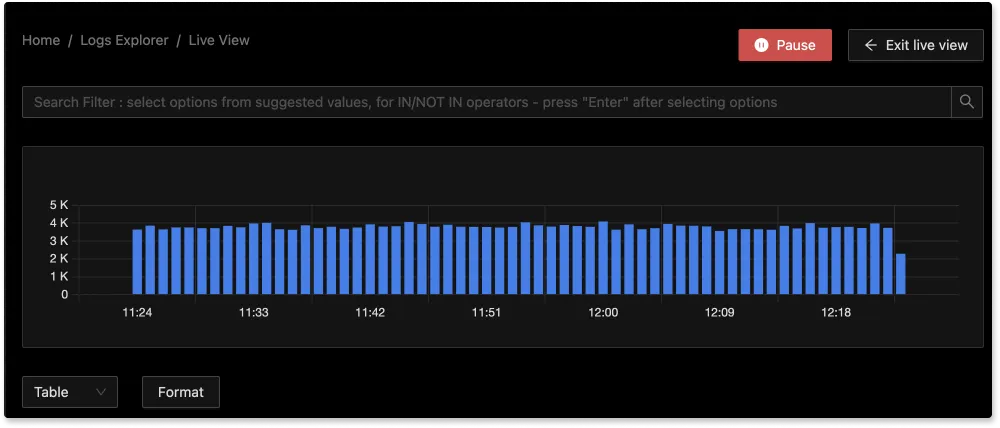
- Live view of Logs in Explorer pages. (Related PR)
We have added a Logs live view on the new Logs Explorer page.
A New Demo Video for SigNoz 📹
Learn more about what SigNoz can do - please check out our new demo video covering all the features that SigNoz offers:
OpenTelemetry Webinars
At SigNoz, we firmly believe that OpenTelemetry is the bedrock of open-source observability. To help the community understand the benefits of using OpenTelemetry and the right way to implement OpenTelemetry in your application, we have started doing live webinars. The first two of the series are out.
Getting Started with OpenTelemetry
Learn how to get started with OpenTelemetry. Some important concepts that are discussed in this webinar:
- What should you instrument first
- Infrastructure metrics
- Where to send data & much more
Check out the entire talk here:
Gathering data with OpenTelemetry Collector
In this webinar, we discuss architecting and collecting data with the OpenTelemetry Collector. We discuss using Apache Kafka queues to handle OTLP data, and why you probably shouldn't push OTel data straight to Postgres.
SigNoz News
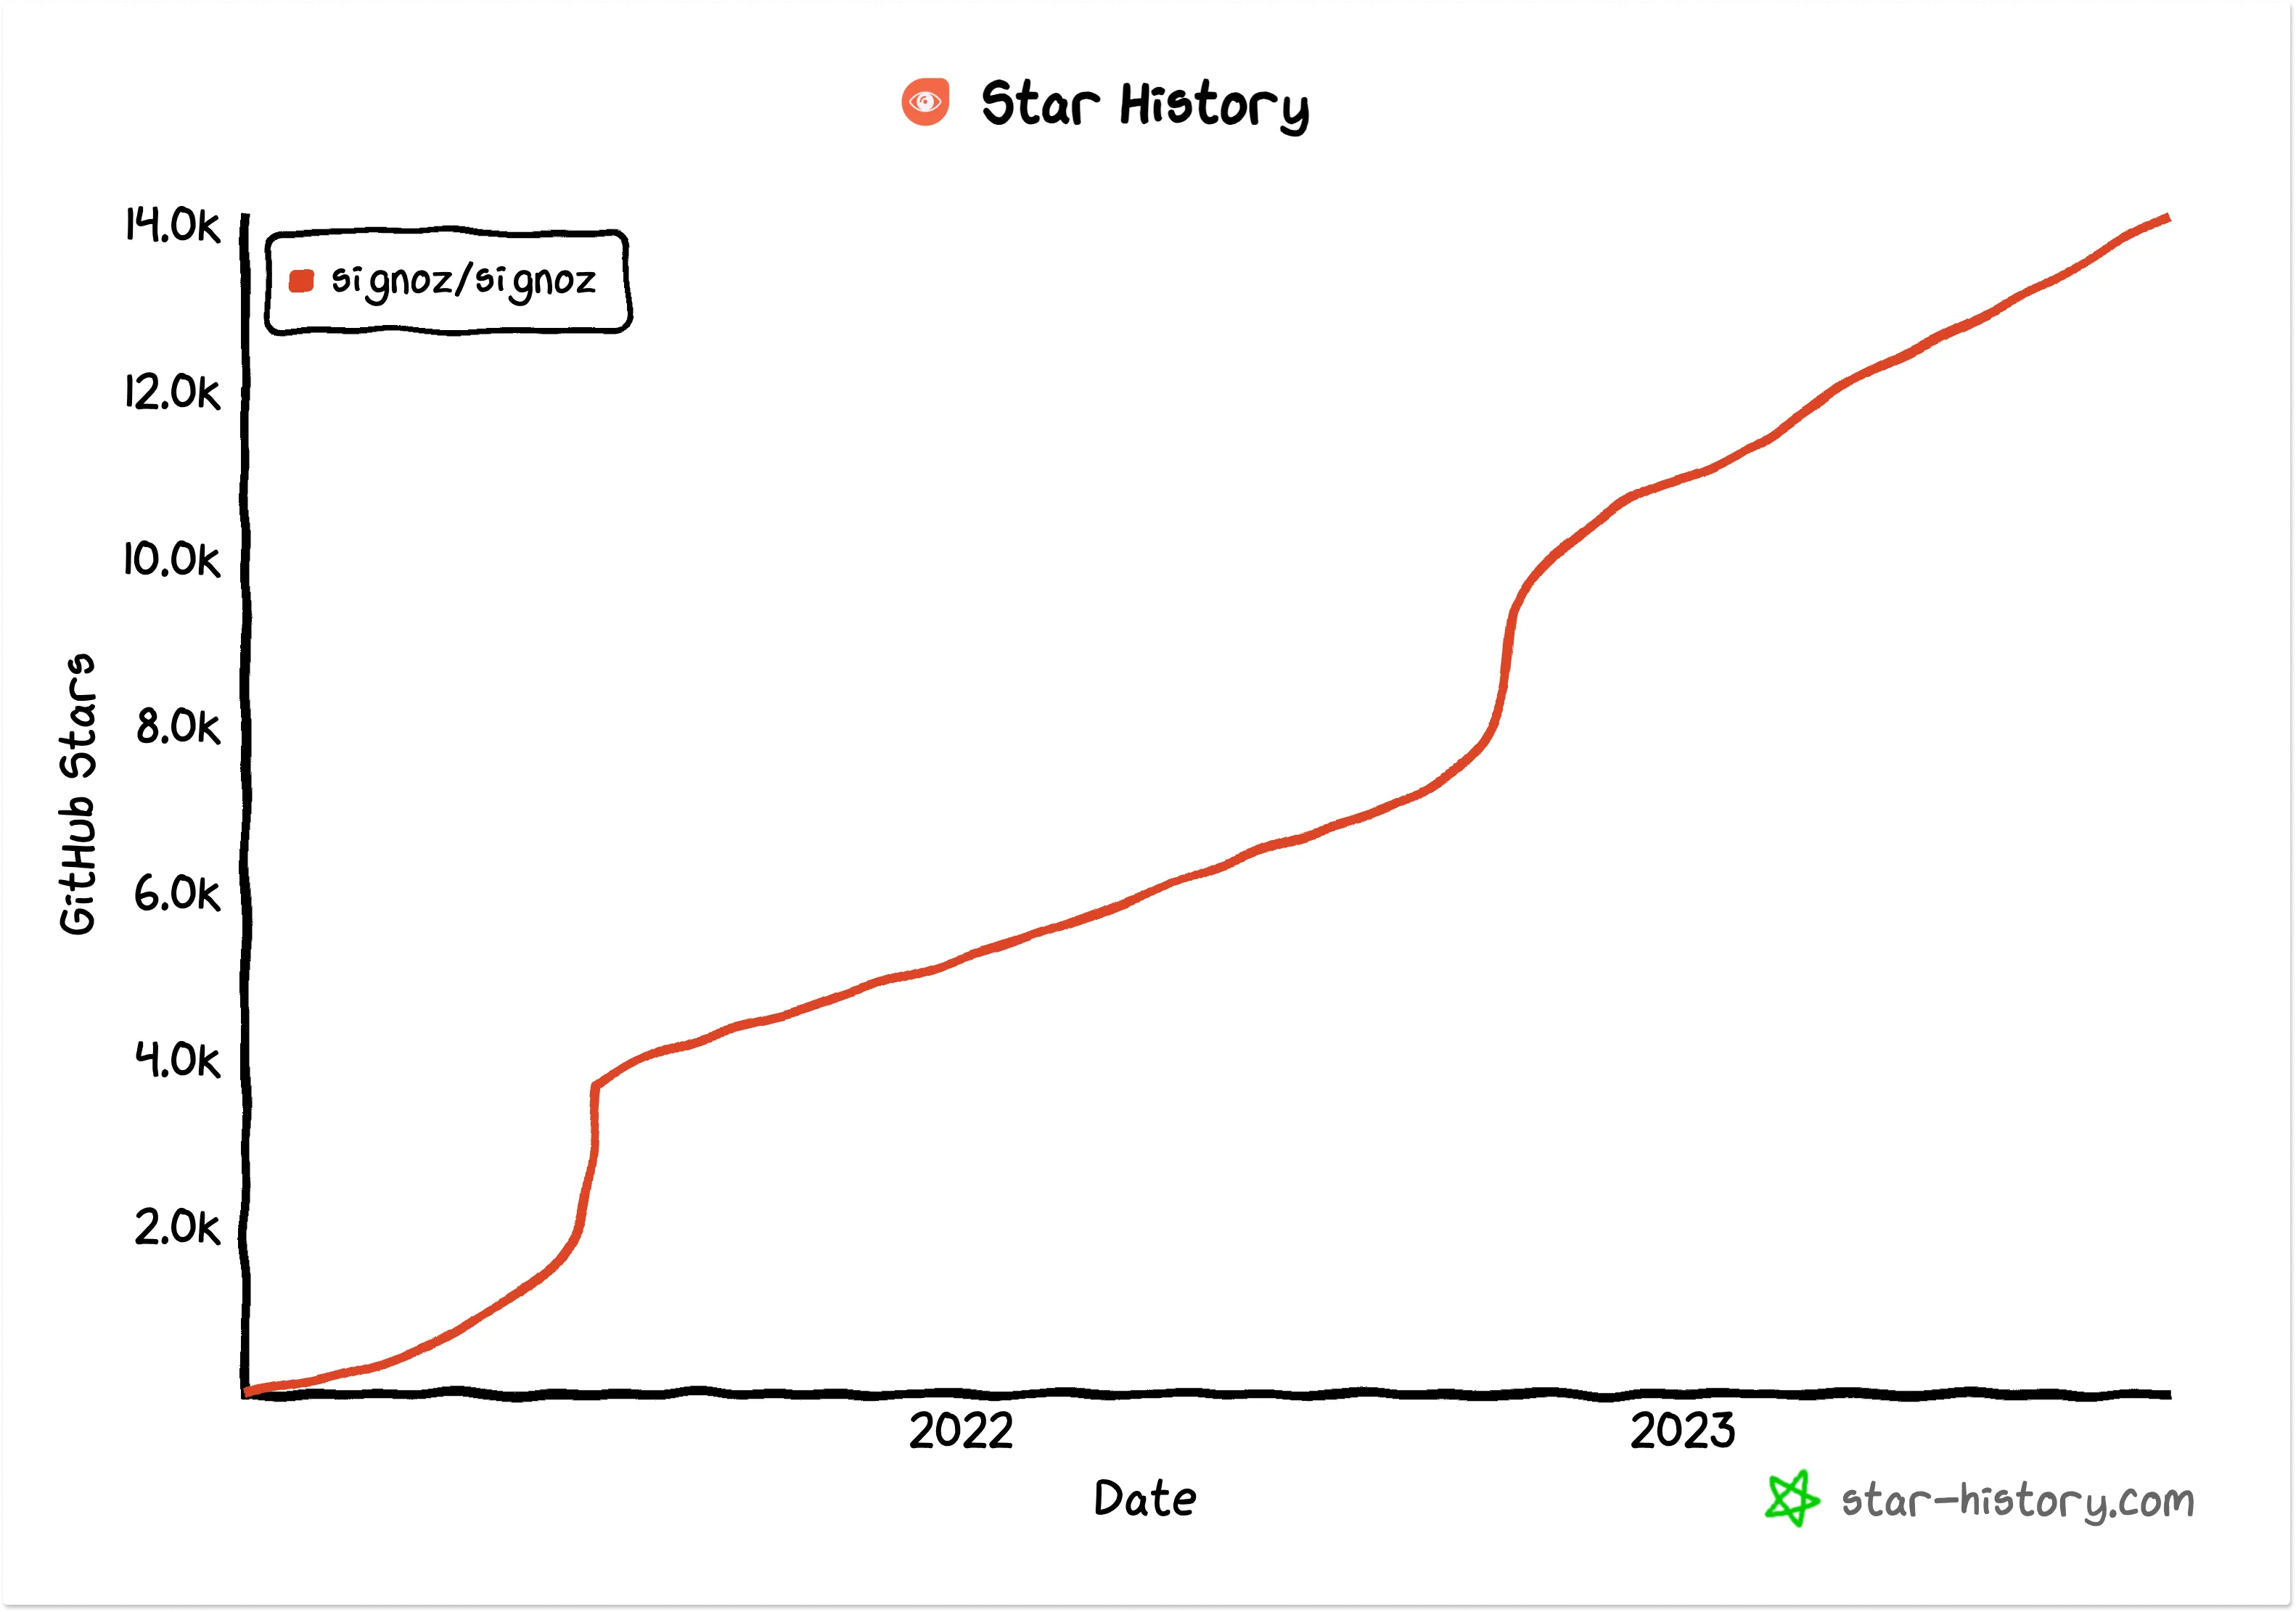
Crossed 14,000+ GitHub stars
We recently crossed 14,000+ stars on GitHub. Our mission is to democratize observability for engineering teams of all sizes. It amazes us to see the love and support of the dev community for our open-source project.
Crossed 4 Million Docker Downloads
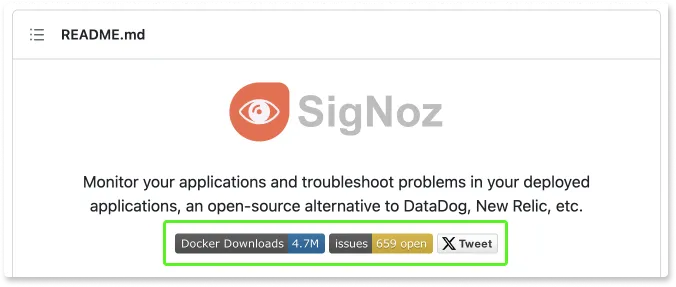
We crossed 4 million Docker downloads for our open-source project. 🥳 It’s incredibly humbling to see the impact of SigNoz across the globe in helping developers build better applications.
Team Workation in Goa
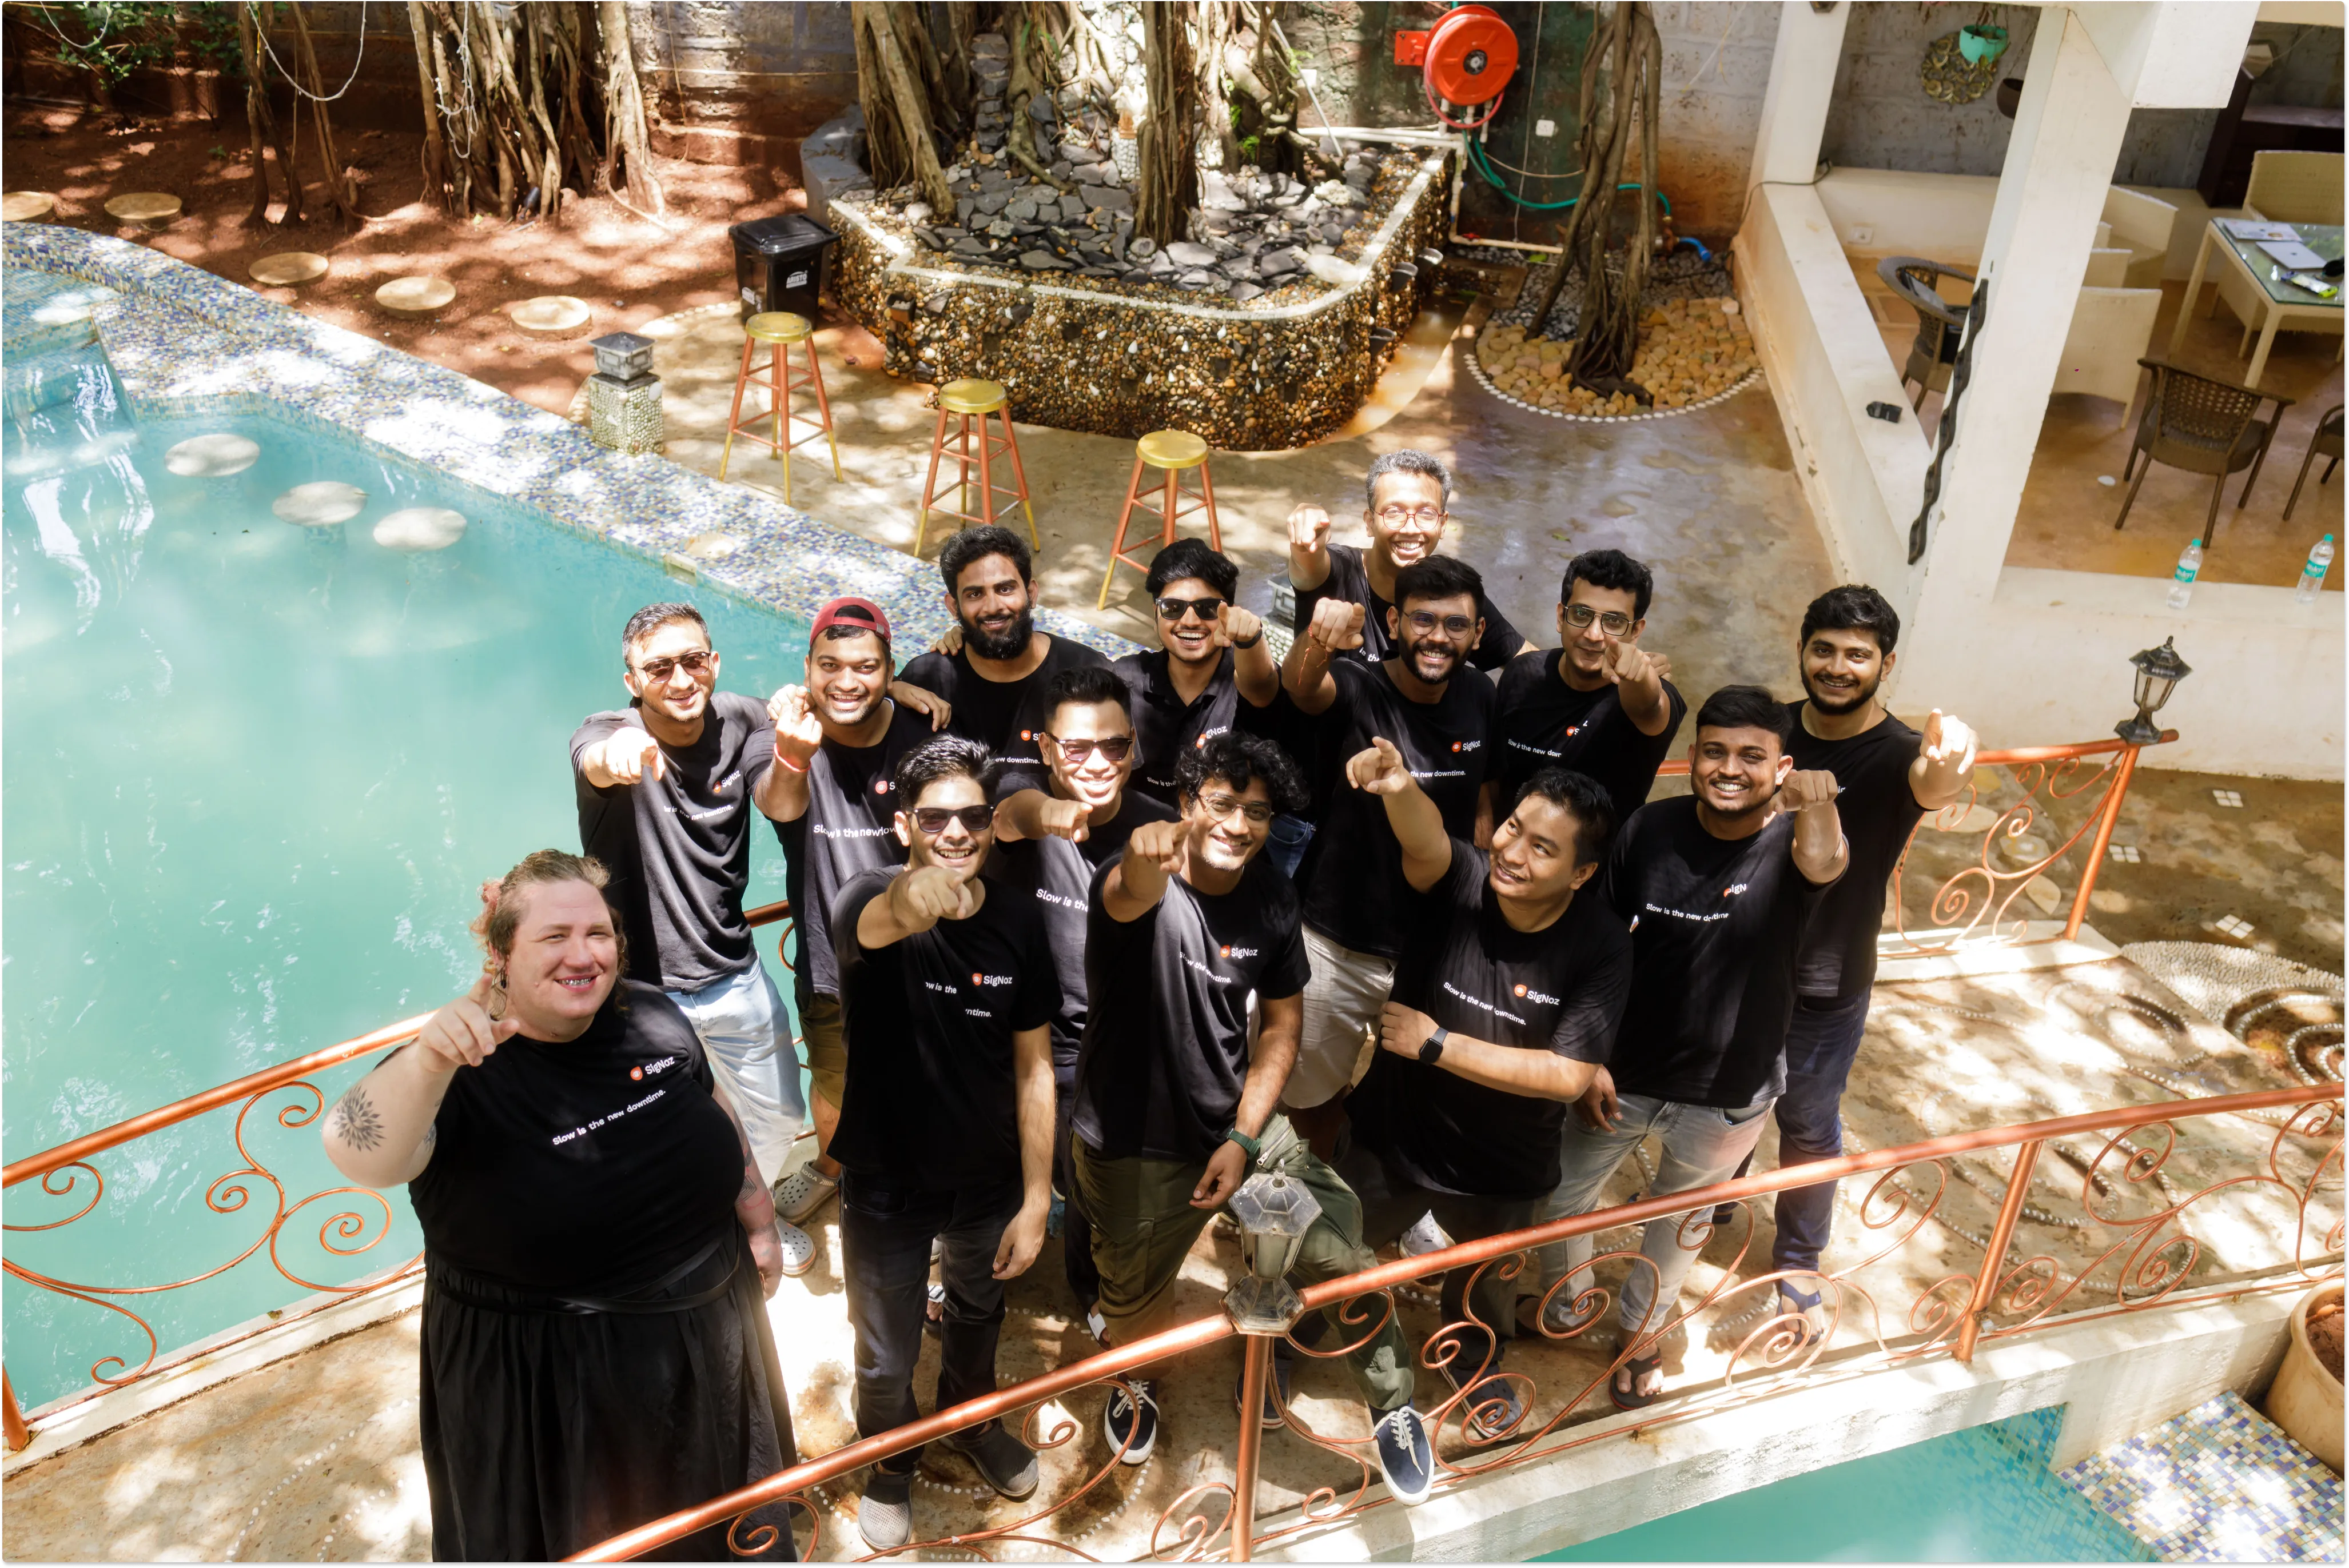
Our team met for an offsite in Goa in the last week of August. It was so much fun interacting with everyone, discussing our future goals, and celebrating what we have accomplished till now! 🤗
SigNoz on Jamstack Radio
Jamstack Radio - a Heavybit podcast on building fast and secure applications, invited Pranay to talk about open-source observability with SigNoz.
Check out this interesting talk on **application performance monitoring, insights on utilizing OpenTelemetry, and reasons to consider open-source observability solutions instead of those from SaaS vendors.
abc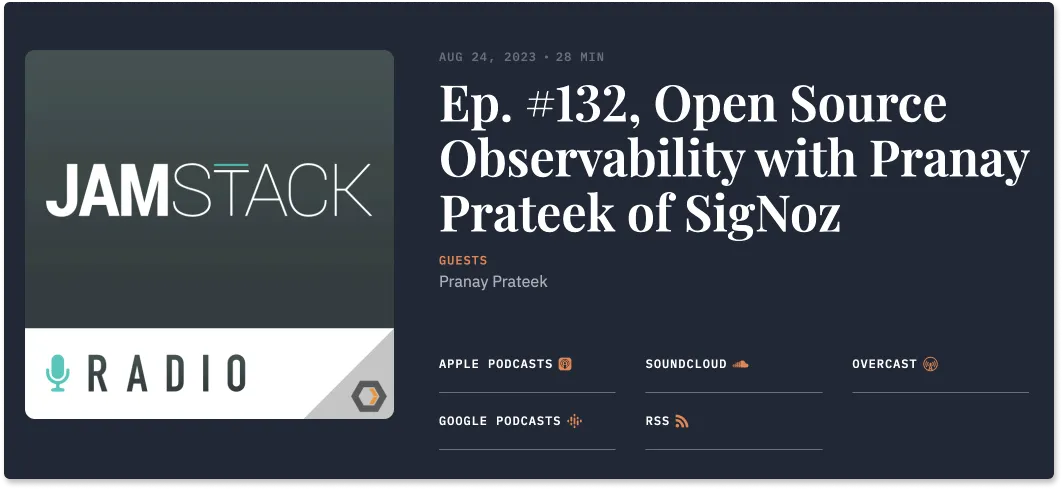
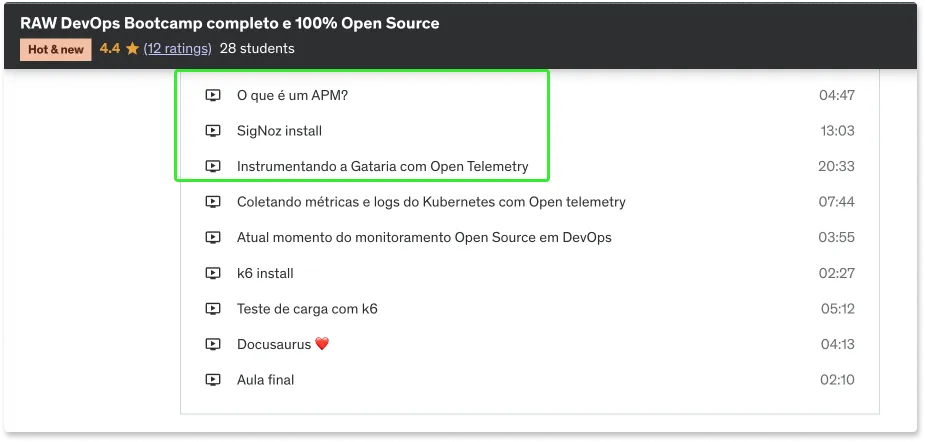
Udemy Course on SigNoz
Our community member, Paulo, has created an Udemy course for DevOps, which includes educating students on SigNoz for the monitoring module. We’re very grateful to Paulo and amazed by the love of the community for SigNoz.
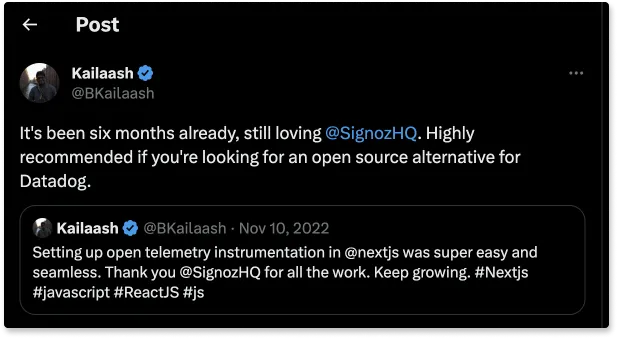
The enduring value that SigNoz brings!
We are pleased to see the long-lasting value that SigNoz provides to its users. If you’re looking for an open-source alternative to SaaS vendors like Datadog or Newrelic, SigNoz might be the right choice. You can get started here.
We’re Hiring!
We’re hiring the next set of rockstars to take SigNoz to the next level. You can look at open roles here.
If you know someone in your network who will be a good fit for SigNoz, please refer them.
Contributor Highlight
Every month, contributors from our community help make SigNoz better. We want to thank the following contributors who made contributions to SigNoz last month 🤗
From the blog
This guide is for anyone who is getting started monitoring their application with OpenTelemetry, and is generating unstructured logs.
Structured logs are ideal for post-hoc incident analysis and broad-range querying of your data. However, it’s not always feasible to implement highly structured logging at the code level. Read this guide on how to do log parsing with OpenTelemetry Collector.
Parsing logs with OpenTelemetry Collector
Thank you for taking out the time to read this issue :) If you have any feedback or want any changes to the format, please create an issue.
Feel free to join our Slack community and say hi! 👋

