7 Million Docker Downloads, uPlot Charting Library, and Improvements in Dashboard - SigNal 31
"The best way to get what you want in life is to deserve what you want. How could it be otherwise? The world is not crazy enough to look for a lot of undeserving people to reward.”
-Charlie Munger
Welcome to the 31st edition of our monthly product newsletter - SigNal 31! We shipped a lot of improvements in our dashboard user experience and crossed 7 million Docker downloads.

Let’s see what the humans of SigNoz did in the month of November 2023.
What we shipped?
Latest release - v0.34.3
Previous Releases - v0.34.2, v0.34.1, v0.34.0
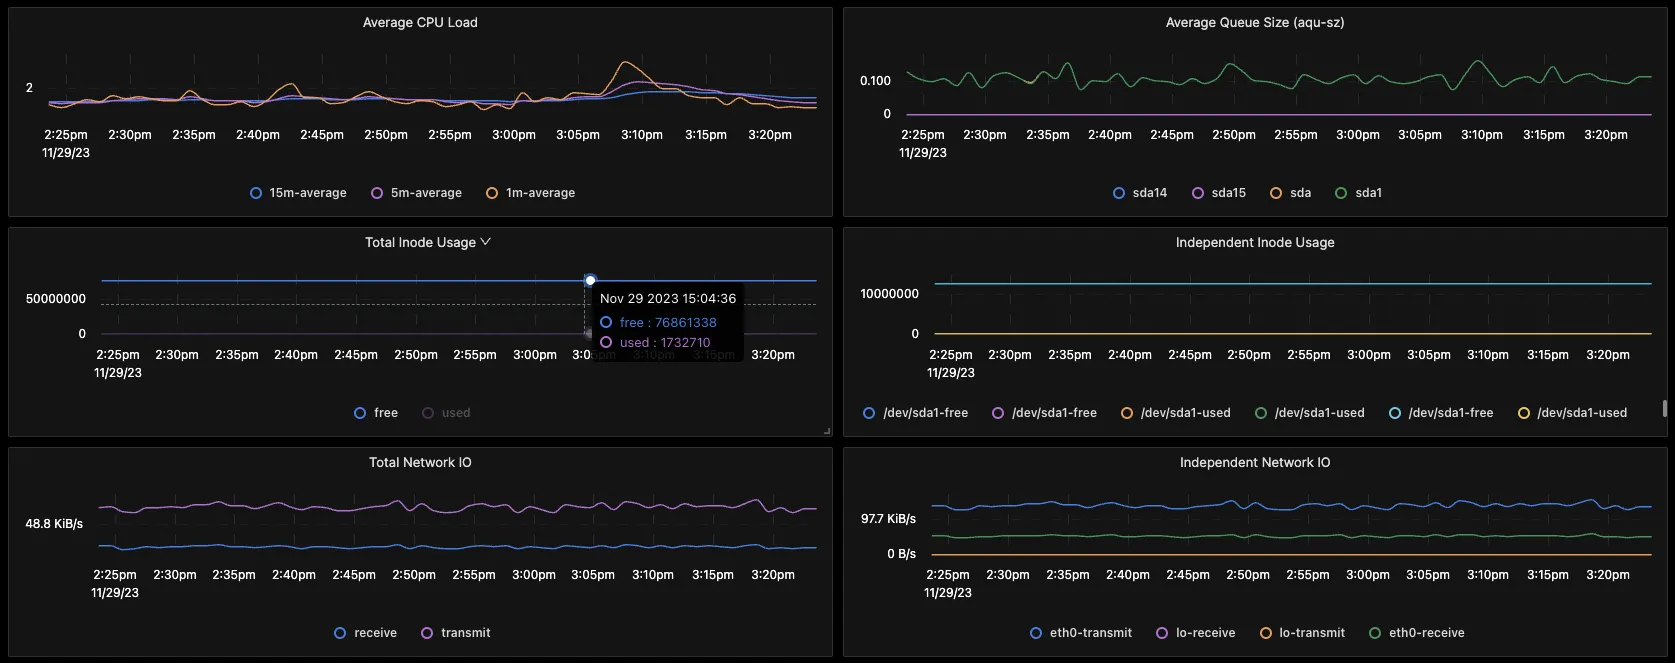
Moved to uPlot as our charting library
We have moved to uPLot as our charting library. Our users build a lot of customized dashboards with multiple charts and panels. uPlot will help improve the overall performance of the dashboards along with the initial render time and zoom and cursor performance.
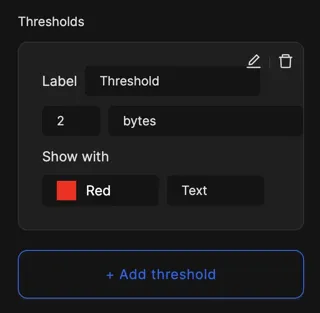
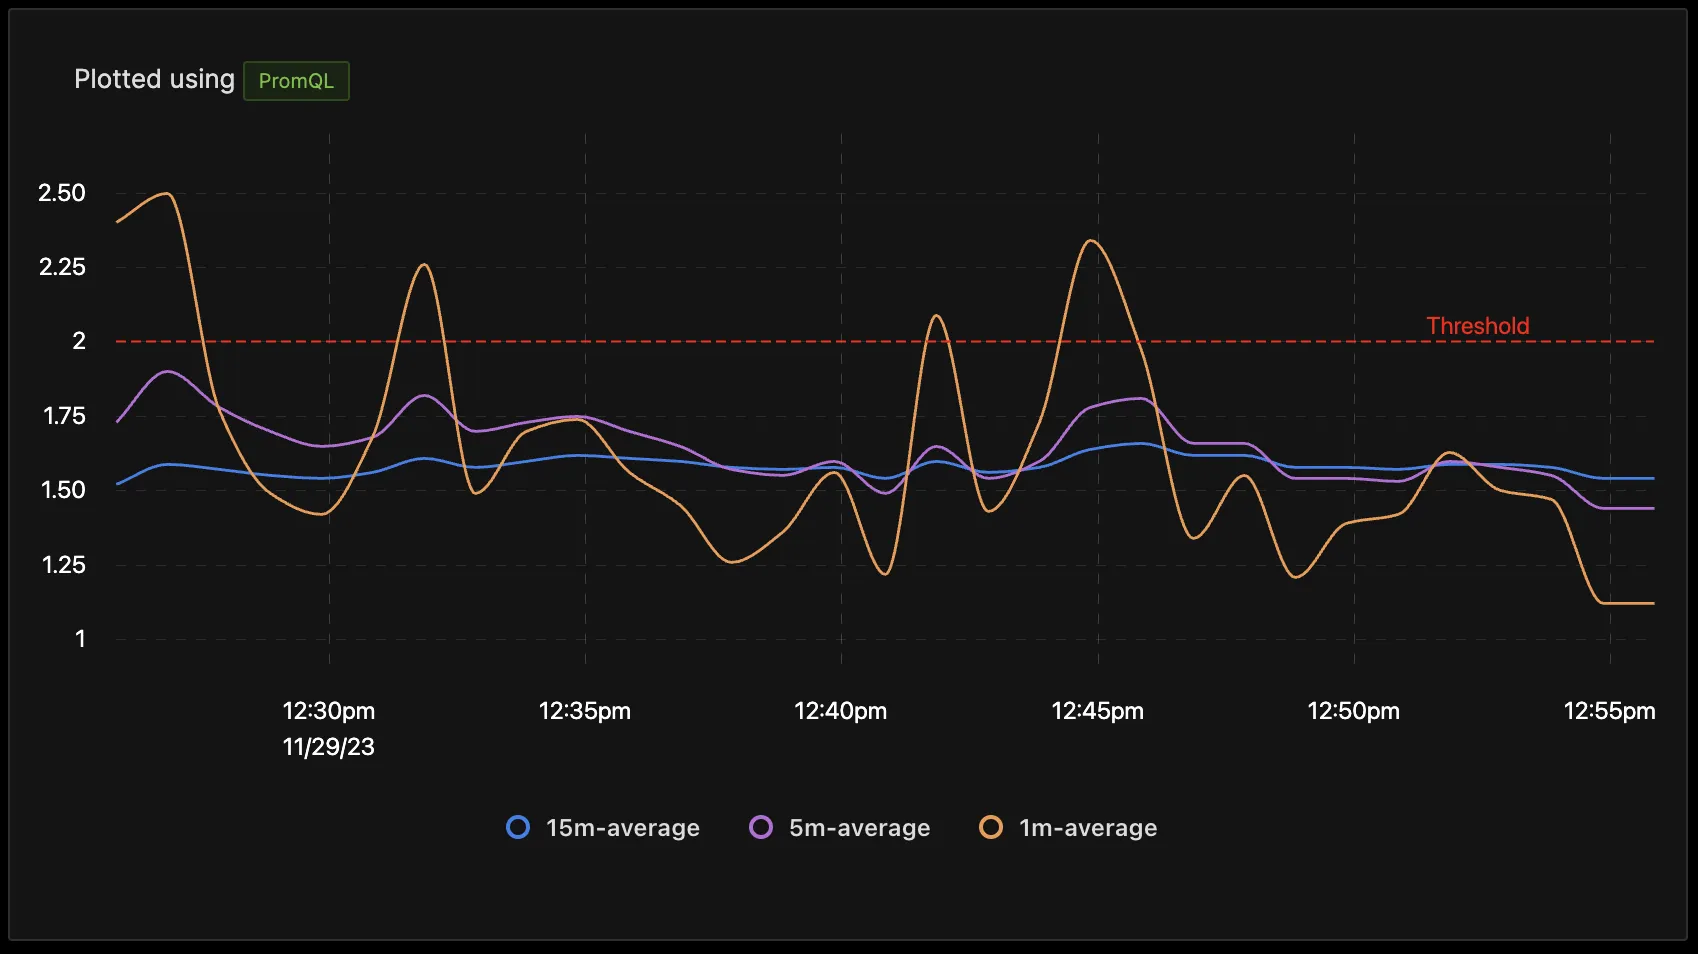
Add thresholds in Time-Series, Table, And Value View
You can set thresholds in different types of views in SigNoz. While creating any view in Dashboards, we have added an option to set thresholds. You can also customize things like color, text, or background.
Thresholds help you understand if a time series or value has crossed a limit and help you identify it just by visual inspection so that you can focus on what’s really important.
Improvements in Dashboard
We made a lot of improvements in the SigNoz Dashboards tab. The Dashboard tab is used to create customized dashboards to monitor specific components of your tech stack. For example, you can build a dashboard with charts and panels for your MongoDB database.
We made the following improvements:
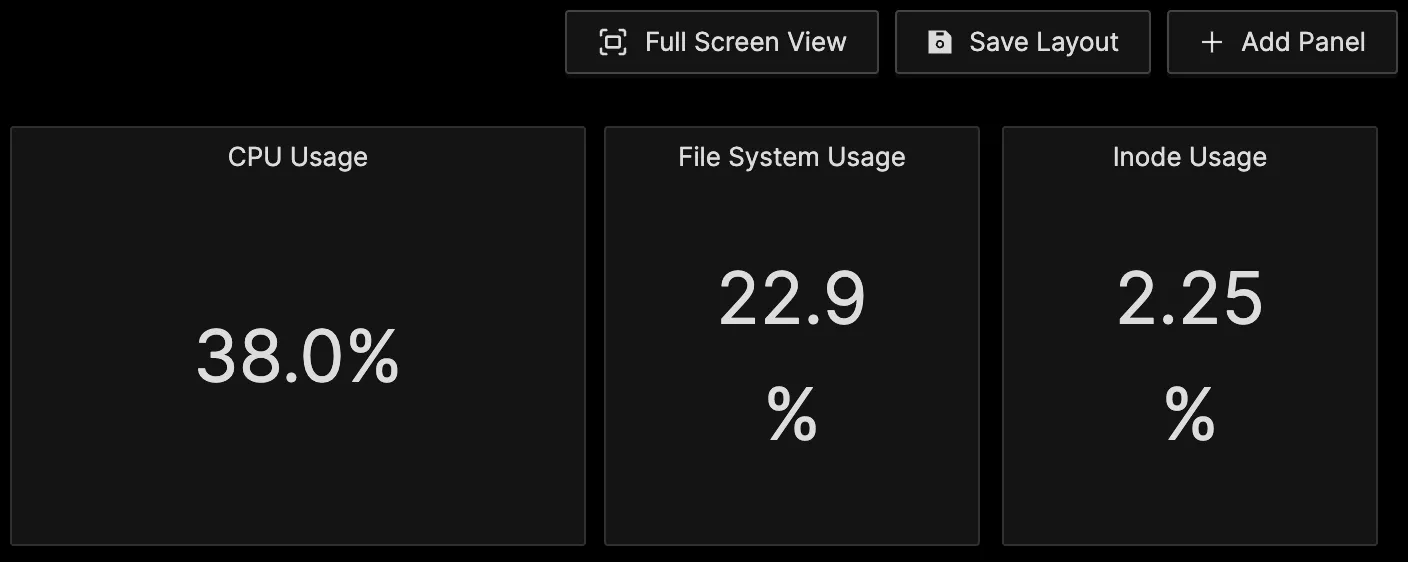
Full Screen View
We have added Full Screen View for dashboards to make it easier to view all charts and panels. It’s useful when your team is monitoring specific dashboards by projecting them on a monitor or large screen. You can focus better on the charts without any distractions.
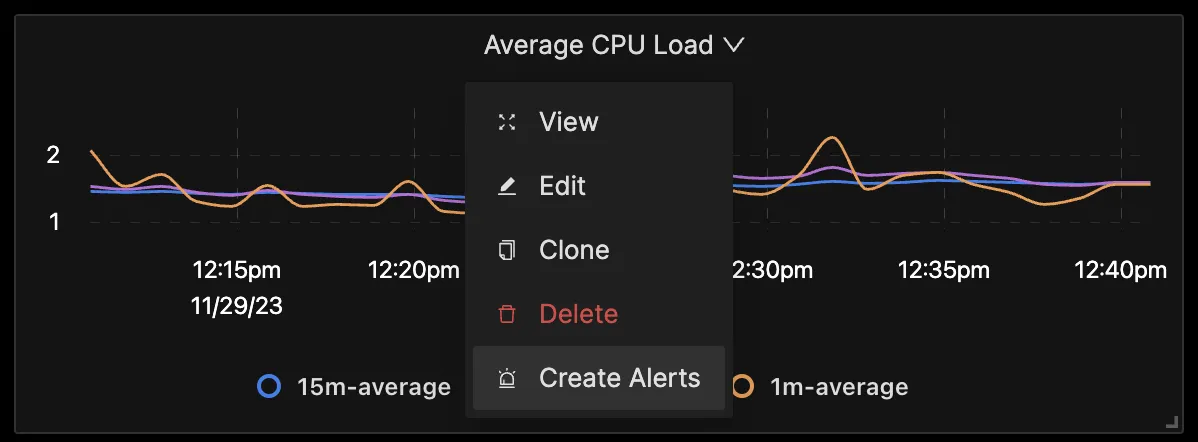
Alerts in Dashboard
You can directly create alerts for any charts or panels by clicking on the dropdown and then clicking on Create Alerts. It saves the effort of writing the query again in Alerts builder.
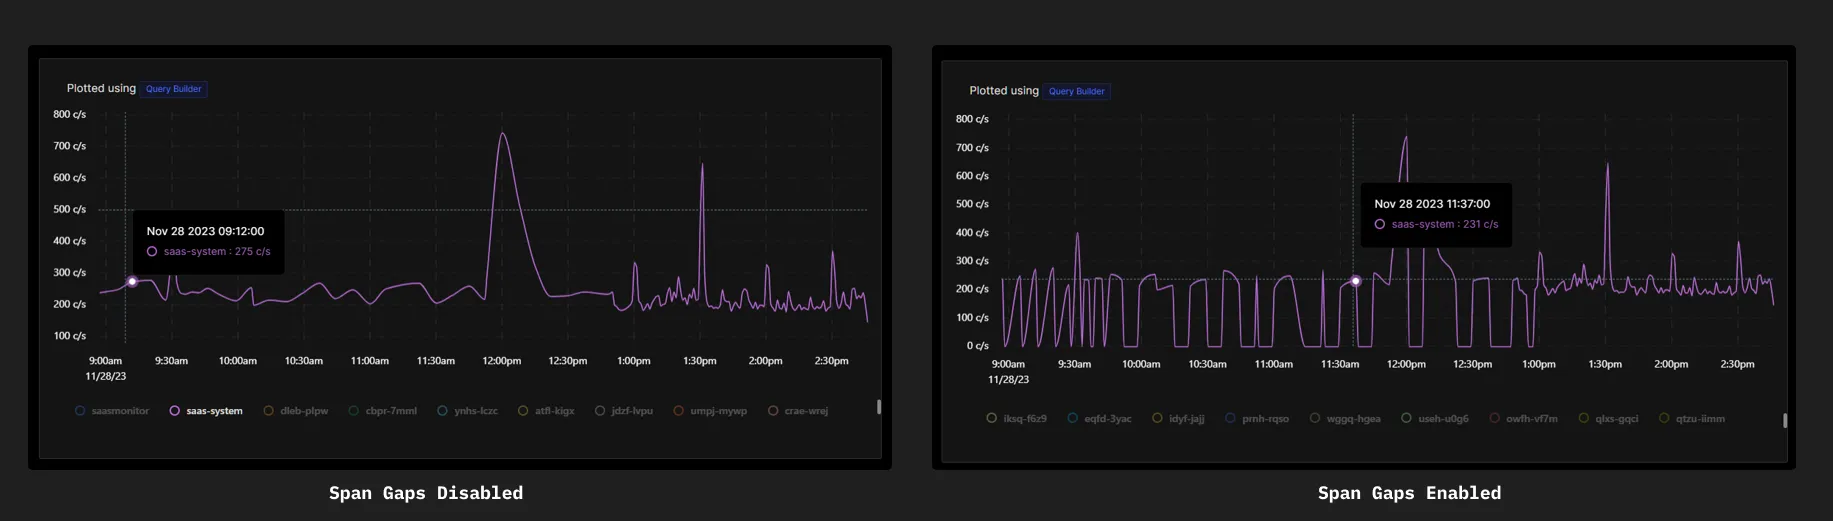
Fill Span Gaps Option for Charts
Fill Span Gaps option helps control how the chart handles missing or undefined data points (gaps) in a series. When Fill Span Gaps is set to disabled , it instructs the chart to draw a continuous line even when there are gaps in the data (i.e., some data points are missing).
If a data series has gaps and Fill Span Gaps is enabled, the line would typically be dropped to 0 at the position of the missing data points.
Observability: Insurance vs Growth Driver
When you think about observability, do you think of it as an insurance or a growth driver? Folks who see observability as an insurance driver tend to use it to do things like finding the root cause of something when it goes wrong.
However, users who see observability as a growth driver try to solve a business issue that improves usage and monetization. Read on to find out how we think you can utilize observability to justify the cost of using a tool.
Observability: Insurance vs Growth Driver
SigNoz Webinars
OpenTelemetry Webinars: The Open Agent Management Protocol
Open Agent Management Protocol (OpAMP) is the emerging open standard for managing a fleet of telemetry agents at scale. In this webinar, Nica and Srikanth talk about OpAMP in detail, discussing what it is, what it means for an end-user, and how to use it. Check out the entire webinar here 👇
OpenTelemetry Webinars: The Trace API
In this webinar, Nica and Srikanth discuss the Trace API in detail. They talk about adding spans, events, attributes, and other extra info, whether it's really possible to replace logs with traces, and more. Check out the entire webinar here👇
SigNoz News
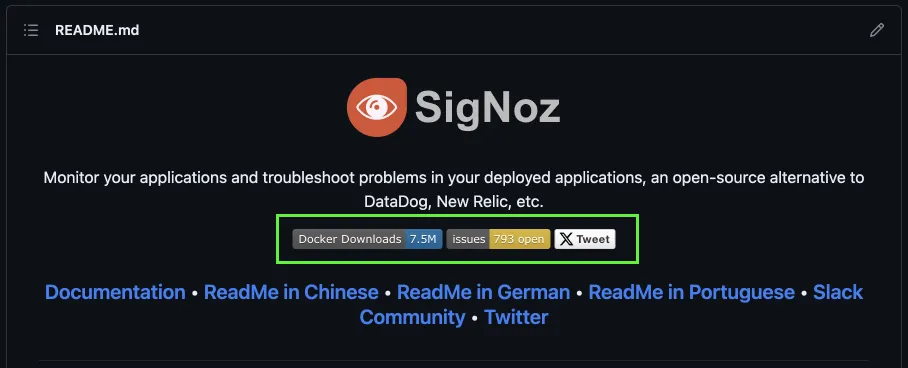
Crossed 7 Million Docker Downloads
We crossed 7 million Docker downloads for our open-source project. 🥳 It’s exciting to see the impact of SigNoz across the globe in helping developers build better applications with better observability in place.
Open-Source Startup Podcast
Pranay sat down with Robby (From Cowboy Ventures) and Timothy Chen (from Essence Venture Capital) to talk about open-source observability. A few things that were discussed in the podcast were:
- Why observability should be open-source
- Why we decided to use OpenTelemetry
- Why nailing single user experience is important for open source projects
You can check out the entire episode here 👇
Taking on Datadog with Open-Source ObservabilityTutorials by Community
It is always great to see community tutorials on SigNoz. It strengthens our belief in the open-source ethos of building in public.
Here are a few community tutorials we would like to give a shoutout:
- Exporting APISIX Metrics to SigNoz
- Practical OpenTelemetry Review by Leigh Finch Featuring SigNoz
- SigNoz alerts integration with Squadcast
SMC Journal Podcast
Pranay sat down with Scott Moore from SMC Journal Podcast to discuss why open-source observability is important for today’s technology ecosystem. You can check out the entire podcast here 👇
Contributor Highlight
Every month, contributors from our community help make SigNoz better. We want to thank the following contributors who made contributions to SigNoz last month 🤗


From the blog
PostgreSQL metrics monitoring is important to ensure that PostgreSQL is performing as expected and to identify and resolve problems quickly. OpenTelemetry Collector can collect metrics from your PostgreSQL instances and send them to a backend of your choice for monitoring and visualization.
In this tutorial, learn how to configure the PostgreSQL receiver in OpenTelemetry Collector to collect important metrics about PostgreSQL performance.
How to Monitor PostgreSQL Metrics with OpenTelemetry
Thank you for taking out the time to read this issue :) If you have any feedback or want any changes to the format, please create an issue.
Feel free to join our Slack community and say hi! 👋