16,000+ Github stars, New Design Theme & Front Page of HN - SigNal 33
"It’s hard to do a really good job on anything you don’t think about in the shower.”
-Paul Graham
Welcome to the first SigNal of 2024! It is a year that we’re looking forward to accomplishing great things. We recently crossed 16,000+ GitHub stars as we continue to be amazed by the support of the developer community in our mission of open-source observability.

Let’s see what humans of SigNoz were up to in January 2024.
What we shipped?
Latest release - v0.37.2
Previous Releases - v0.37.1, v0.37.0, v0.36.2
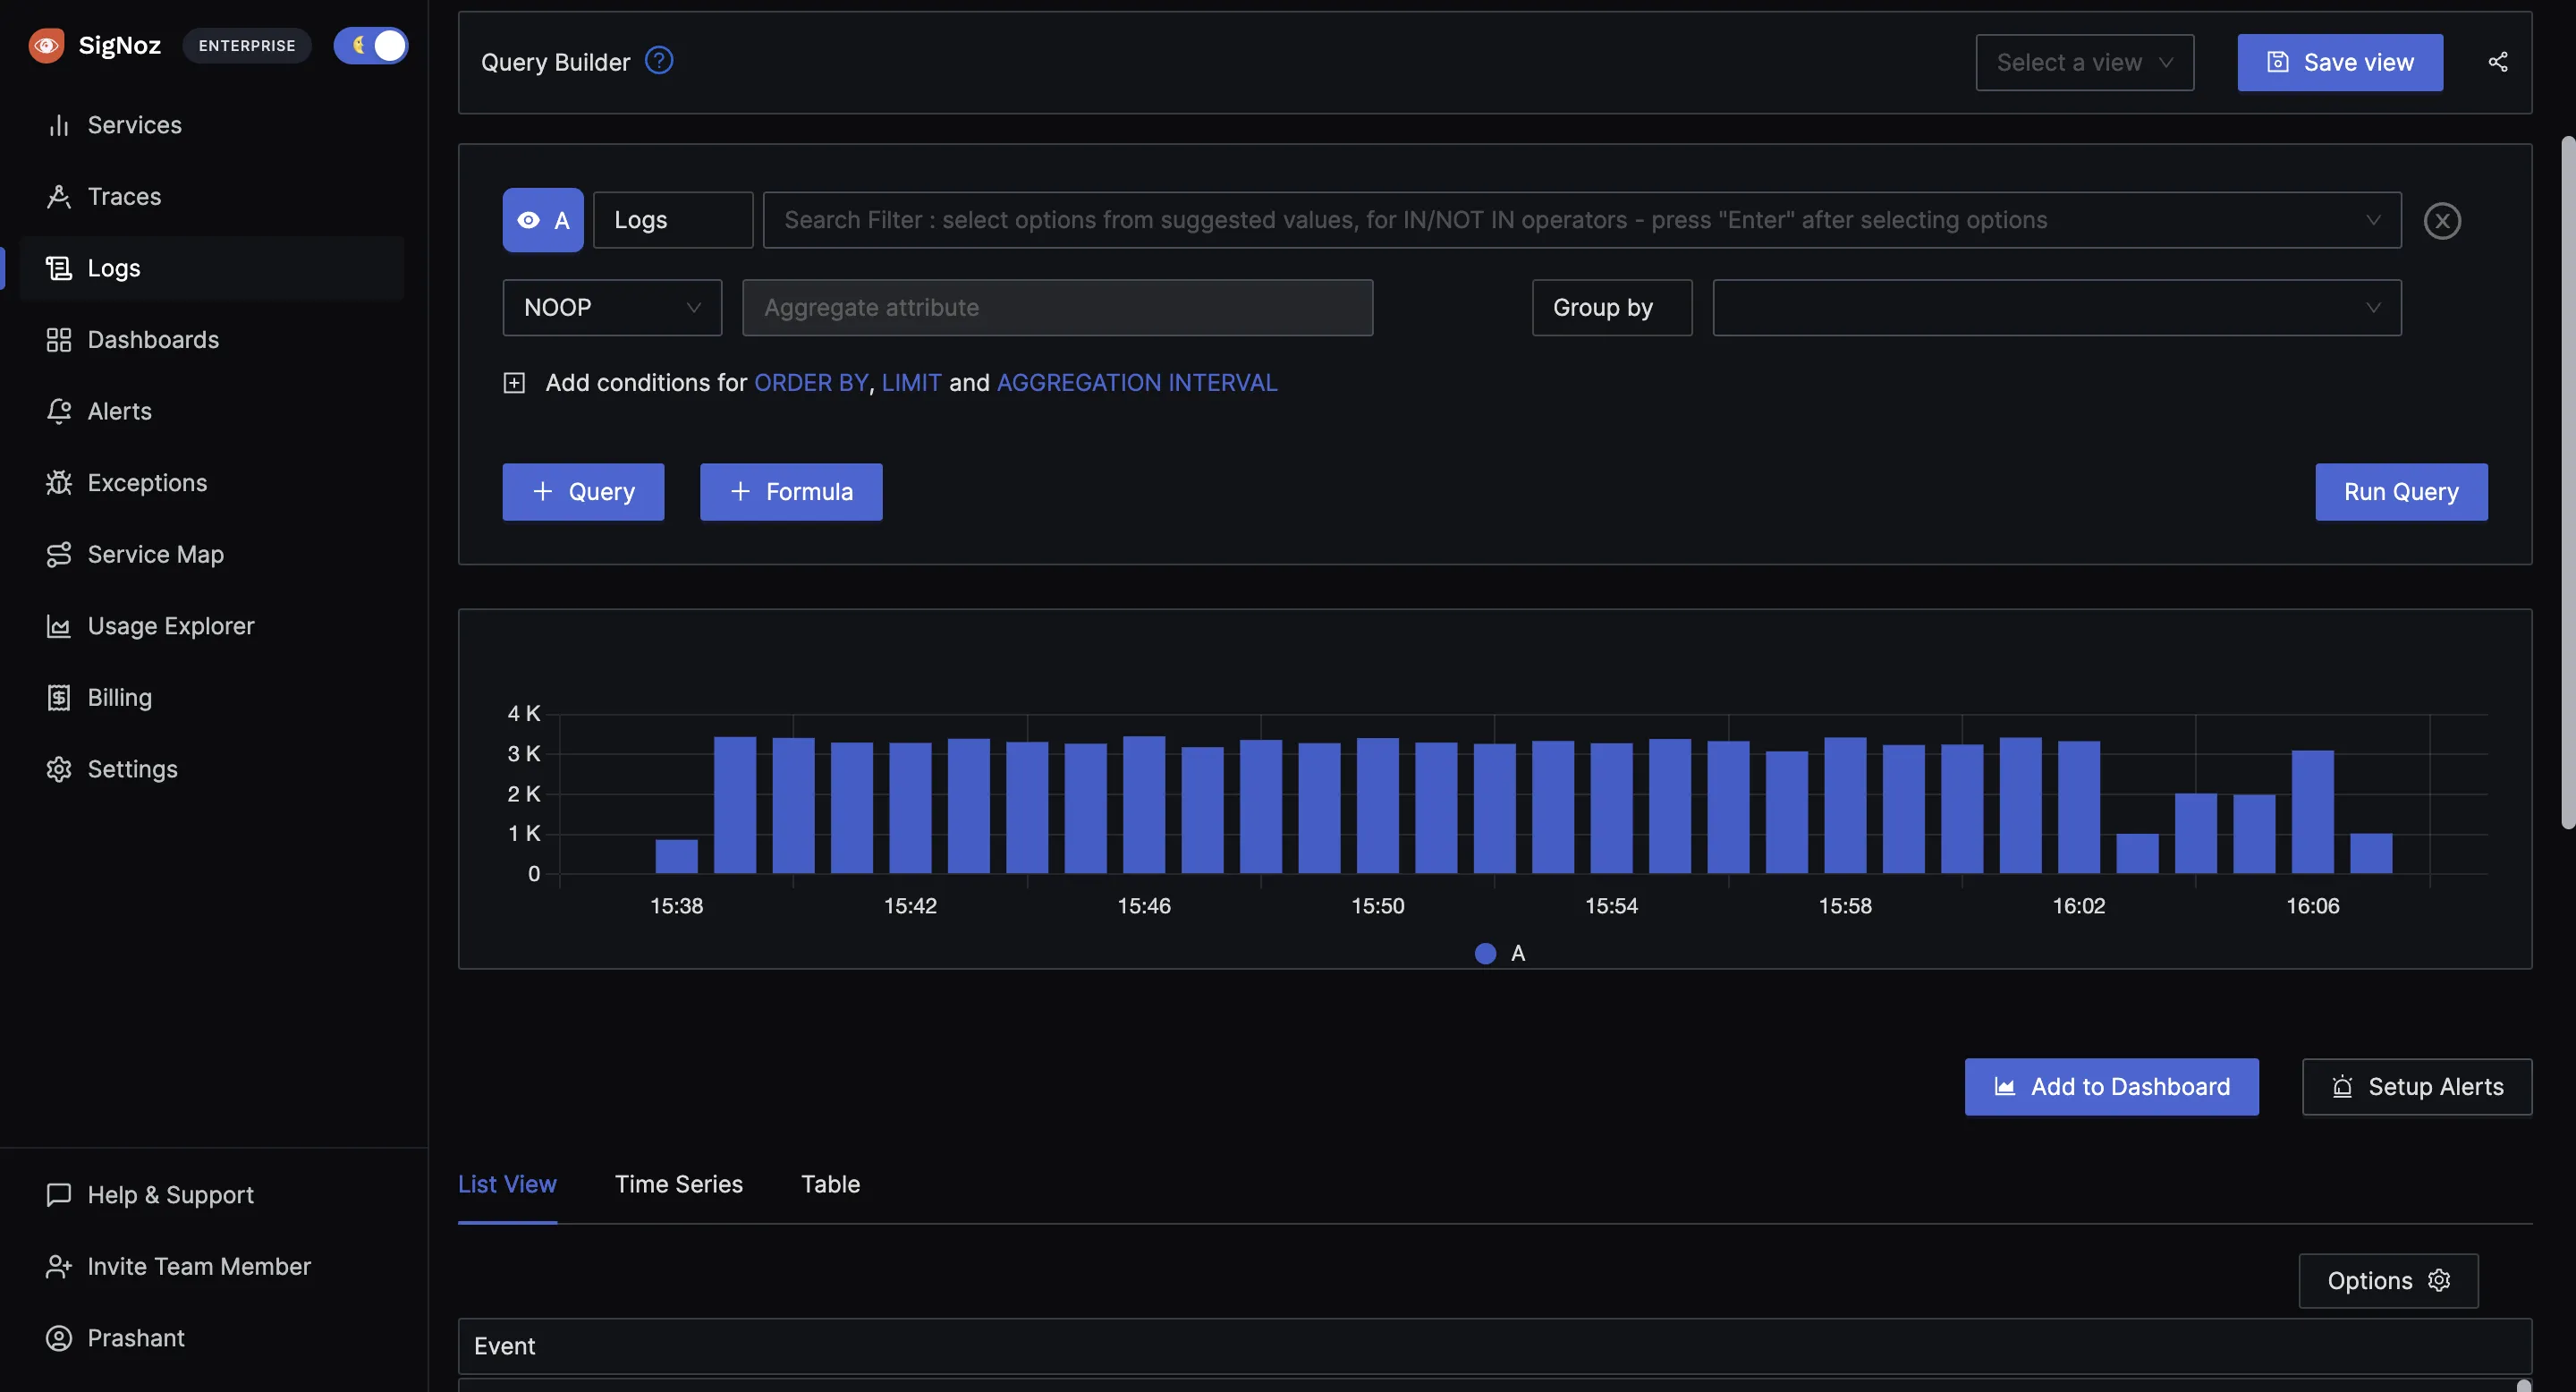
New SigNoz Theme and Sidebar
We're excited to announce a fresh new look for SigNoz. Our latest update brings a vibrant new color scheme, fonts, and a sleek new sidebar to enhance your observability experience.
We are working towards enhancing our user experience across all features of SigNoz. Stay tuned for more exciting releases in the near future.
Soft Min and Max Axis Limits for Charts
This was one of the popular requests from our user community. With soft min and max axis limits, the axis will not shrink down to show smaller variations in data as large mountains. So, while creating charts, you can specify a min and a max value for your axis. Actual data points will have the highest preference, so you won’t be able to set a min lower than an actual data point in your chart.
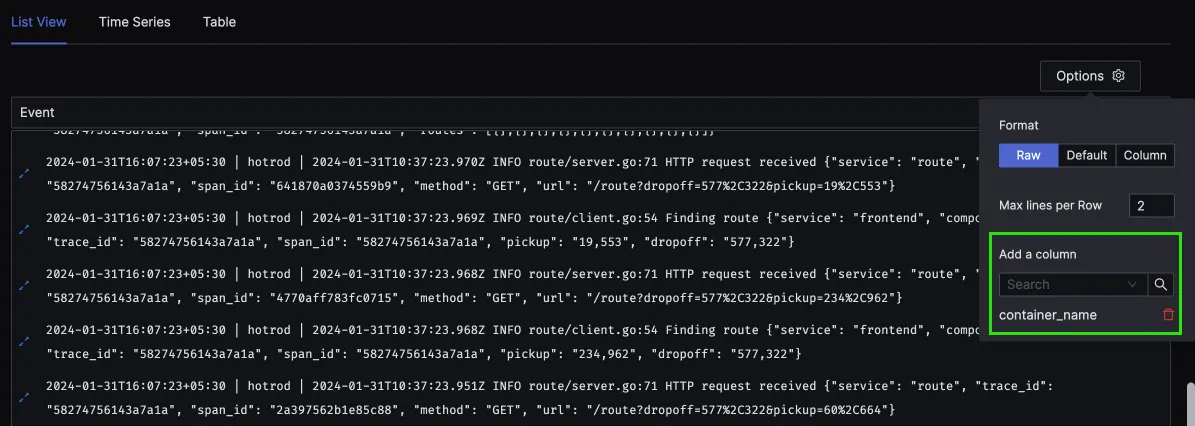
Log attributes in Raw view of logs for better context
We provide multiple views in the logs tab, such as Raw, Default, and Column. The Raw view of logs is only used to show timestamp and body earlier. Now you can configure it to also show log attributes. This update adds richer context to the Raw view, enabling users with a more comprehensive understanding of their logs.
Custom Date-Time value picker to support entering values
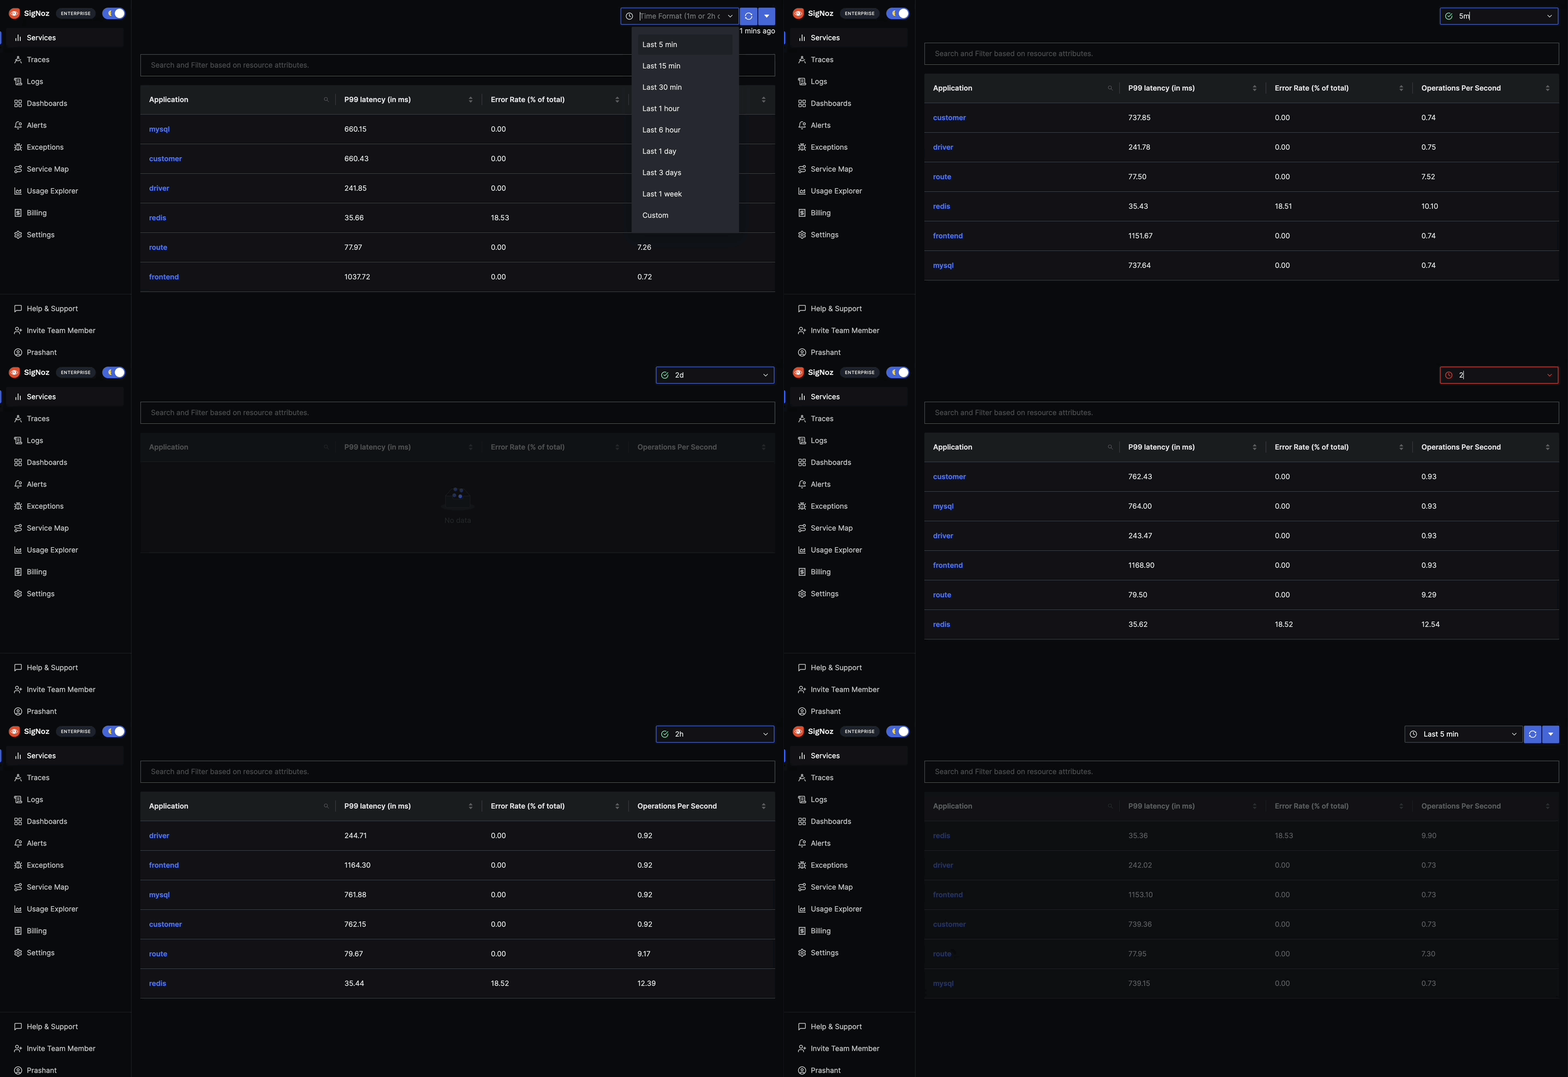
We have made it very easy to apply a time filter in our custom date-time picker. Now you can just type in values like:
5mfor 5 minutes2hfor 2 hours, and2dfor 2 days
And get your data filtered for that time range. The date-time picker is one of the most used data fields, and we plan to make it more user-friendly in future updates.
Did OpenTelemetry deliver on its Promise in 2023?
OpenTelemetry has brought a sea change in the world of observability. The idea of the project was to standardize the instrumentation needed for generating telemetry. Teams shouldn’t need to change how they collect data if they want to try a new visualization/backend for the telemetry data. That was the vision.
Did OpenTelemetry deliver on its promise in 2023? We have shared our experience of working closely with engineering teams, big and small, who have embraced OpenTelemetry as their new standard for observability.
SigNoz News
Crossed 16,000+ GitHub Stars

We have crossed 16,000+ GitHub stars. A huge thank you to the developer community for their unwavering support towards our mission of open-source observability! 🙏 We're striving hard to build the best observability tool to help developers keep their applications running smoothly 🚀
We are working on new innovative features and a much more improved, sleek, user-friendly experience in the coming months. If you’re interested, you can check out our GitHub repo here:
Front page of HN
We were trending on the front page of Hacker News with our blog: “Did OpenTelemetry deliver on its promise in 2023?”
It’s always amazing to see developers resonate with something we have created, and we are excited about OpenTelemetry’s promise in 2024.

Watch out for SigNoz in 2024
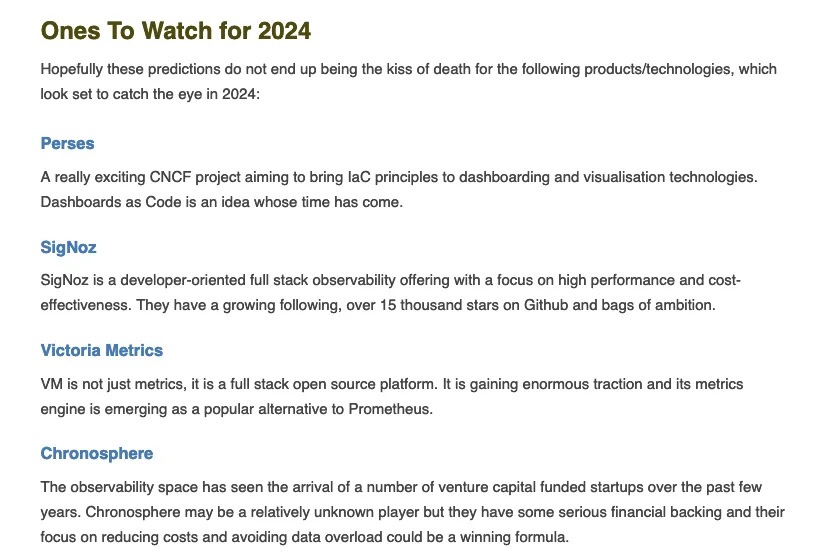
SigNoz is one of the four observability tools to watch out for in 2024. We have plans to go deeper into OpenTelemetry and redefine the paradigms of open-source observability.
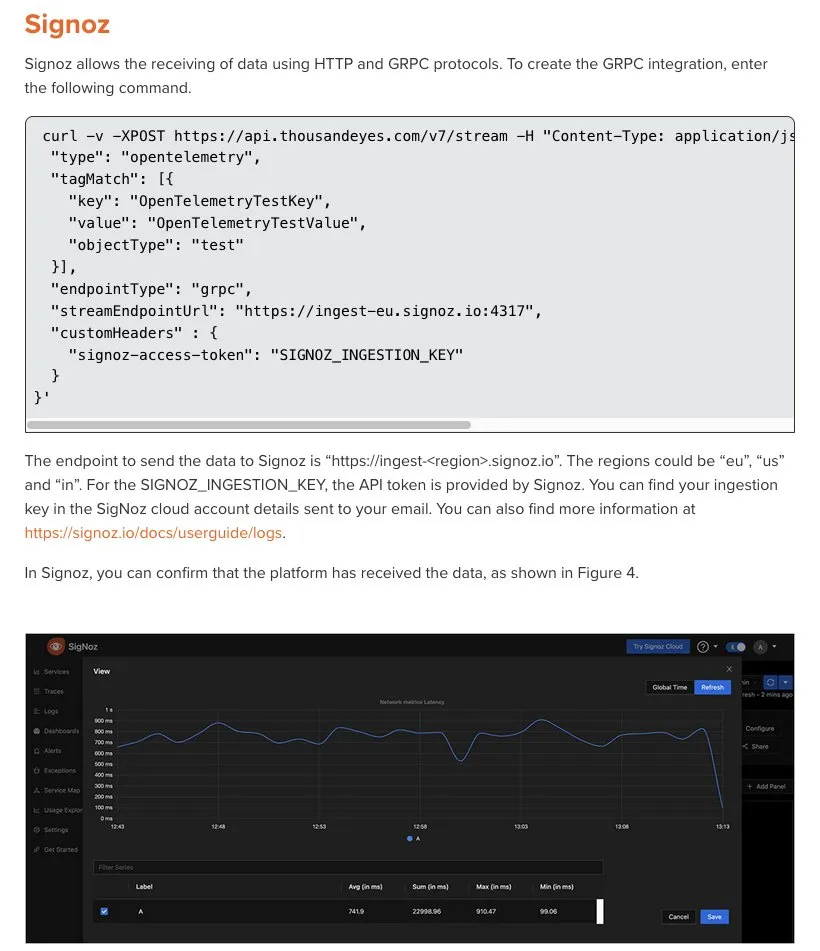
Integration with ThousandEyes (A Cisco Company)
SigNoz is one of the 4 observability platforms for which ThousandEyes (a DEM platform) has default docs for sending ThousandEyes data.
It's great to see that SigNoz is one of the top few observability platforms that tools are adding to their integrations list.
User Shoutouts 🤗
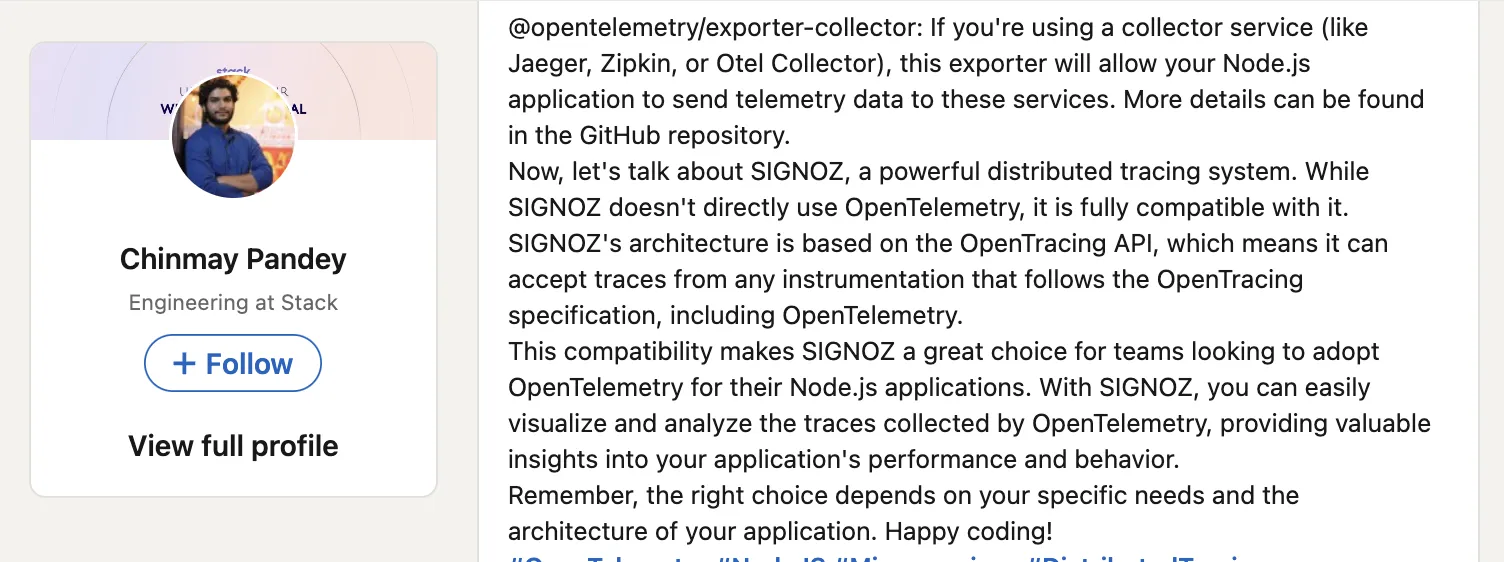
We got a lot of user shoutouts - the best kind of motivation that keeps us going.
We are the new hotness for all-in-one observability 🙌. We are striving towards building the best developer experiences for open-source observability.

It’s good to see our users recognizing the value of an OpenTelemetry-native APM. We are focused on building the most advanced backend and visualization layer for OpenTelemetry.
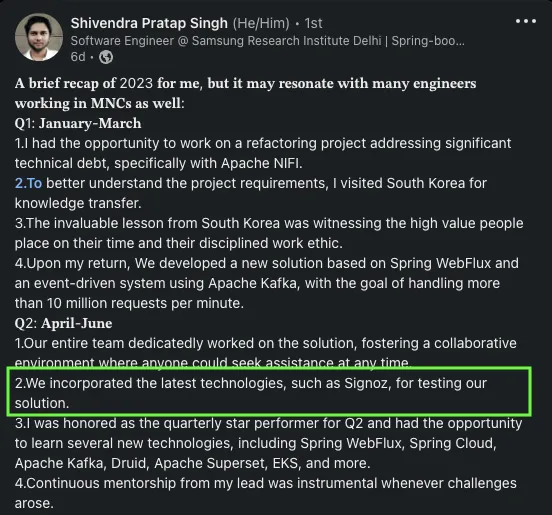
It’s great to see organizations like Samsung Research incorporating SigNoz for their use cases.
Community Tutorials
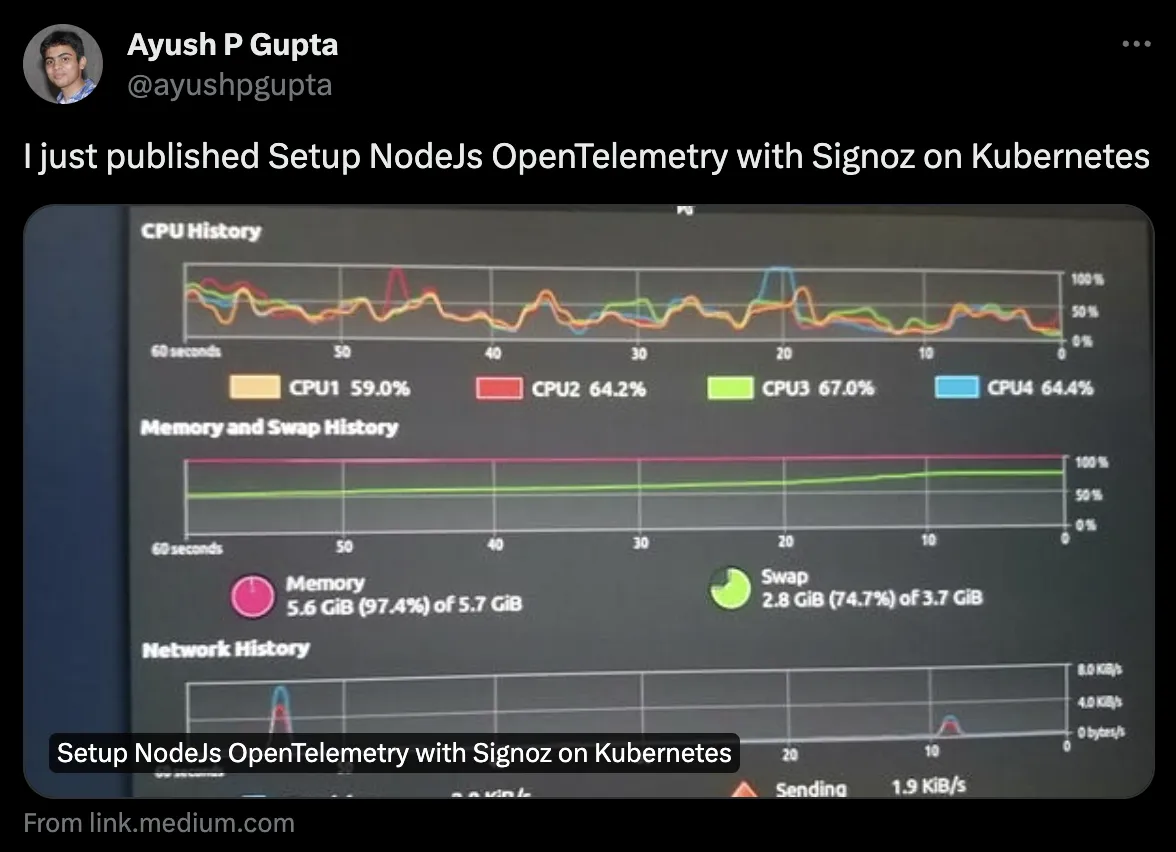
It’s great to see community-led tutorials on SigNoz. Our mission is to create access to great open-source observability, and it’s good to see the dev community leveraging it to its full potential.
Shoutout to Ayush for creating a great tutorial on setting up OpenTelemetry in a Nodejs application on Kubernetes.
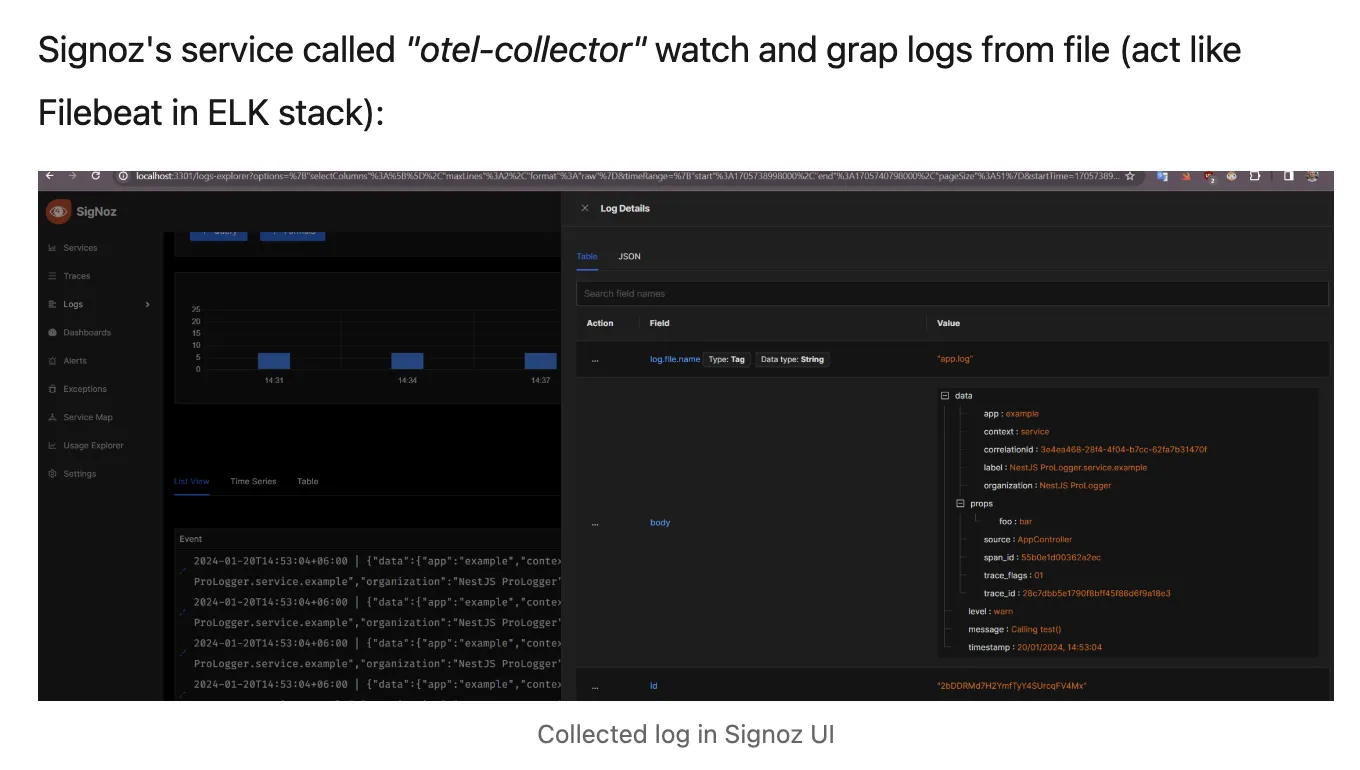
Shoutout to Egor for creating a tutorial on using SigNoz for structured logging in a Nestjs application built on top of Winston library.
Contributor Highlight
Every month, contributors from our community help make SigNoz better. We want to thank the following contributors who made contributions to SigNoz last month 🤗
From the Blog
OpenTelemetry can help you monitor CouchDB performance metrics with the help of OpenTelemetry Collector. CouchDB stores data in documents, which are like digital files. This makes it easy to organize and manage information. Unlike some databases that need a strict structure, CouchDB lets you change and adapt your data without any hassle. It's like having a tool that can handle different shapes and sizes of information.
In this tutorial, you will install OpenTelemetry Collector to collect CouchDB metrics and then send the collected data to SigNoz for monitoring and visualization.
Monitoring CouchDB with OpenTelemetry and SigNoz
Thank you for taking out the time to read this issue :) If you have any feedback or want any changes to the format, please create an issue.
Feel free to join our Slack community and say hi! 👋

