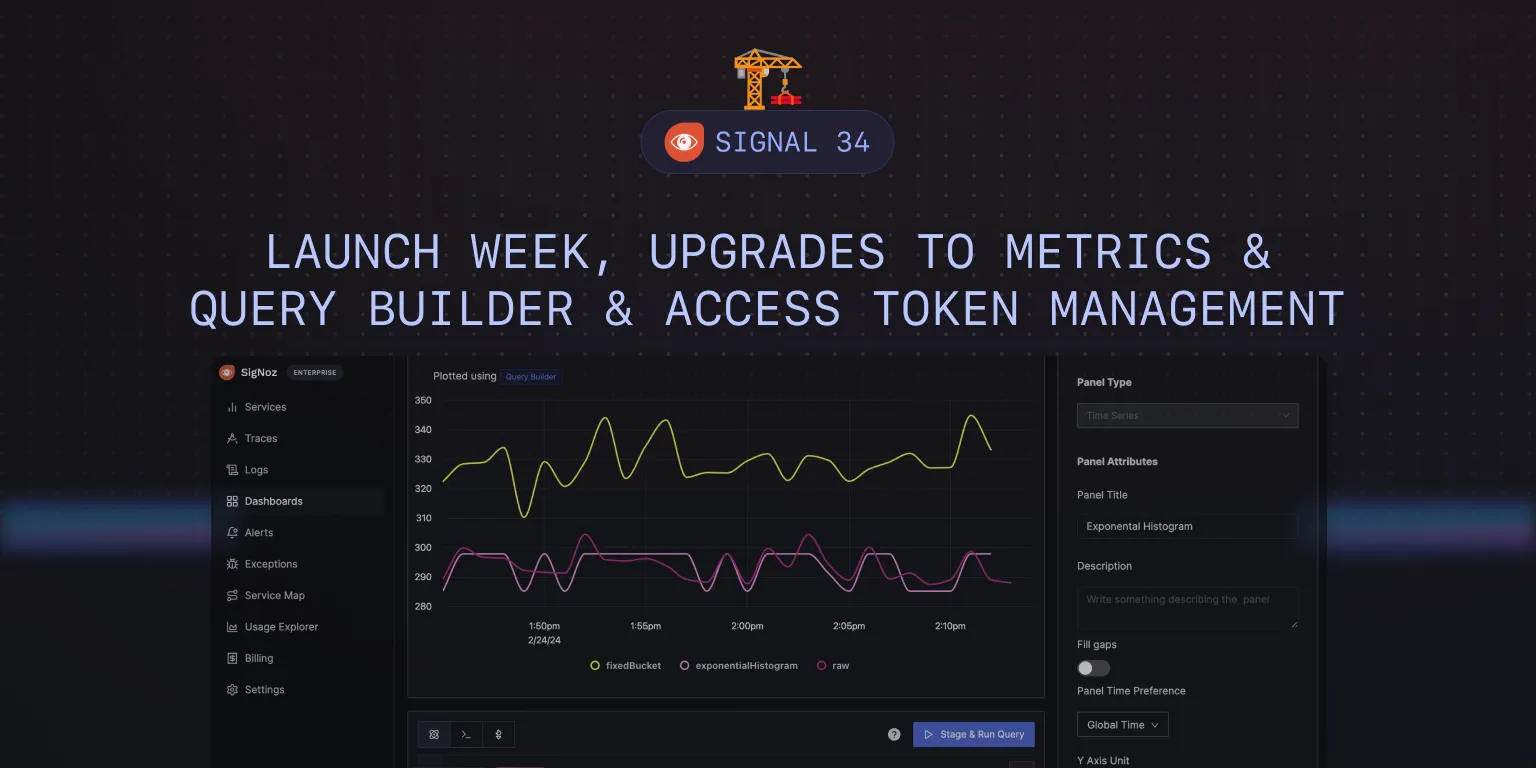
Launch Week, Upgrades to Metrics & Query Builder & Access Token Management - SigNal 34
"When something is important enough, you do it even if the odds are not in your favor”
-Elon Musk
Welcome to the 34th edition of our monthly product newsletter - SigNal 34!
Last month was full of action. We did our first launch week, and we were thrilled to see the response. We have shipped some amazing features recently.
Let’s see what humans of SigNoz were up to in the month of February 2024.
What we shipped?
Latest release - v0.40.0
Previous Releases - v0.39.1, v0.39.0
Upgrades to Metrics & Query Builder
We have shipped some exciting features in our metrics & query builder to take metrics monitoring in SigNoz to the next level!
Temporal & Spatial aggregation
In SigNoz metrics query builder, we have introduced temporal and spatial aggregations for metrics data.
Temporal aggregation is a method of condensing metric data over time to streamline analysis and visualization. It's essential for managing data from applications that transmit metrics at regular intervals, helping to reduce the volume of data points into a more interpretable format.
While temporal aggregations are meant for reducing data points across a single time axis, spatial aggregation refers to the technique of merging metric data across various dimensions or labels, such as container names, service names, or geographical regions.
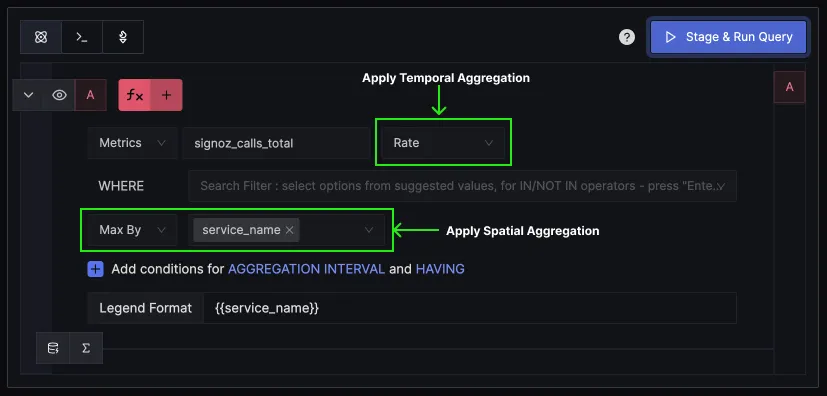
We have enabled temporal and spatial aggregations in our metrics query builder. Based on the metric selected, you can see options for different types of aggregations that can be applied to it.
For example, if you select a counter metric called signoz_calls_total, you can apply temporal aggregations like Rate and Increase on it. Similarly, you can apply spatial aggregations across many dimensions, such as service_name, operation, deployment_environment, etc.
Support for functions
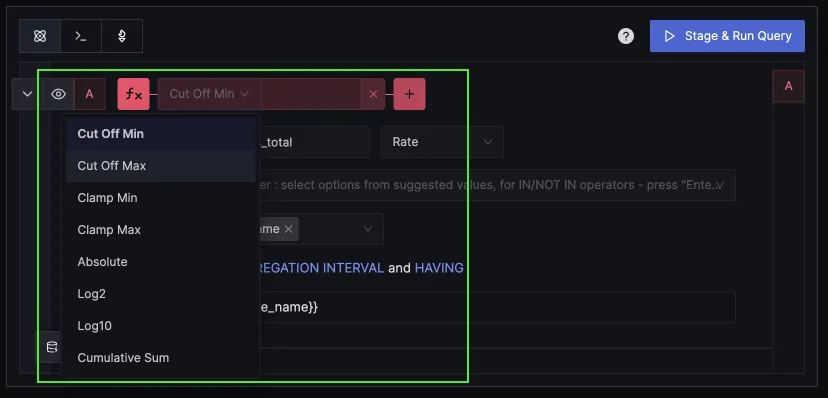
We have added support for four kinds of functions in the metrics query builder to extend its data analysis capabilities:
- Exclusion Functions: These allow users to exclude data points based on certain conditions, such as values falling outside a specified range.
- Arithmetic Functions: Users can perform mathematical operations on data points, enabling the customization of metric calculations to suit specific analysis needs.
- Smoothing Functions: To deal with volatile data, smoothing functions can be applied, such as moving averages, which help in identifying underlying trends by reducing noise.
- Time Shift Functions: These functions enable comparisons of data across different time periods, useful for analyzing trends, changes, or anomalies over time.
You can use functions for things like reducing visual noise.
Exponential Histogram
Exponential histograms are a data structure used for efficiently summarizing distribution data, particularly useful in performance monitoring and analysis for capturing metrics like latencies or sizes.
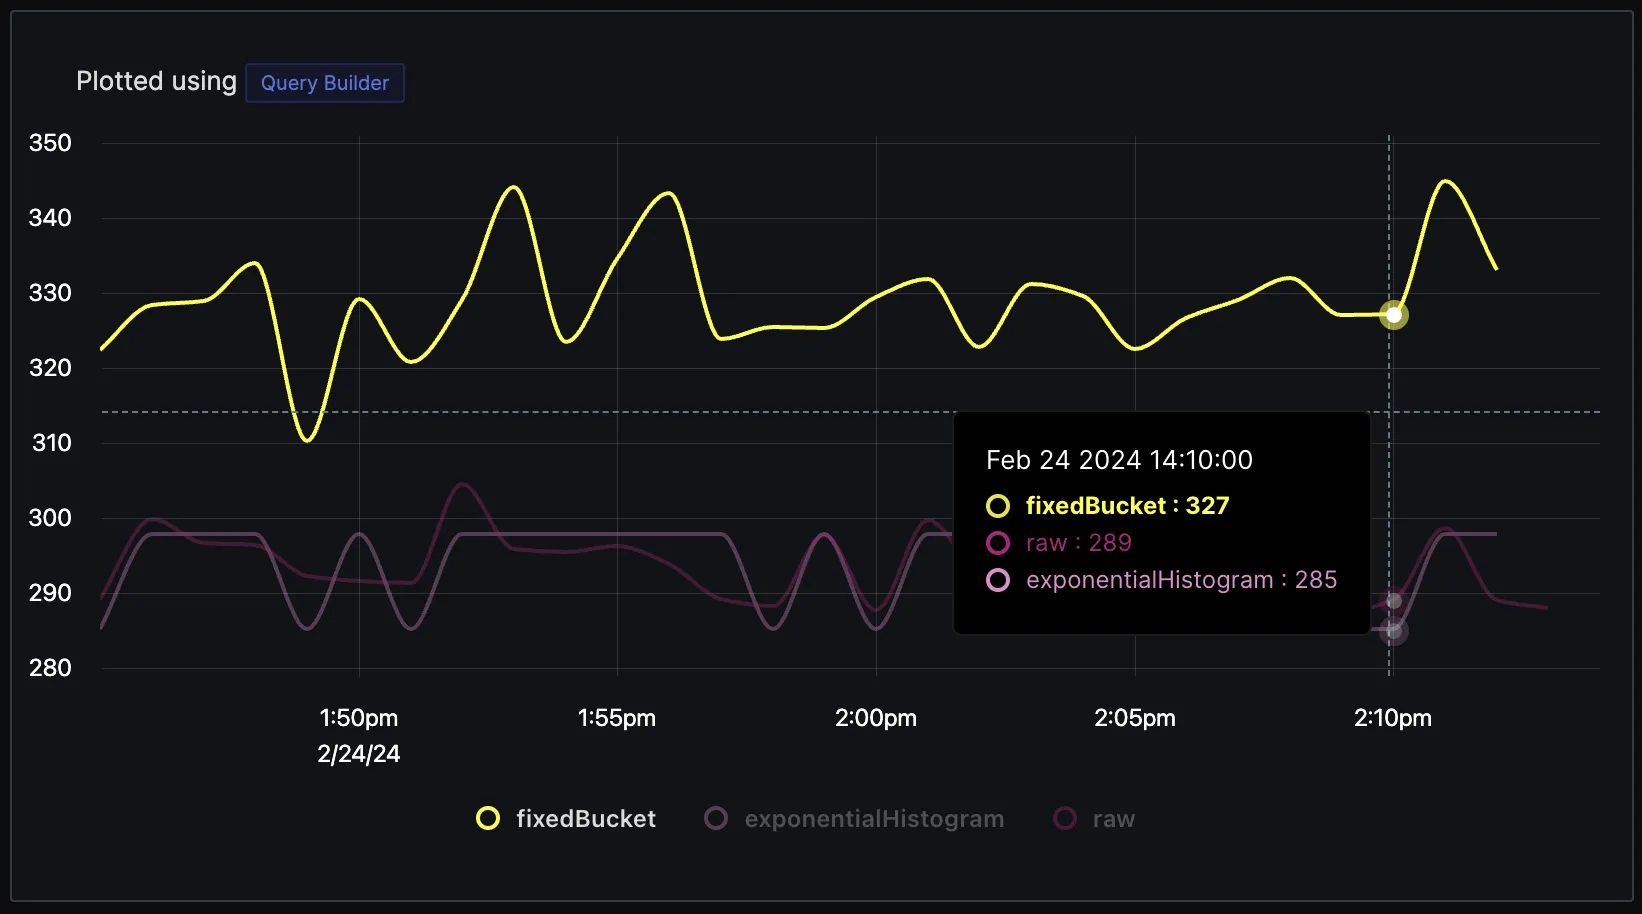
In SigNoz, we have enabled exponential histograms for metrics such as latency. Below is a graph plotted for latency using:
- Raw values (calculated from trace data),
- Fixed Buckets Histogram, and
- Exponential Histogram
As you can see, the values of the Exponential histogram have a much lesser delta(-4) from raw values compared to the delta of fixed bucket histograms(+38).
Support for Delta Metrics
SigNoz now supports delta metrics. Delta metrics, which report changes over specific intervals, offer a lower memory footprint and simpler aggregation compared to cumulative metrics, which track total counts over time.
This makes delta metrics more efficient and straightforward for real-time monitoring and analysis, as they avoid the need for complex calculations to derive incremental changes.
Access Token Management
Access Token Management was a popular requested feature by SigNoz users. Before we enabled it through our UI, users had to reach out to us via email. There are many interesting use cases that these tokens enable:
- Customized Access Levels
- Correlating Business Metrics with Observability Data
- Custom Alerts and Automation
- Programmatic Access and Automation
Let’s suppose you want to fetch logs from SigNoz for some use-case. You can find docs about using Logs API and Trace API. Using access tokens with the right permissions, you can fetch your required logs.
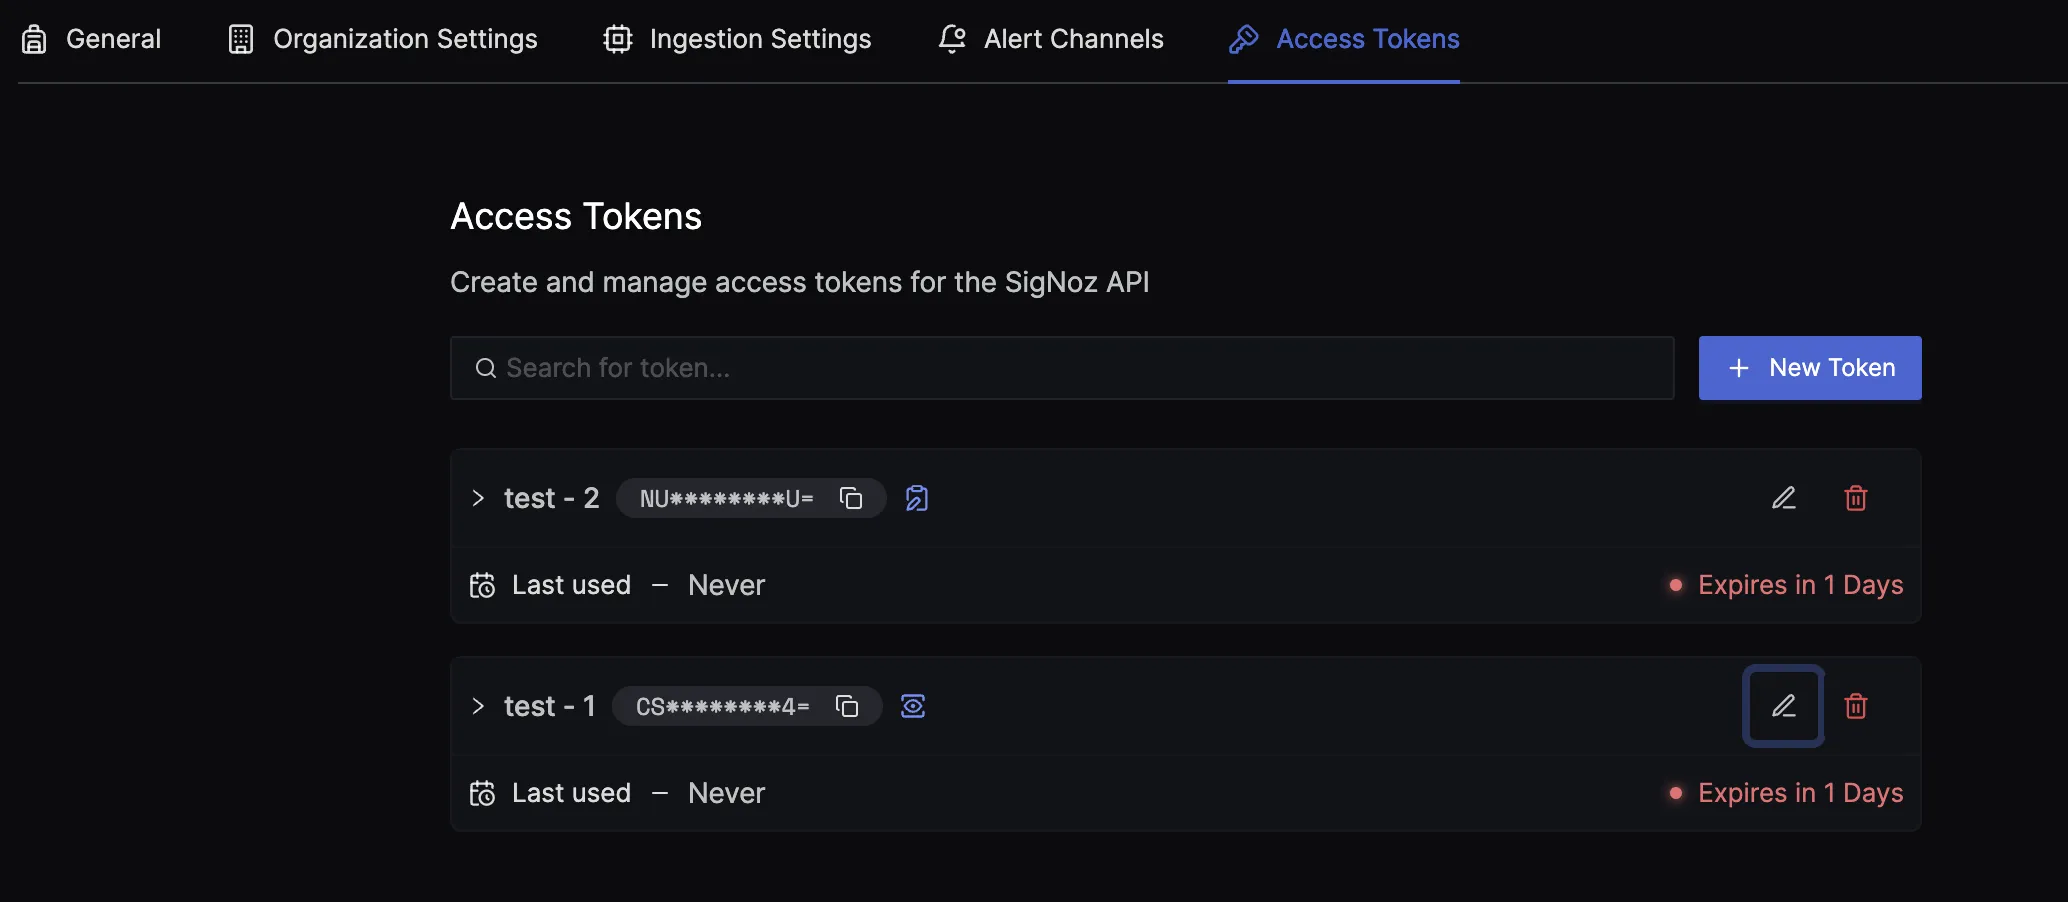
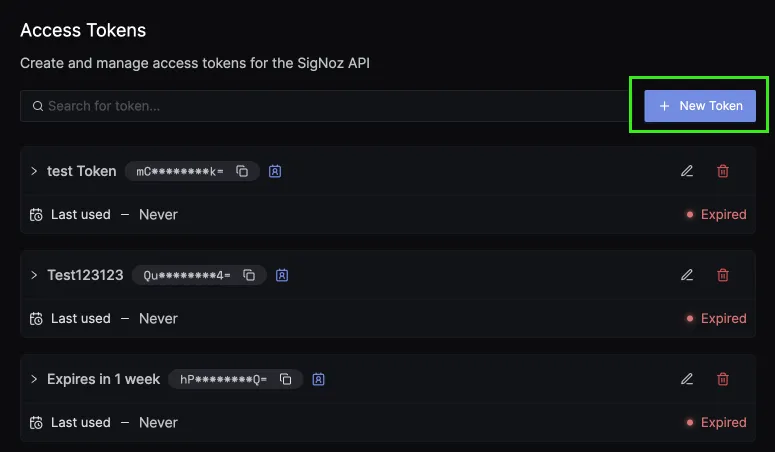
Step 1: Go to Access Tokens tab under Settings, and click on + New Token.
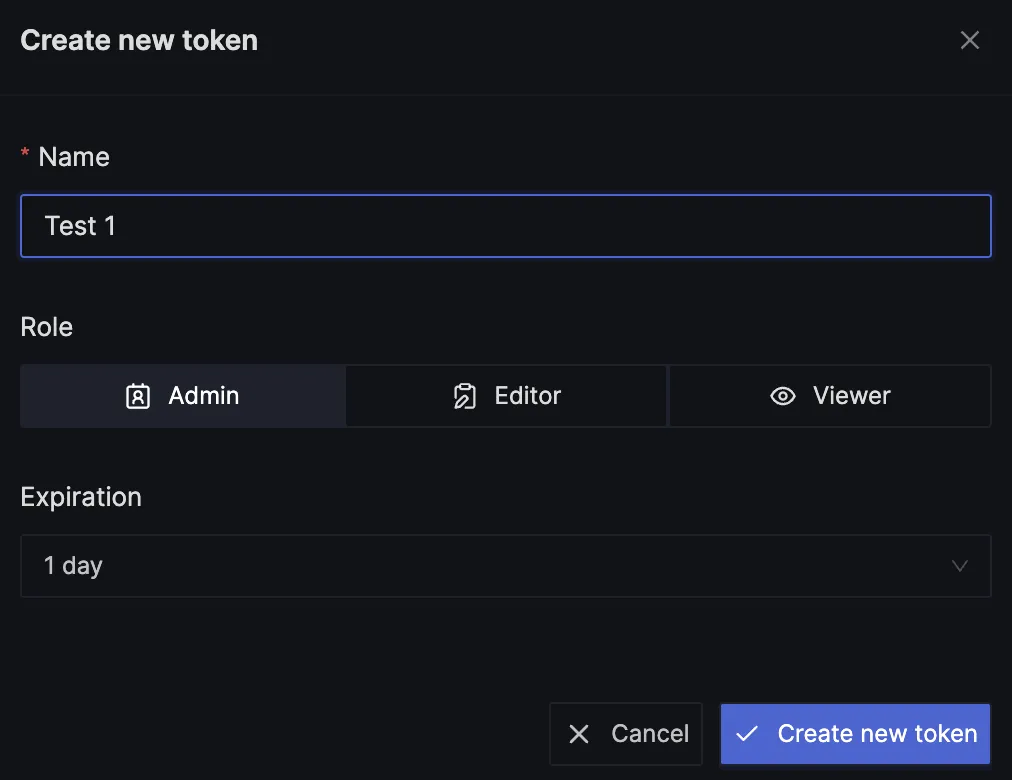
Step 2: Give a name to the token. You can select one of the three roles: Admin, Editor, and Viewer based on your requirements. Set an expiration window and click on Create New Key. You can also edit the token later to change the role and the name of the token.
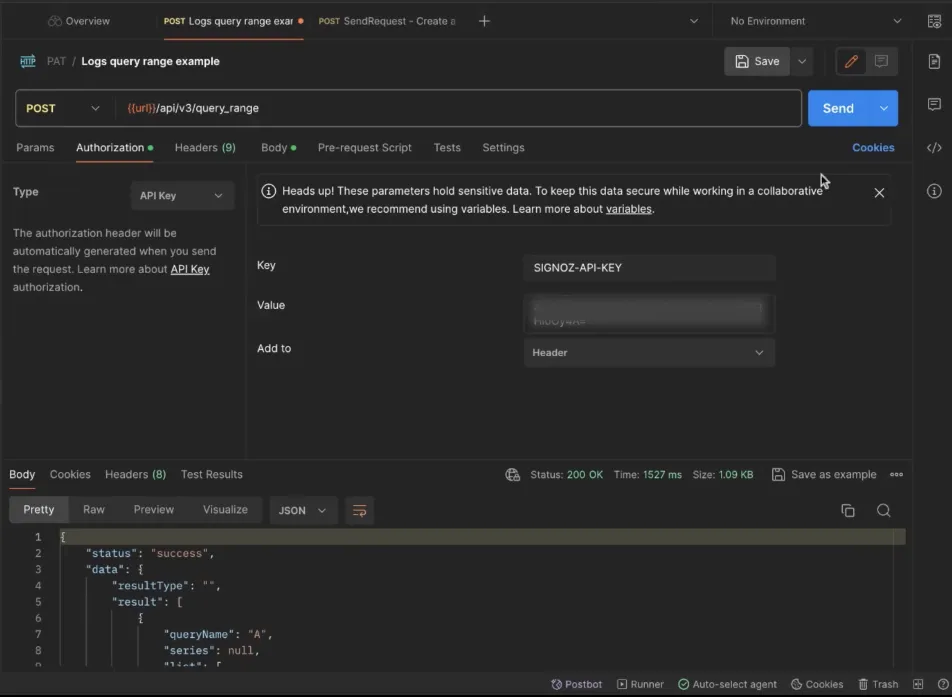
Step 3: Using the relevant payload, you can fetch logs based on your requirements using the access token generated.
SigNoz News
We did our first launch week
We did our first launch week, and we introduced some cool new features in SigNoz to the community. We ship fast but often miss sharing the story behind these features with our community.
Launch week for us is an opportunity to share the behind-the-scenes of new features that we have built in the recent past.
You can find all the features that were in the spotlight during the launch week here.
Day 1 - Logs Explorer
Day 2 - Metrics & Query Builder
Day 3 - Frontend Monitoring
Day 4 - Logs Pipeline
Day 5 - Access Token Management & Onboarding
SigNoz at Upcoming Kubecon Paris
We’re excited to announce our talk on using OpAMP within OpenTelemetry has been selected for Observability Day at Kubecon Paris this March!
Srikanth from our team will be presenting the talk and making the debut for team SigNoz at Kubecon.
If you're attending Kubecon Paris, make sure to catch our talk and meet our team. Here's the link to the talk if you want to add it to your schedule.

User Shoutout
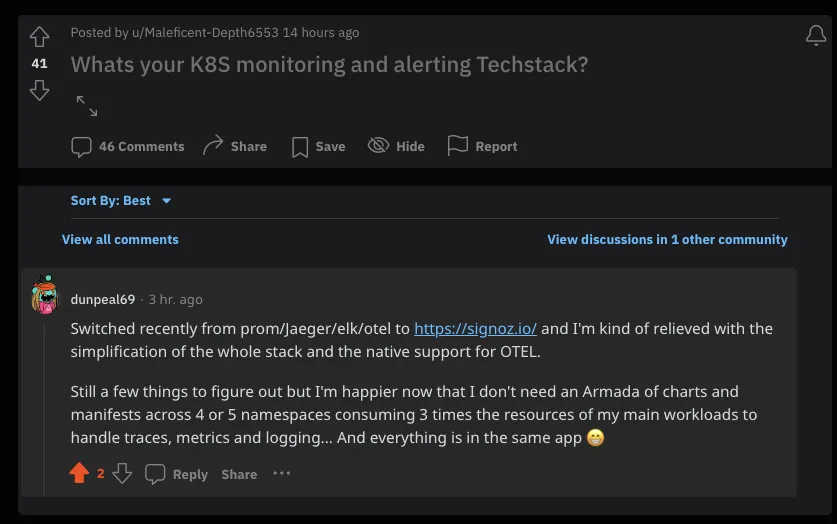
The greatest motivation for us comes from users recognizing the value that SigNoz offers. One user highlighted the difficulty of using separate platforms for metrics, traces, and logs. They noted that correlating data becomes challenging due to the need for extensive copying and pasting of IDs from one platform to another.
The user was using different tools like Prometheus, Jaeger, ELk, etc., for different signals. They replaced all the tools with SigNoz to get everything under a single pane of glass.
Contributor highlight
Every month, contributors from our community help make SigNoz better. We want to thank the following contributors who made contributions to SigNoz last month 🤗


A Chat with Ankit, SigNoz Co-founder & CTO
Pranay sat down with Ankit to discuss a lot of interesting things about SigNoz, OpenTelemetry, and Observability. They discussed evolution of SigNoz, and some stories from early days. Ankit also shared his views on why we believe OpenTelemetry is the future, and some interesting points on future trends in observability.
You can watch the talk here:
Thank you for taking out the time to read this issue :) If you have any feedback or want any changes to the format, please create an issue.
Feel free to join our Slack community and say hi! 👋