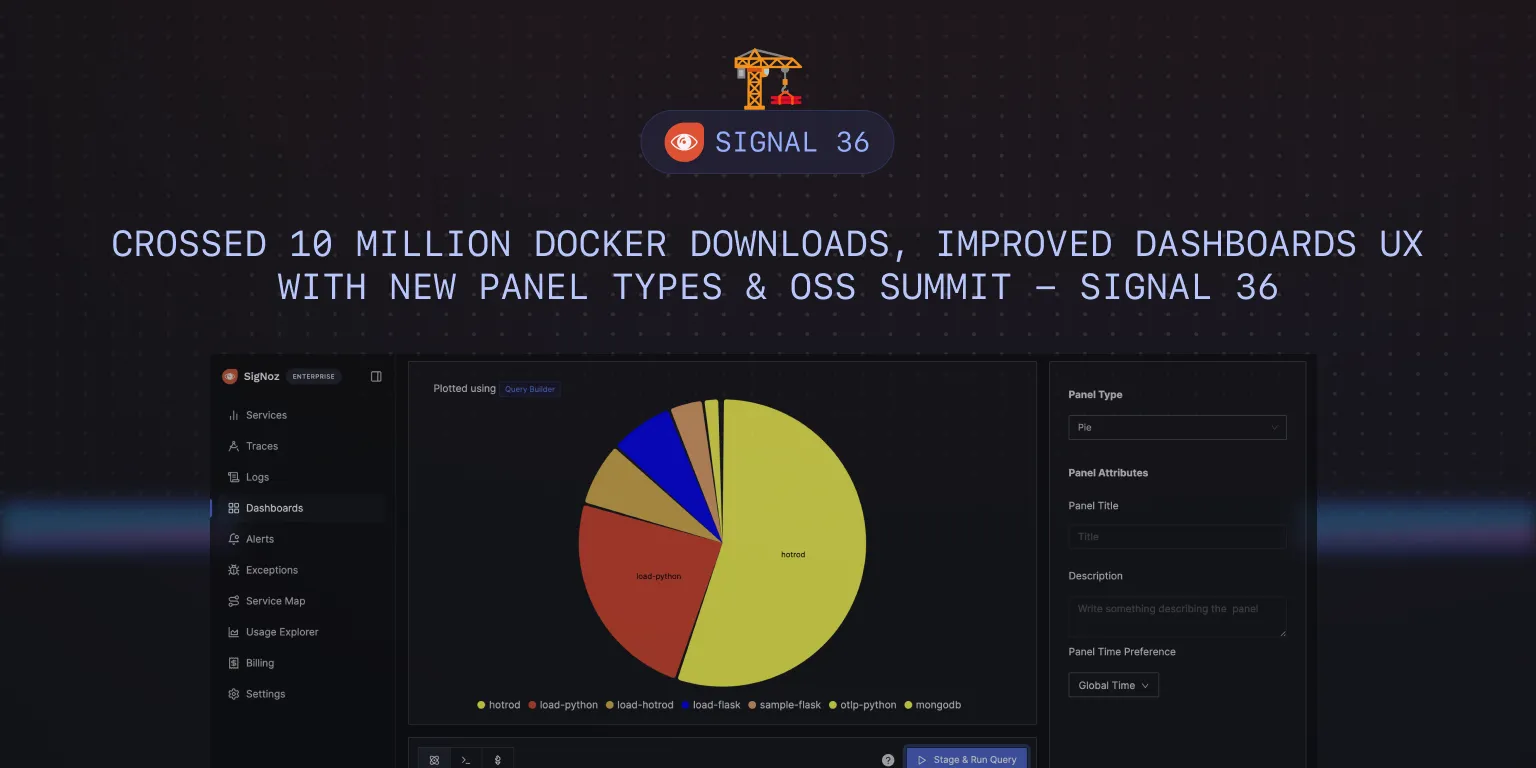
Crossed 10 Million Docker Downloads, Improved Dashboards UX with New Panel Types & OSS Summit - SigNal 36
If you double the number of experiments you do per year, you’re going to double your inventiveness
-Jeff Bezos
Welcome to SigNal 36, the 36th edition of our monthly product newsletter! We crossed 10 Million Docker downloads for our open source project. We’ve enhanced our Dashboards UX and incorporated feedback from users in different areas of our product.
Let’s see what humans of SigNoz were up to in the month of April 2024.
What We Shipped?
Latest release: v0.44.0
Previous release: v0.43.0
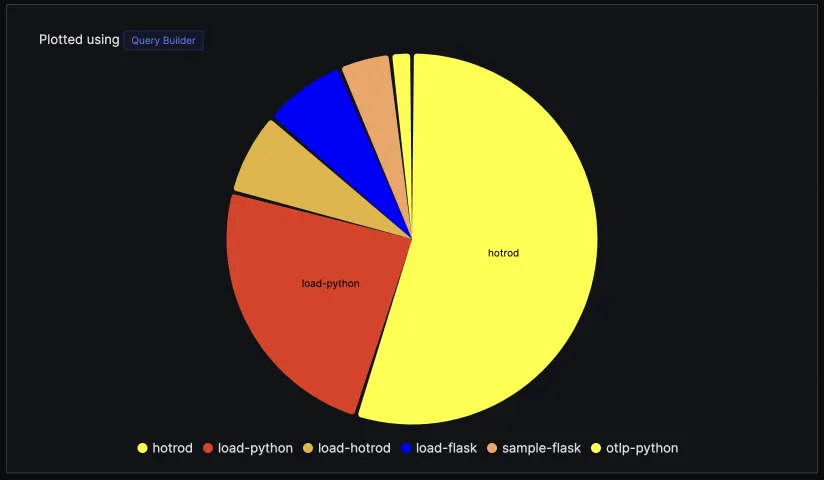
New Panel Visualization Type in Dashboards
We are increasing the number of panel visualization types supported for creating dashboards. This will enable our users to visualize their observability data better. We shipped the support for pie chart visualization in our recent release. Our users can create pie charts for data that suits them.
Support for Changing Panel Types while writing queries
We currently support the following visualization types in our dashboards.
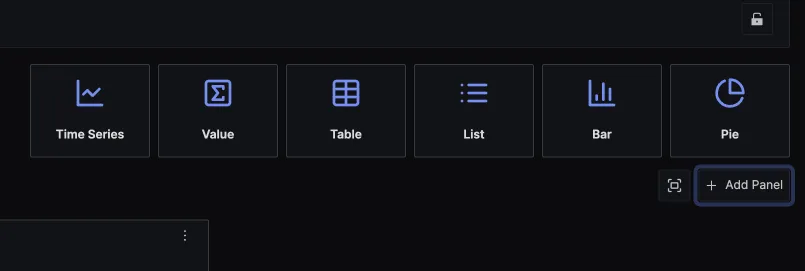
Earlier, once you selected the panel visualization type while creating a new chart, you couldn’t change it while writing queries.
Now, you can change panel types while writing queries, too, with the help of a simple dropdown.
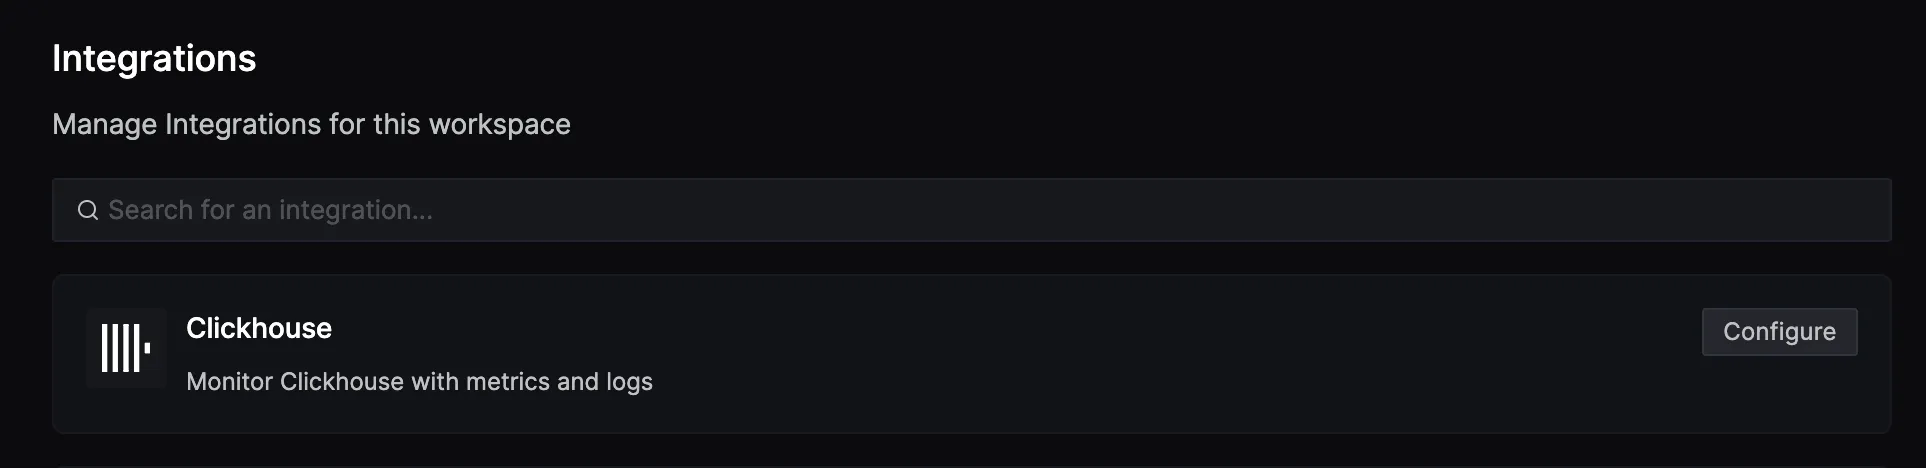
Added Clickhouse Integrations
We have added integrations for Clickhouse using which you can easily monitor key Clickhouse metrics and view them with an out of box dashboard. You can also collect logs for better visibility into your Clickhouse instance health.
Improved Integration flow for a better user experience
We are working on adding more integrations to SigNoz while improving the flow for a better user experience. If you have not configured your data source to send data to SigNoz, you will be guided to the configuration steps.
Drag Select Time Range in the charts view of Alerts
We have shipped the ability to change the time range of a chart by dragging the cursor over the chart. It will help users to quickly zoom in on areas of the chart they want to inspect further.
Share Views with relative or absolute time range
Users can share views with their teammates for improved collaboration. Oftentimes, they might need to share the view of a specific time range. We have shipped a toggle that enables you to share views with absolute time range.
When sharing a view with the Last 4 days time range selected, users will see data from the past four days relative to when they open the link. If the absolute time range is enabled, users will view data from the specific time window at the moment the link was shared.
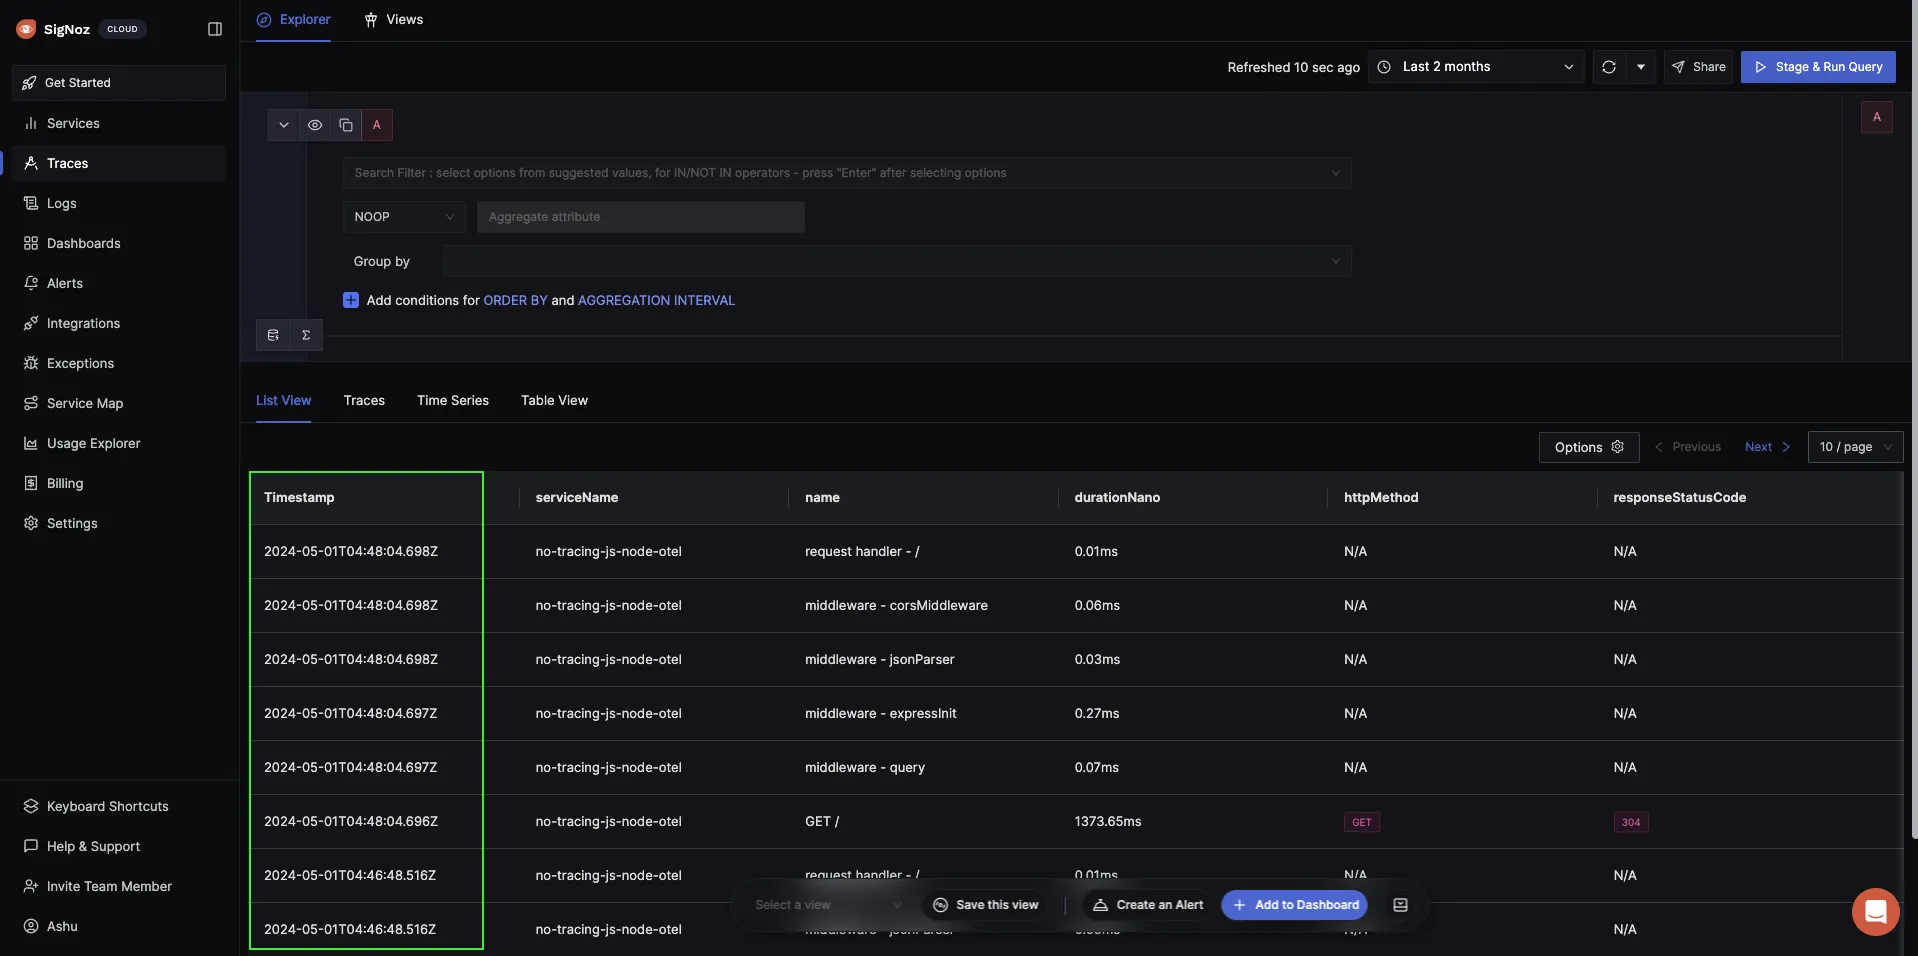
Added Timestamp Column in List of Trace Explorer
We have added the timestamp column in the list view of the new Trace Explorer page. It will improve the user experience while exploring trace data from your applications.
SigNoz News
Crossed 10 Million+ Docker Downloads
We crossed 10 million Docker downloads for our open-source project. 🥳 It’s a significant milestone in our journey of open-source observability.
It’s exciting to see the impact of SigNoz across the globe in helping developers build better applications with observability based on OpenTelemetry.
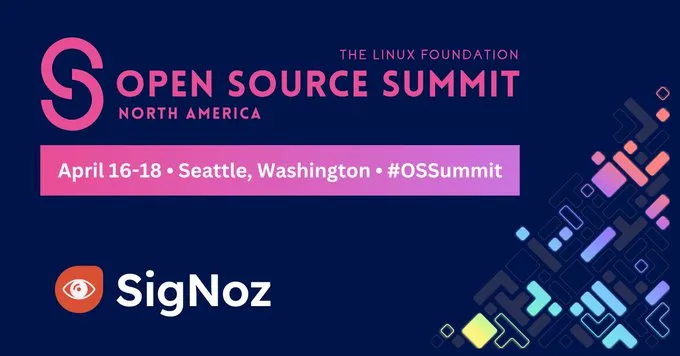
SigNoz at the OSS summit
We attended the OSS summit in Seattle from April 16 to April 18. It was great meeting folks from the open-source ecosystem powering the next generation of open-source software.
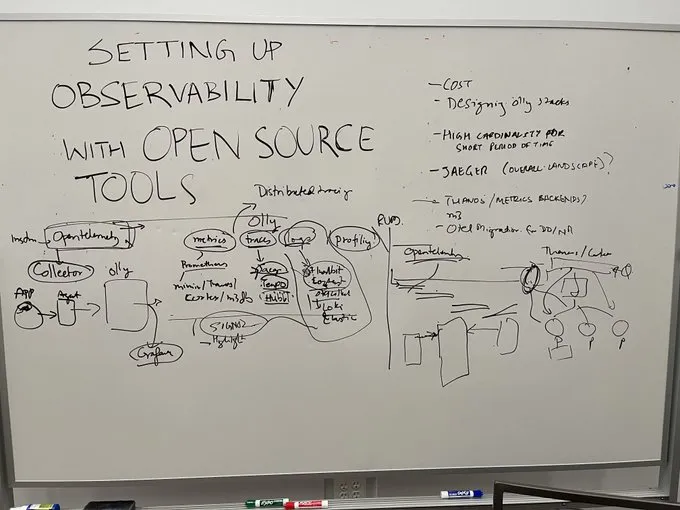
Pranay conducted an unconference session on setting up observability with open-source tools and it was great to see folks interested in OpenTelemetry.
OpenTelemetry will set strong foundations for open-source observability in 2024.
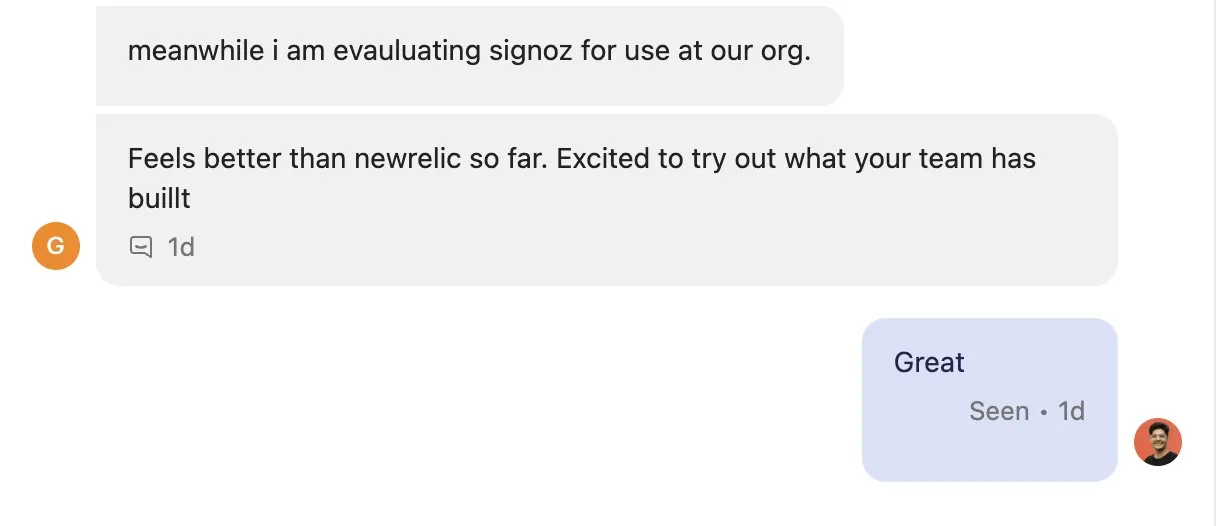
Replacing the Giants
It’s exciting to see users finding more value in SigNoz compared to incumbents like New Relic. At SigNoz, we are re-imagining observability with an open-source stack. But that’s not all.
Community Tutorial on tracing GenAI applications with SigNoz
Shoutout to our community member, Karthik Kalyanaraman, CTO & co-founder at Langtrace AI, for creating a tutorial on tracing generative AI applications with SigNoz.
Integrating Langtrace with SigNoz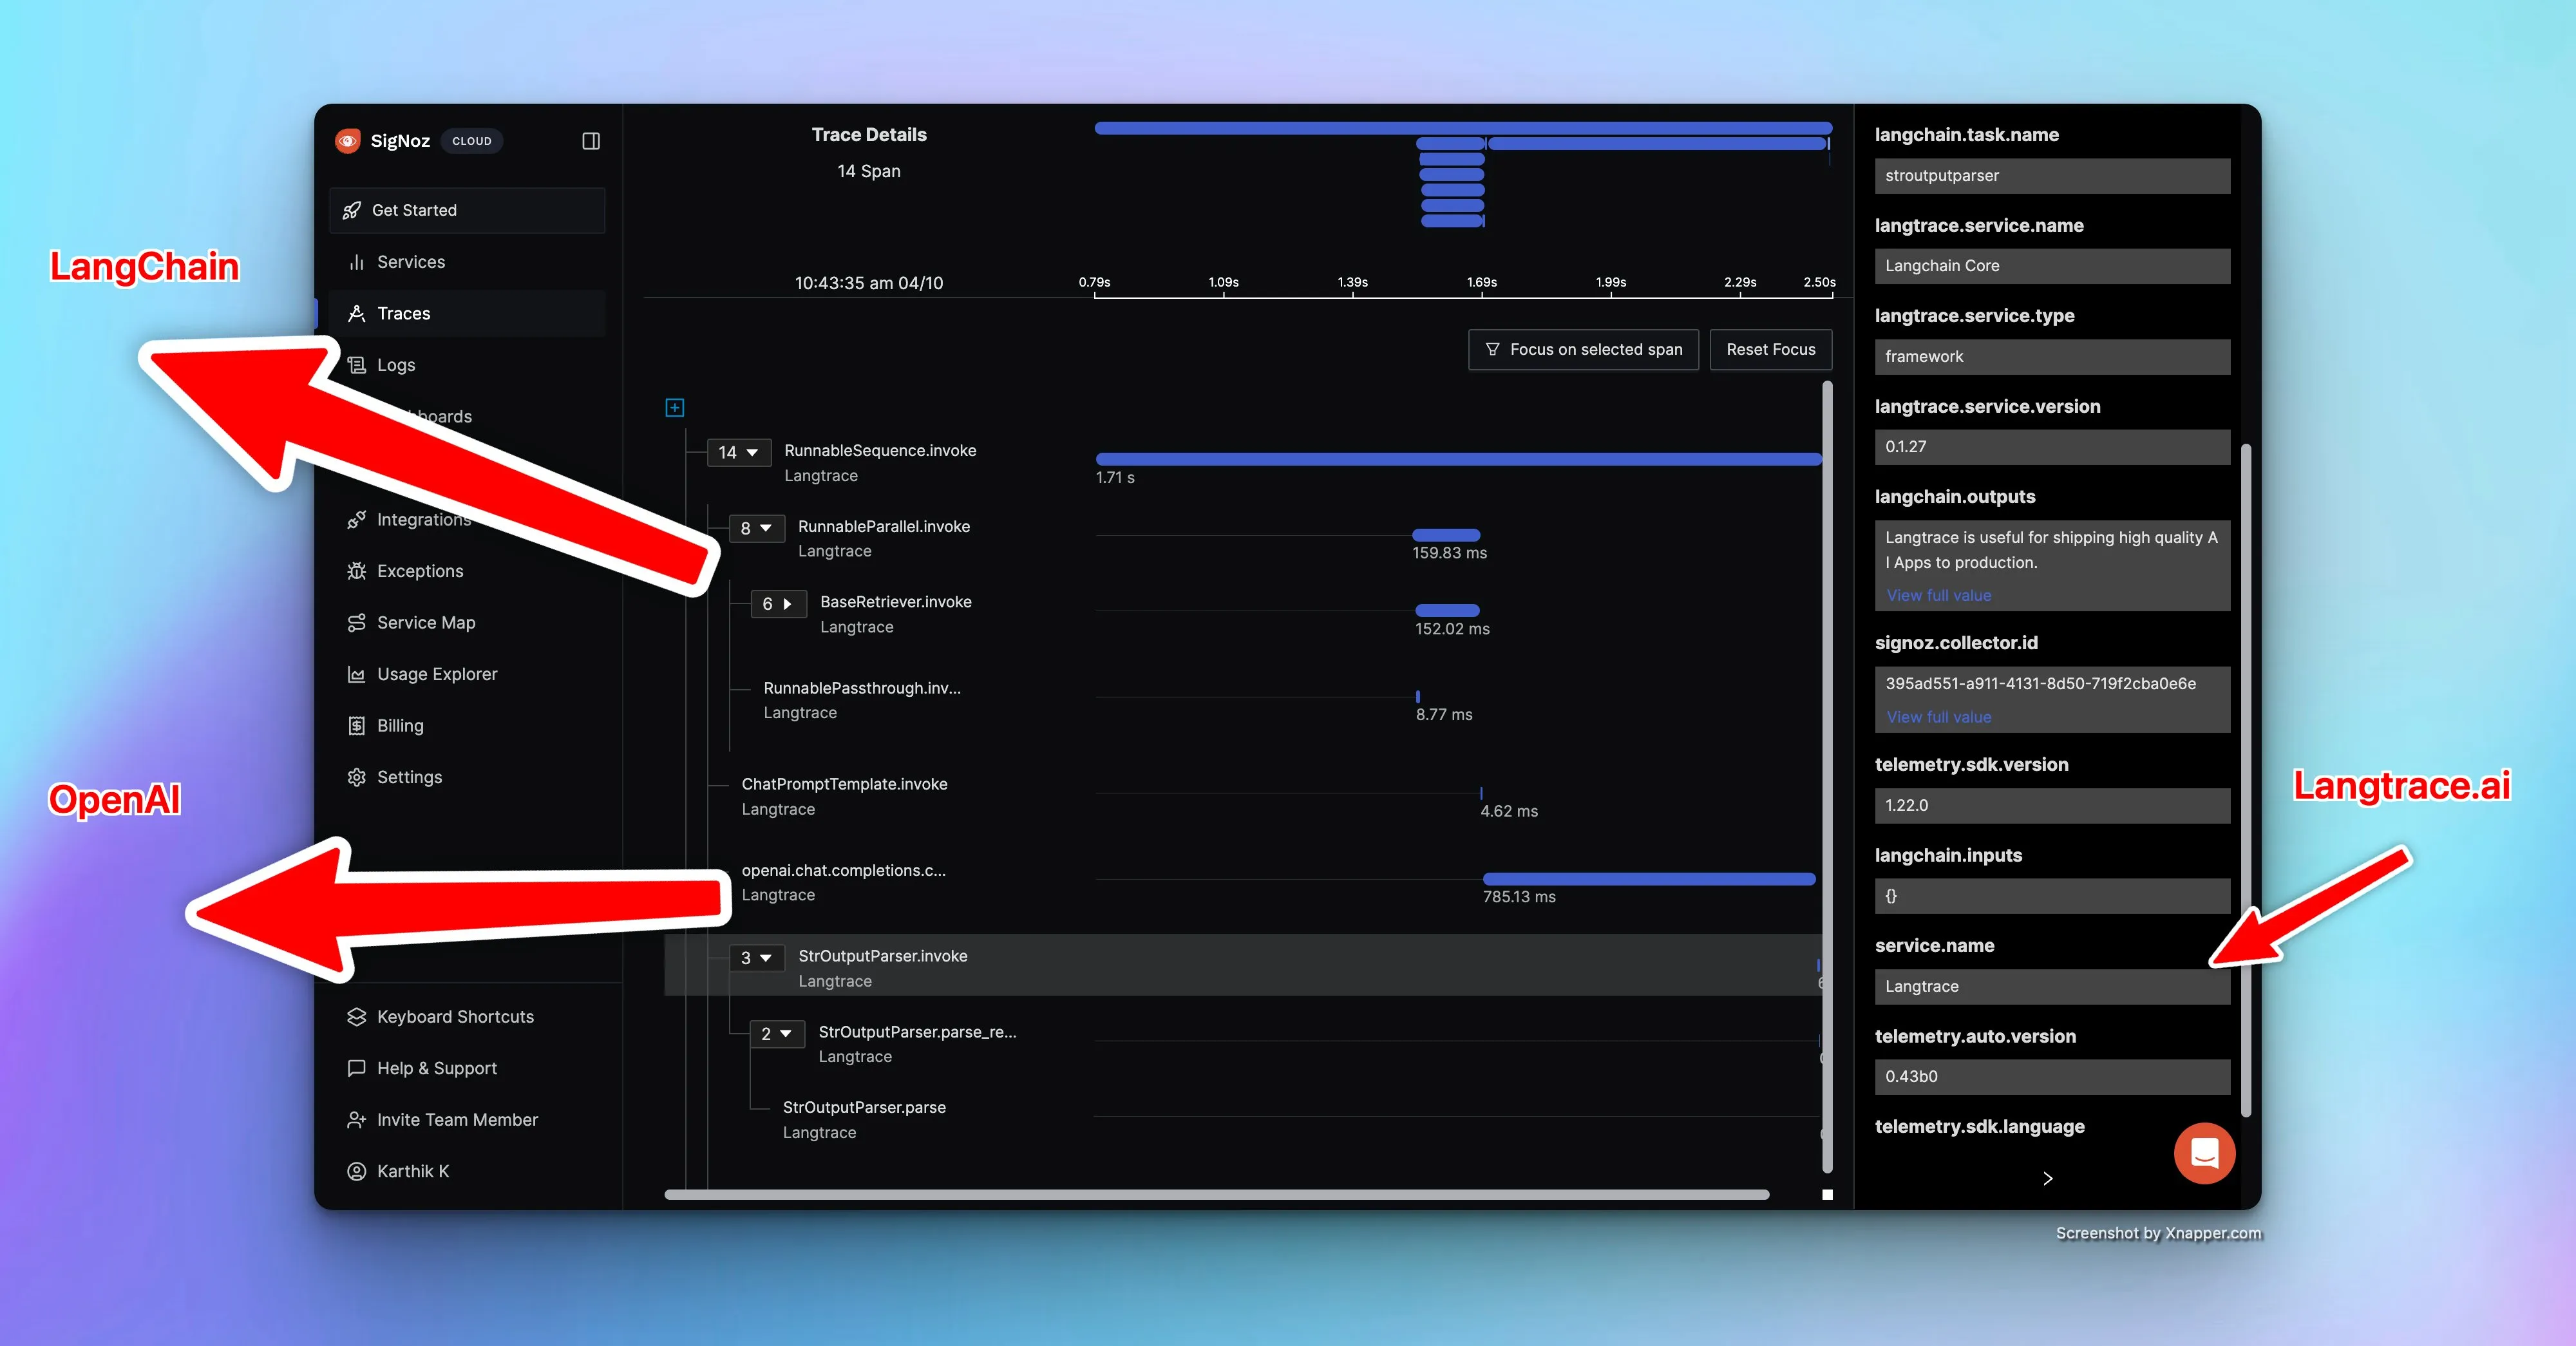
Contributors Highlight
Every month, contributors from our community help make SigNoz better. We want to thank the following contributors who made contributions to SigNoz last month 🤗


From the blog
OpenTelemetry took the monitoring world by storm. We built SigNoz as an OpenTelemetry-native APM since day 1 as we believed in the idea of open-source instrumentation. Now, every other vendor claims to be OpenTelemetry compatible, but how true is it?
We tried out popular observability tools like Datadog and New Relic to see how easy it is to integrate them with OpenTelemetry, and we found interesting things. Read on to find out how OpenTelemetry supports DataDog and New Relic.
Comparing Datadog and New Relic's support for OpenTelemetry data
Thank you for taking out the time to read this issue :) If you have any feedback or want any changes to the format, please create an issue.
Feel free to join our Slack community and say hi! 👋