DataDog vs Prometheus - Comprehensive Comparison Guide [2026]
Both DataDog and Prometheus are application monitoring tools aimed to improve application performance. While Datadog is a cloud-based SaaS solution, meaning there's no need to install or maintain any infrastructure, Prometheus is an open-source tool that requires manual download and installation on your infrastructure. Let us compare DataDog and Prometheus to see which tool suits
The biggest difference between Datadog and Prometheus is that while Prometheus is open-source, Datadog is proprietary. To use Prometheus, you will have to install it in your own infrastructure. Datadog provides a SaaS service to which you can send your monitoring data to.
In this article, we will explore the differences between DataDog and Prometheus based on these categories:
- Getting started
- Features
- Pricing
We will also explore the key features of DataDog and Prometheus.
While DataDog and Prometheus are great monitoring tools, they have their limitations. DataDog is an enterprise SaaS tool with complex pricing tiers. Prometheus is an open-source metrics monitoring tool with limited UI and requires effort to set up and scale.
You can check out SigNoz - an open-source APM tool that provides metrics, traces, and logs under a single pane of glass.
Comparing DataDog and Prometheus
The major difference between DataDog and Prometheus lies in the scope of monitoring that each tool covers. DataDog is an enterprise SaaS tool that offers products that cover the entire domain of monitoring.
On the other hand, Prometheus is an open-source metrics monitoring tool used to monitor metrics or time-series data.
In practice the two are often used together rather than treated as strict either/or choices, since Datadog can scrape Prometheus metrics directly. Prometheus has also kept moving: Prometheus 3.0, released at the end of 2024, added native histograms, UTF-8 metric names, and native OTLP ingestion.
Some of the key differences between DataDog and Prometheus at a glance:
| Categories | Datadog | Prometheus |
|---|---|---|
| Deployment | Cloud-based SaaS solution | Manual download |
| Data collection | Uses pre-built connectors | Uses exporters |
| Data Visualization | Pre-built and custom visualizations | Built-in expression browser |
| Real-time monitoring | Provides real time monitoring | Utilizes a pull-based model for real-time monitoring |
| Machine learning | Provides diverse machine learning capabilities | No support for machine learning |
| Search capabilities | Robust search interface | Uses PromQL |
| Pricing | Cloud-based, Paid | Open source, free |
| Support | Comprehensive documentation, email and chat support | Documentation and community support |
Getting Started - Datadog is easier
Datadog:
Deployment: Datadog is a cloud-based SaaS solution, meaning there's no need to install or maintain any infrastructure. Simply sign up, install the Datadog Agent on your infrastructure, and begin sending metrics and logs to the platform.
Data Collection: Datadog can collect data from a myriad of sources using integrations. These pre-built connectors allow data collection from specific technologies or platforms. Custom integrations are also supported.
Prometheus:
Deployment: Being open-source, Prometheus requires manual download and installation on your infrastructure. It comprises various components, including the Prometheus server, exporters, and client libraries.
Data Collection: Prometheus uses exporters to collect data. An exporter exposes metrics in a format that Prometheus can scrape. Numerous exporters are available for different technologies.
Features - Datadog has much more to offer
Datadog:
Data Visualization: Offers a plethora of visualization tools, including dashboards, graphs, and maps. Custom visualizations are also supported.
Real-time Monitoring: Provides real-time monitoring through metrics, logs, and traces. Distributed tracing is available to track individual request performance.
Search Capabilities: A robust search interface with various filters and operators. Anomaly detection using machine learning identifies unusual data patterns.
Machine Learning: Features like anomaly detection and forecasting are driven by machine learning. Custom ML models can also be built.
Prometheus:
Data Visualization: Comes with a built-in expression browser for data exploration. However, for advanced visualization, integration with Grafana is common.
Real-time Monitoring: Regularly scrapes metrics from targets for real-time monitoring. Recording rules pre-aggregate data for easier real-time analysis.
Search Capabilities: Uses PromQL, a query language, to search through its time-series database. PromDash, a dashboard builder, allows custom dashboard creation using PromQL queries.
Pricing - Prometheus is free(but has infra costs), Datadog can blow up bills
Datadog:
Offers a free trial. Post-trial, users can opt for various paid plans based on data volume and feature requirements. Plans are categorized into Essential, Pro, and Enterprise tiers.
But you need to ask whether getting Datadog is worth it or not.
Prometheus:
Being open-source, it's free to download and use. However, associated costs might arise from hosting and maintaining the necessary infrastructure.
Key Features of DataDog
DataDog is an enterprise SaaS tool that offers an array of services in the monitoring domain. Some of the key features of the DataDog monitoring platform includes:
-
Log Management
DataDog offers scalable log ingestion and analytics through its log management product. You can search, filter, and analyze log data through its dashboard. You can route all your logs from one central control panel. -
Application performance monitoring
DataDog's APM tool provides end-to-end distributed tracing from frontend devices to databases. You can connect the collected traces to infrastructure metrics, network calls, and live processes. -
Security monitoring
Using DataDog security monitoring, you can analyze operational and security logs in real-time. It provides built-in threshold and anomaly detection rules to detect threats quickly. -
Network monitoring
With DataDog network monitoring, you can analyze traffic as it flows across applications, containers, availability zones, and on-premise servers. You can track key network metrics like TCP retransmits, latency, and connection churn. -
Real user monitoring
With DataDog's real user Monitoring, you can have end-to-end visibility into user journeys for web and mobile applications.
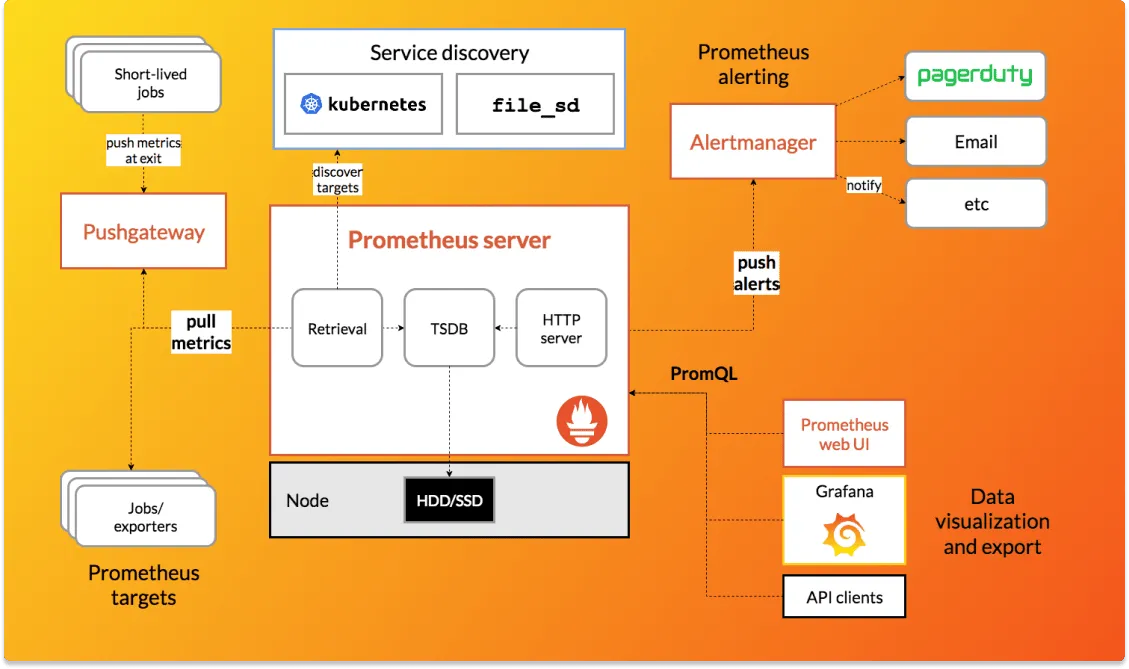
Key Features of Prometheus
Prometheus was initially developed at SoundCloud in 2012 before being released as an open-source project. It got accepted into the CloudNative Computing Foundation in 2016 and was the second project to graduate from the foundation, following Kubernetes.
Prometheus enables you to capture time-series data as metrics. These metrics can be aggregated to give insights into the behavior of our systems.
Some of the key features of Prometheus metrics monitoring are:
-
Multi-dimensional data model Prometheus stores data as time-series. For example, it can store time-stamped values of the total number of HTTP requests received. You can also store an optional set of key-value pairs called labels for that metric. The multi-dimensional data model enables rich contextual metrics monitoring. Notation of time-series metrics:
<metric name>{<label name>=<label value>, ...} -
Flexible query language
Prometheus provides a query language called PromQL. Using PromQL, you can filter and aggregate metrics data in real-time. -
Pull model data collection
In contrast to most APM tools, Prometheus data collection is pull-based. It requires you to run an HTTP server that exposes Prometheus metrics. -
Alert manager
You can use a rules.yml file to set alerts for critical issues. You need to install the alert manager to get useful notifications from Prometheus. It has some cool features like grouping alerts into one notification and silencing alerts for a period of time. -
Visualization layer
The visualization layer of Prometheus is basic, but it can be combined with Grafana - another open-source web visualization tool to create rich visualizations of monitoring data.
Cut Your Observability Spend by 80%—Here's How
Switch from Datadog seamlessly with our automated migration tool, comparable features and up to 80% cost savings.
A better alternative to DataDog and Prometheus - SigNoz
SigNoz is a full-stack open-source application performance monitoring and observability tool which can be used in place of DataDog and Prometheus. SigNoz is built to give SaaS like user experience combined with the perks of open-source software. It provides metrics, logs, and traces under a single pane of glass.
Key architecture features:
-
Native OpenTelemetry support
SigNoz is built to support OpenTelemetry natively, which is quietly becoming the world standard to generate and manage telemetry data. -
Uses Columnar database
SigNoz uses Clickhouse as its datastore. Many big companies like Uber and Cloudflare have been shifting to ClickHouse as their choice of observability datastore.
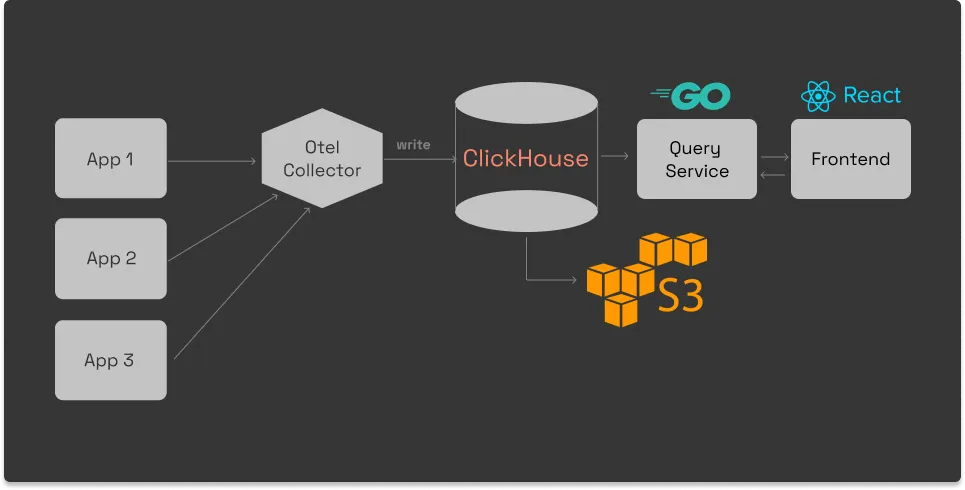
Architecture of SigNoz with ClickHouse as storage backend and OpenTelemetry for code instrumentatiion
SigNoz comes with out of box visualization of things like RED metrics.

SigNoz UI showing application overview metrics like RPS, 50th/90th/99th Percentile latencies, and Error Rate
You can also use flamegraphs to visualize spans from your trace data. All of this comes out of the box with SigNoz.

You can also build custom metrics dashboard for your infrastructure.
Some of the things SigNoz can help you track:
- Visualise Traces, Metrics, and Logs in a single pane of glass
- Monitor application metrics like p99 latency, error rates for your services, external API calls, and individual endpoints.
- Find the root cause of the problem by going to the exact traces which are causing the problem and see detailed flamegraphs of individual request traces.
- Run aggregates on trace data to get business-relevant metrics
- Filter and query logs, build dashboards and alerts based on attributes in logs
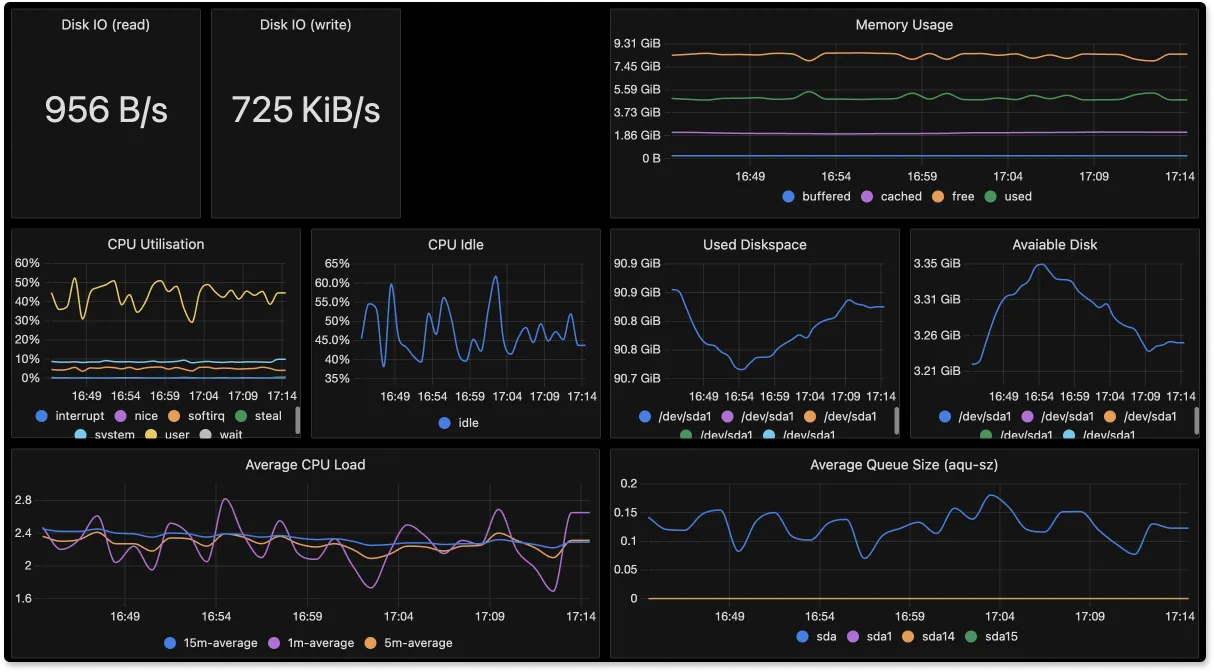
- Monitor infrastructure metrics such as CPU utilization or memory usage
- Record exceptions automatically in Python, Java, Ruby, and Javascript
- Easy to set alerts with DIY query builder
If you're still weighing your options, both tools have broader roundups worth a look: the Prometheus alternatives and Datadog alternatives guides, along with Prometheus vs Grafana and OpenTelemetry vs Prometheus if you want to weigh Prometheus against adjacent tools. On the Prometheus side specifically, Loki vs Prometheus, Prometheus vs InfluxDB, and Zabbix vs Prometheus are all useful next reads.
Getting started with SigNoz
SigNoz Cloud is the easiest way to run SigNoz. Sign up for a free account and get 30 days of unlimited access to all features.

You can also install and self-host SigNoz yourself since it is open-source. With 24,000+ GitHub stars, open-source SigNoz is loved by developers. Find the instructions to self-host SigNoz.
SigNoz Cloud is the easiest way to run SigNoz. Sign up for a free account and get 30 days of unlimited access to all features.
You can also install and self-host SigNoz yourself since it is open-source. With 24,000+ GitHub stars, open-source SigNoz is loved by developers. Find the instructions to self-host SigNoz.
Related Content
