Jaeger vs Elastic APM - key differences, features and alternatives
Jaeger is an open-source end-to-end distributed tracing tool for microservices architecture. On the other hand, Elastic APM is an application performance monitoring system that is built on top of the ELK Stack (Elasticsearch, Logstash, Kibana, Beats). In this article, let's explore their key features, differences, and alternatives.
Application performance monitoring is the process of keeping your app's health in check. APM tools enable you to be proactive about meeting the demands of your customers. There are many components to a good APM tool like metrics monitoring, distributed tracing, log management, alert systems, etc.
Jaeger and Elastic APM are both popular tools in the domain of application performance monitoring. But both have different scope and use-cases.
Key Features of Jaeger
Jaeger was originally built by teams at Uber and then open-sourced. It is used for end-to-end distributed tracing for microservices. Some of the key features of Jaeger includes:
-
Distributed context propagation
One of the challenges of distributed systems is to have a standard format for passing context across process boundaries and services. Jaeger provides client libraries that support code instrumentation in multiple languages to propagate context across services -
Distributed transaction monitoring
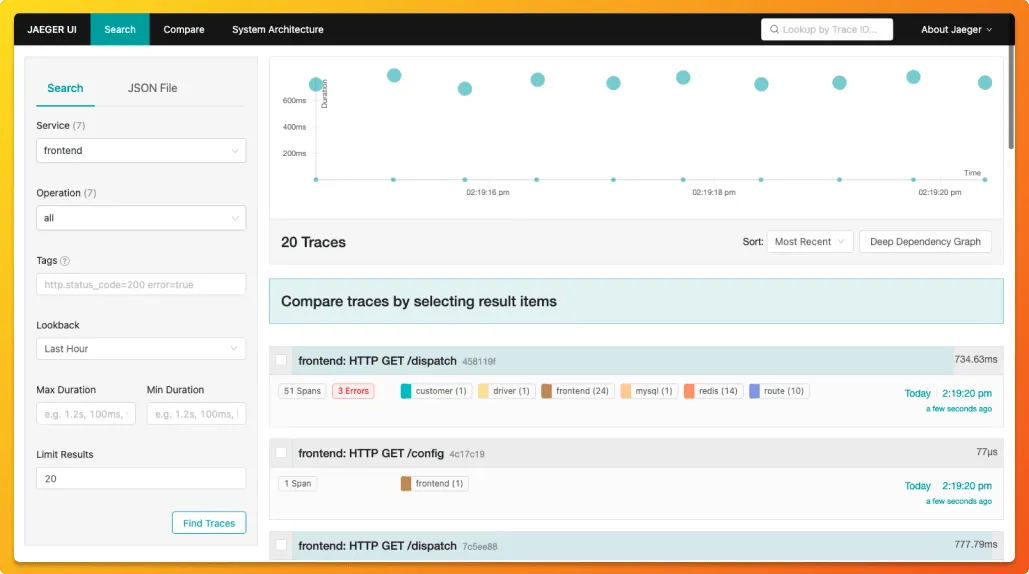
Jaeger comes with a web UI written in Javascript. The dashboard can be used to see traces and spans across services. -
Root Cause Analysis
Using traces you can drill down to services causing latency in particular user request. -
Server dependency analysis
Using Jaeger's web UI, you can see how requests flow through different services and different servers interact while serving user requests. -
Performance/latency optimization
Once you have identified, which service or query is creating latency, you can use the information to optimize it.
Key features of Elastic APM
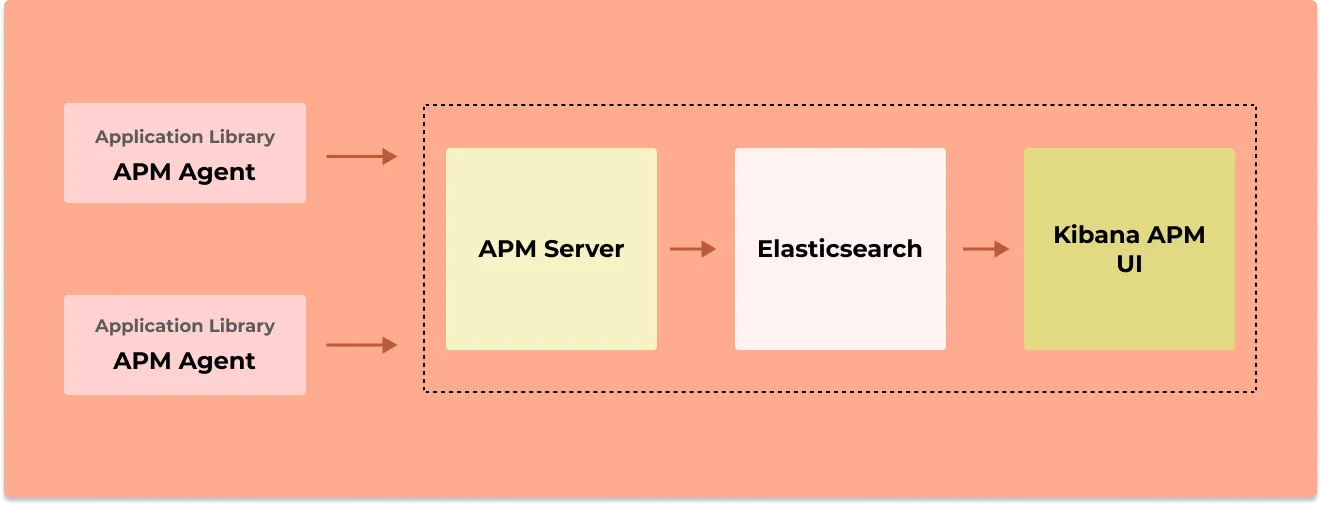
Elastic APM consists of four components: APM agents, APM Server, Elasticsearch, and Kibana. Some of you might be familiar with the popular ELK stack which comprises of Elasticsearch, Logstash and Kibana. The ELK stack is used for collecting and analyzing logs. Elastic APM is an effort by Elastic to venture into the field of application performance monitoring.
The four major components of elastic APM has the following features:
- Elasticsearch - For data storage and indexing
- Kibana - For analyzing and visualizing the data
- APM agents - Collects the data to send to the APM server
- APM server - Receives data from APM agents and process it for storing in Elasticsearch
Some of the key features of Elastic APM includes:
-
Root Cause investigations
Elastic APM provides a dashboard for showing a service's transactions and dependencies which can be used to identify issues. -
Service Maps
With service maps, you can see how your services are connected to each other. It provides a convenient way to see which services need optimization. -
Distributed Tracing
Distributed tracing provides an overview of how user requests are performing across services. -
Anamoly Detection with machine learning
Elastic APM provides machine learning capabilities to find anomalies that suggest abnormal behavior in your application performance. -
Alerting features
Elastic APM provides capabilities to set threshold based alerts through popular channels like Slack, PagerDuty, etc. -
Multi-language support
Elastic APM provides support for Java, Go, Node.js, Python, PHP, Ruby, .NET and Javascript.
Jaeger vs Elastic APM - At a glance
| Feature | Jaeger | Elastic APM |
|---|---|---|
| Use Case | Primarily for distributed tracing | Application Performance Monitoring (APM) with integrated tracing |
| License | Open-source | Elastic License |
| Tracing | Yes | Yes |
| Storage Backend | Elasticsearch, Cassandra | Elasticsearch |
| Language Support | Multiple (Go, Java, Python, etc.) | Multiple (Java, Python, Node.js, etc.) |
| Visualization | Limited | Yes (via Kibana) |
| Vendor Lock-in | Low (OpenTracing/OpenTelemetry compatible) | Yes (Elastic Stack) |
| Metrics and Logs | Not available | Available |
| Cost | Free (open-source licensing) | Paid (Elastic Licensing) |
Comparing Jaeger and Elastic APM
From the description above, you might have a good idea about the differences between Jaeger and Elastic APM. The major difference between the two is that Jaeger is specifically meant for distributed tracing, whereas Elastic APM is a full-fledged application performance monitoring tool.
Summarizing the key differences between Jaeger and Elastic APM:
-
Jaeger is an open-source distributed tracing tool meant for microservices. Elastic APM is an APM tool that provides metrics and log monitoring along with distributed tracing.
-
Jaeger's instrumentation libraries are based on OpenTracing APIs, which is an open-source standard for providing vendor-neutral instrumentation libraries. OpenTracing based telemetry data is supported by multiple APM vendors. If you decide to use Elastic APM, your telemetry data can only be used by Elastic APM.
Jaeger is a good tool when it comes to distributed tracing. But only traces is not enough for equipping your engineering teams to solve issues in production. And that's why Jaeger is limited. On the other hand, with Elastic APM, there is a risk of having your data locked in.
The collection and management of telemetry data are critical to setting up a robust monitoring and observability framework. If you want to have a scalable distributed system, it becomes critical to have a standard format for collecting and managing telemetry data.
Open-source standards like OpenTelemetry aims to standardize the management of telemetry data. As a project under CNCF, it has got wide community support and is also backed by major cloud vendors like Microsoft and Google.
So is there a tool that can provide you extensive APM capabilities along with the freedom that comes with open-source standards?
That's where SigNoz comes into the picture.
Alternative to Elastic APM and Jaeger - SigNoz
SigNoz is a full-stack open-source application performance monitoring and observability tool which can be used in place of Elastic APM and Jaeger. It provides advanced distributed tracing capabilities along with metrics under a single dashboard.
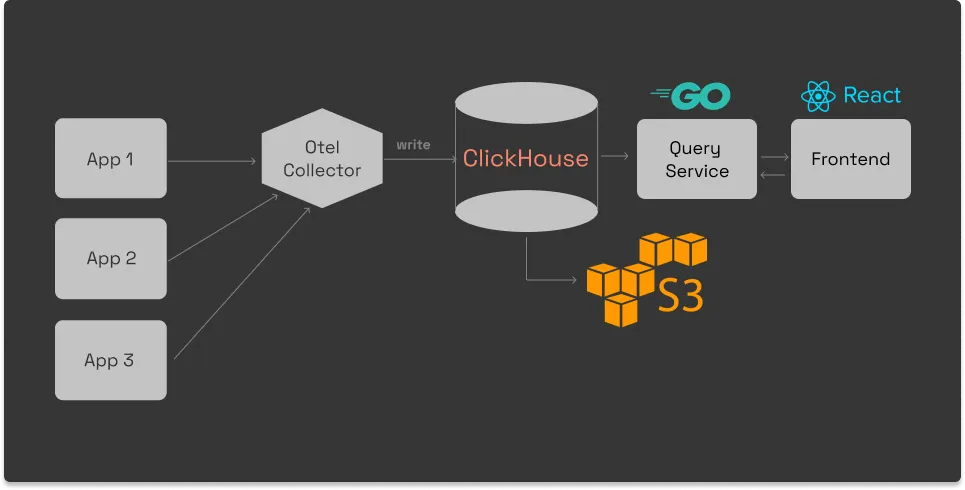
SigNoz is built to support OpenTelemetry natively. OpenTelemetry is becoming the world standard for generating and managing telemetry data (Logs, metrics and traces). It provides a fast OLAP datastore, ClickHouse as the storage backend.
SigNoz comes with out of box visualization of things like RED metrics.

You can also use flamegraphs to visualize spans from your trace data. All of this comes out of the box with SigNoz.

Some of the things SigNoz can help you track:
- Application overview metrics like RPS, 50th/90th/99th Percentile latencies, and Error Rate
- Slowest endpoints in your application
- See exact request trace to figure out issues in downstream services, slow DB queries, call to 3rd party services like payment gateways, etc
- Filter traces by service name, operation, latency, error, tags/annotations.
- Run aggregates on trace data
- Unified UI for both metrics and traces
Getting started with SigNoz
SigNoz Cloud is the easiest way to run SigNoz. Sign up for a free account and get 30 days of unlimited access to all features.

You can also install and self-host SigNoz yourself since it is open-source. With 24,000+ GitHub stars, open-source SigNoz is loved by developers. Find the instructions to self-host SigNoz.
Related Content
