Jaeger vs Zipkin - Choosing the Right Tracing Tool
Distributed tracing is becoming a critical component of any application's performance monitoring stack. However, setting it up in-house is an arduous task, and that's why many companies prefer outside tools. Jaeger and Zipkin are two popular open-source projects used for end-to-end distributed tracing. Let us explore their key differences in this article.
Both Zipkin and Jaeger are popular open-source distributed tracing tools. Zipkin was originally inspired by Google's Dapper and was developed by Twitter. Zipkin is a much older project than Jaeger and was first released as an open-source project in 2012. Jaeger was originally built by teams at Uber and then open-sourced in 2015. It got accepted as a Cloud Native incubation project in 2017 and graduated in 2019.

What is distributed tracing?
In the world of microservices, a user request travels through hundreds of services before serving a user what they need. To make a business scalable, engineering teams are responsible for particular services with no insight into how the system performs as a whole. And that's where distributed tracing comes into the picture.
Distributed tracing gives you insight into how a particular service is performing as part of the whole in a distributed software system. There are two important concepts involved in distributed tracing: Spans and trace context.
What are Distributed Tracing Tools?
Distributed tracing tools provide visibility into the flow of requests as they traverse through various services in a distributed system. These tools help developers and operators understand the performance characteristics and behavior of their applications at a granular level.
Key components of distributed tracing include:
- Spans: Represent a unit of work or operation within a trace.
- Traces: A collection of spans that form a tree-like structure, showing the path of a request.
- Context Propagation: The mechanism for passing trace information between services.
Benefits of using distributed tracing tools:
- End-to-end visibility: Trace requests across multiple services and databases.
- Performance optimization: Identify bottlenecks and latency issues in your system.
- Root cause analysis: Quickly pinpoint the source of errors or slow performance.
- Service dependency mapping: Understand how different components of your system interact.
OpenTelemetry, an open-source observability framework, has emerged as a standard for instrumenting, generating, and collecting telemetry data. It provides a unified way to instrument applications for various tracing tools, including Jaeger and Zipkin.
Jaeger and Zipkin: Key components
Jaeger's source code is primarily written in Go, while Zipkin's source code is primarily written in Java. The architecture of Jaeger and Zipkin is somewhat similar. Major components in both architectures include:
- Instrumentation Libraries
- Collectors
- Query Service and web UI
- Database Storage
Instrumentation Libraries
Instrumentation is the process of generating telemetry data(logs, metrics, and traces) from an application code. Both Jaeger and Zipkin provide language-specific instrumentation libraries. Instrumentation enables a service to create spans on incoming requests and to attach context information on outgoing requests.
Key points to note about instrumentation libraries of Jaeger and Zipkin:
- Jaeger recommends using OpenTelemetry APIs and SDKs for generating traces. Using OpenTelemetry users have the advantage of using a single open source standard for all types of telemetry signals as OpenTelemetry aslo supports logs and metrics.
- Zipkin provides client libraries in popular languages like C#, Go, Java, Javascript, Ruby, Scala, PHP, etc. There are also a lot of community supported libraries that you can use for instrumenting specific frameworks.
Both Jaeger and Zipkin support out-of-box instrumentation for a lot of popular frameworks. Jaeger is also compatible with Zipkin's API. That means you can use instrumentation libraries of Zipkin with Jaeger.
Jaeger's 3rd party supported frameworks
Zipkin's 3rd party supported frameworks
Collectors
Telemetry data collected by the instrumentation libraries are sent to a collector in both Jaeger and Zipkin. Jaeger's collectors validate traces, index them, perform any transformations, and finally stores them. Zipkin collector too validates and indexes the collected trace data for lookups.
Query Service and Web UI
Zipkin provides a JSON API for finding and retrieving traces. Jaeger provides stateless service API endpoints which are typically run behind a load balancer, such as NGINX.
The consumer of the query service is a Web UI in both Jaeger and Zipkin, which is used to visualize trace data by a user.
Database storage
Both Jaeger and Zipkin provide pluggable storage backends for trace data. Cassandra and Elasticsearch are the primarily supported storage backends by Jaeger.
Zipkin was originally built to store data in Cassandra, but it later started supporting Elasticsearch and MySQL too.
Understanding Jaeger: Features and Capabilities
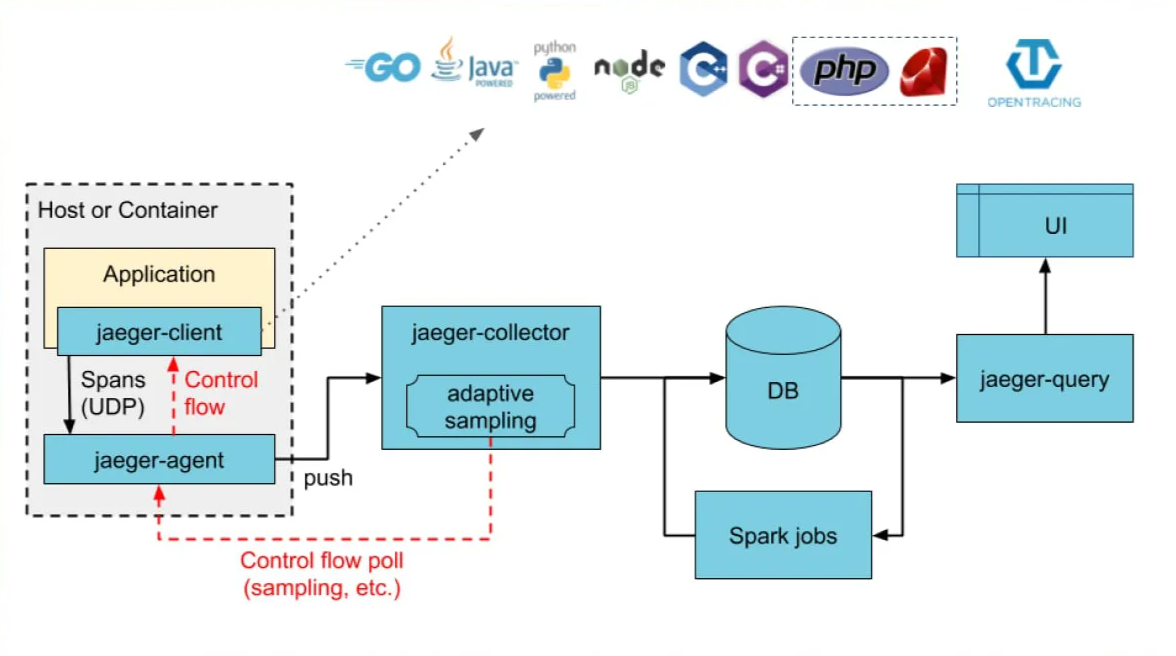
Jaeger, developed by Uber and later donated to the Cloud Native Computing Foundation (CNCF), is a powerful distributed tracing system designed for microservices-based architectures.
Key components of Jaeger:
- Client Libraries: Instrument your application code to generate traces.
- Agents: Collect traces from client libraries and forward them to collectors.
- Collectors: Receive traces, process them, and store them in a backend.
- Query Service: Retrieve trace data from storage for analysis and visualization.
Jaeger's architecture is designed for scalability and resilience. It uses a pull-based model where agents buffer traces locally before sending them to collectors, reducing the risk of data loss during network issues.
Unique features of Jaeger:
- Adaptive Sampling: Dynamically adjust sampling rates based on traffic patterns.
- Data Pipeline: Support for various storage backends, including Elasticsearch and Cassandra.
- Service Performance Monitoring: Aggregate trace data to provide service-level metrics.
Jaeger's Language Support and Integrations
Jaeger offers client libraries for multiple programming languages, including:
- Java
- Go
- Python
- Node.js
- C++
- C#
Popular frameworks and libraries that integrate with Jaeger:
- Spring Boot
- gRPC
- Dropwizard
- Express.js
Jaeger's instrumentation process is relatively straightforward, with many frameworks offering built-in support or easy-to-use middleware.
Exploring Zipkin: Features and Capabilities
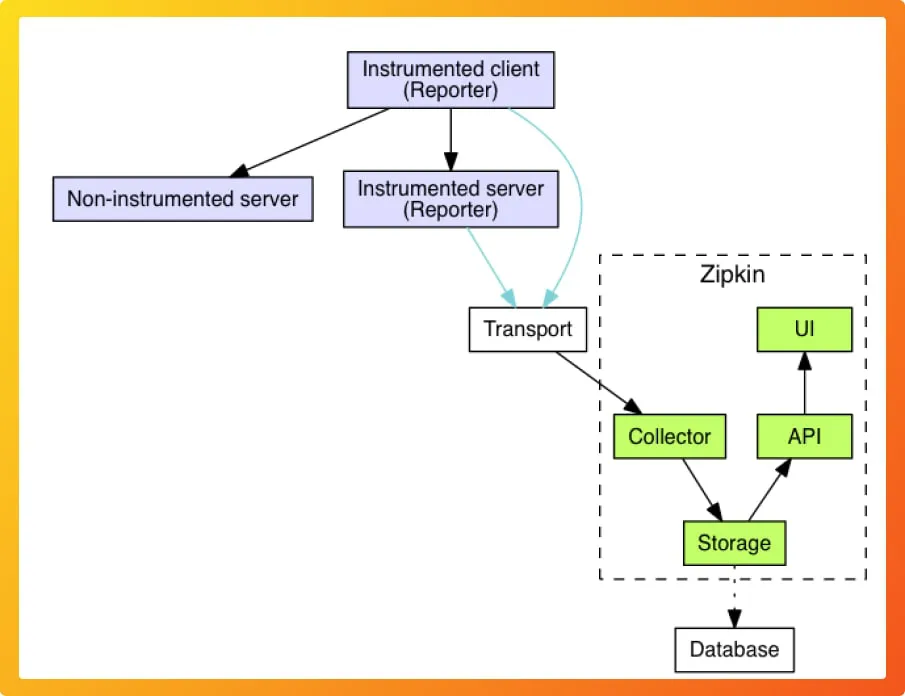
Zipkin, originally developed by Twitter, is another open-source distributed tracing system that has gained popularity due to its simplicity and ease of use.
Core components of Zipkin:
- Collectors: Gather trace data from various sources.
- Storage: Store trace data (supports in-memory, MySQL, Cassandra, and Elasticsearch).
- Query Service: API for retrieving trace data.
- Web UI: Visualize and analyze traces.
Zipkin's architecture is designed to be lightweight and easy to set up. It uses a push-based model where instrumented applications send trace data directly to collectors.
Distinctive features of Zipkin:
- Quick Setup: Can be run as a single Java executable for rapid prototyping.
- Flexible Data Model: Supports both synchronous and asynchronous workflows.
- Built-in UI: Offers a user-friendly interface for trace analysis out of the box.
Zipkin's Language Support and Integrations
Zipkin provides official client libraries for:
- Java
- JavaScript
- Ruby
- C#
- Go
- PHP
Frameworks and libraries compatible with Zipkin:
- Spring Cloud Sleuth
- Finagle
- Brave
- OpenTracing API
Adding Zipkin instrumentation to existing applications is often as simple as including a client library and configuring a few parameters.
Jaeger vs Zipkin: Head-to-Head Comparison
When comparing Jaeger and Zipkin, several factors come into play:
- Scalability and Performance:
- Jaeger: Designed for high scalability, with support for multiple storage backends.
- Zipkin: Lightweight and efficient, but may require additional setup for very large-scale deployments.
- User Interface and Data Visualization:
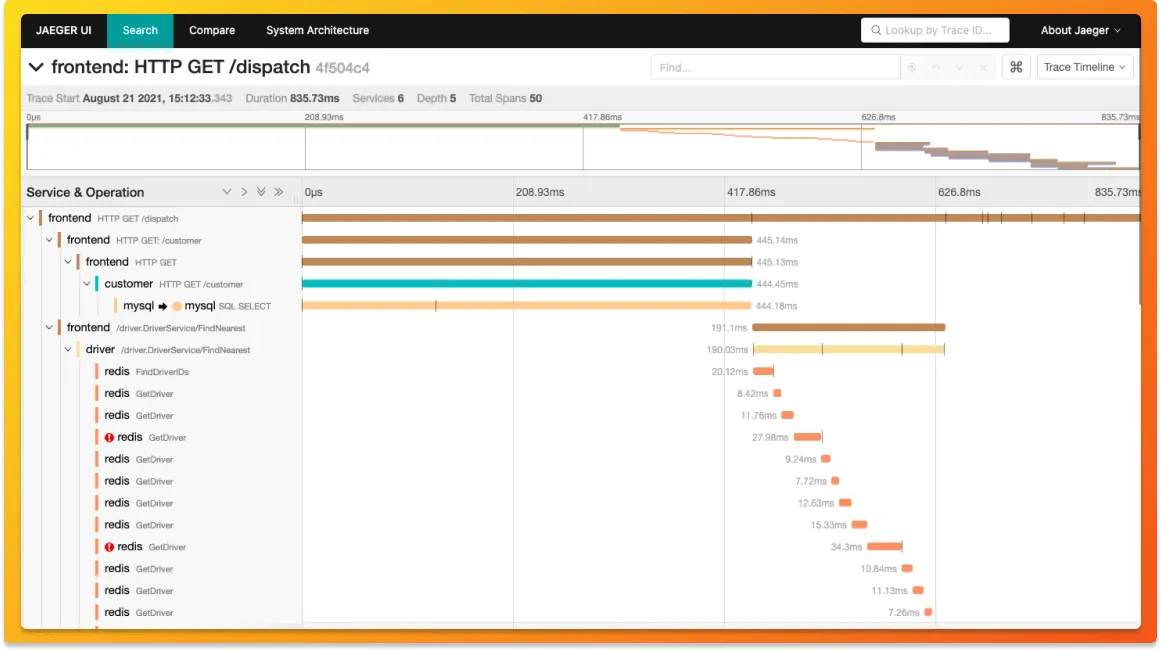
- Jaeger: Offers a modern, feature-rich UI with advanced querying capabilities.
- Zipkin: Provides a simpler, more straightforward UI that's easy to navigate.
- Deployment Options:
- Jaeger: Supports various deployment models, including sidecar and daemonset patterns in Kubernetes.
- Zipkin: Can be deployed as a single instance or distributed across multiple nodes.
- Community Support and Ecosystem:
- Jaeger: Backed by CNCF, with a large and active community.
- Zipkin: Has a mature ecosystem with a wide range of language-specific libraries.
Choosing Between Jaeger and Zipkin
Factors to consider when selecting a tracing tool:
- Scale of your system: For large, complex microservices architectures, Jaeger's scalability might be advantageous.
- Existing technology stack: Consider which tool integrates better with your current frameworks and libraries.
- Team expertise: Evaluate your team's familiarity with each tool and its ecosystem.
- Future growth: Think about how your observability needs might evolve as your system grows.
Scenarios where Jaeger might be the better choice:
- Large-scale distributed systems with high trace volume
- Organizations heavily invested in the Kubernetes ecosystem
- Projects requiring advanced querying and analysis capabilities
Use cases where Zipkin could be more suitable:
- Smaller to medium-sized microservices architectures
- Teams looking for a quick and easy setup process
- Projects with simpler tracing requirements
Both Jaeger and Zipkin are strong contenders when it comes to a distributed tracing tool. But are traces enough to solve all performance issues of a modern distributed application? The answer is no. You also need metrics and a way to correlate metrics with traces with a single dashboard. Most SaaS vendors provide both metrics and traces under a single pane of glass. But the beauty of Jaeger and Zipkin is that they are open-source. What if an open-source solution does both and comes with a great web UI with actionable insights for your engineering teams?
That's where SigNoz comes into the picture.
Advanced Tracing with SigNoz: A Modern Alternative
While Jaeger and Zipkin are excellent tracing tools, SigNoz offers a comprehensive observability platform that combines distributed tracing with metrics and logs.
Key features of SigNoz:
- Full-Stack Observability: Unified view of traces, metrics, and logs.
- OpenTelemetry Native: Built from the ground up to support OpenTelemetry standards.
- Advanced Visualization: Rich, interactive dashboards for deep analysis.
- Customizable Alerts: Set up alerts based on trace data and service performance.

- Eliminating the need for multiple tools for different observability signals
- Providing context-rich visualizations that speed up troubleshooting
- Offering a more cost-effective solution compared to proprietary SaaS platforms
SigNoz Cloud is the easiest way to run SigNoz. Sign up for a free account and get 30 days of unlimited access to all features.

You can also install and self-host SigNoz yourself since it is open-source. With 24,000+ GitHub stars, open-source SigNoz is loved by developers. Find the instructions to self-host SigNoz.
Implementing Distributed Tracing: Best Practices
Regardless of the tool you choose, follow these best practices for effective distributed tracing:
- Strategic Instrumentation:
- Focus on critical paths and high-value transactions.
- Use automatic instrumentation where possible to reduce manual effort.
- Consistent Naming Conventions:
- Adopt a standardized approach to naming spans and services.
- Use clear, descriptive names that reflect the operation being performed.
- Effective Sampling:
- Implement intelligent sampling strategies to balance data volume and insight.
- Consider using different sampling rates for different types of requests.
- Context Propagation:
- Ensure trace context is properly passed between services, especially across different protocols.
- Use standard headers like W3C Trace Context for interoperability.
- Performance Considerations:
- Monitor the overhead of tracing on your application.
- Use asynchronous reporting to minimize impact on request latency.
- Data Retention and Storage:
- Define appropriate retention periods for trace data.
- Choose a storage backend that balances query performance with cost.
- Integration with Other Observability Tools:
- Correlate traces with logs and metrics for a complete picture.
- Use trace IDs in logs to easily jump between different data sources.
Future of Distributed Tracing
The landscape of distributed tracing continues to evolve:
- AI-Powered Analysis: Machine learning algorithms will increasingly be used to detect anomalies and predict issues based on trace data.
- Unified Observability: The lines between tracing, metrics, and logging will continue to blur, with platforms offering more integrated experiences.
- Edge Computing: Tracing tools will adapt to handle the unique challenges of edge and IoT environments.
- Privacy and Compliance: As systems process more sensitive data, tracing tools will need to address data protection regulations.
- OpenTelemetry Dominance: OpenTelemetry is likely to become the de facto standard for instrumentation, potentially influencing the evolution of tools like Jaeger and Zipkin.
FAQs
What are the main differences between Jaeger and Zipkin?
The main differences lie in their architecture, scalability, and feature set. Jaeger is designed for large-scale deployments with advanced querying capabilities, while Zipkin offers a simpler setup and lightweight architecture.
Can Jaeger and Zipkin be used together in the same system?
Yes, it's possible to use both tools in the same system, especially when transitioning from one to the other. However, this approach may introduce additional complexity and is generally not recommended for long-term use.
How do Jaeger and Zipkin compare in terms of performance?
Both tools are designed to handle high volumes of trace data. Jaeger may have an edge in very large-scale deployments, while Zipkin's lightweight nature can be advantageous in smaller systems. Actual performance will depend on your specific use case and configuration.
Is it possible to migrate from Zipkin to Jaeger or vice versa?
Migration between the two systems is possible, especially if you're using OpenTelemetry for instrumentation. However, it requires careful planning to ensure data consistency and may involve adjusting your instrumentation and analysis processes.
What are the main differences between Jaeger and Zipkin?
Jaeger and Zipkin are both open-source distributed tracing tools, but they differ in several aspects. Jaeger, developed by Uber, is designed for high scalability and offers advanced querying capabilities. It's well-suited for large-scale microservices architectures. Zipkin, originally developed by Twitter, is known for its simplicity and ease of setup. It's more lightweight and may be preferable for smaller to medium-sized systems.
How do Jaeger and Zipkin compare in terms of language support?
Both Jaeger and Zipkin offer support for multiple programming languages. Jaeger provides client libraries for Java, Go, Python, Node.js, C++, and C#. Zipkin offers official client libraries for Java, JavaScript, Ruby, C#, Go, and PHP. Both tools also have extensive community support for various frameworks and libraries.
Which tool is better for Kubernetes environments?
Jaeger is generally considered a better choice for Kubernetes environments. It's backed by the Cloud Native Computing Foundation (CNCF) and offers various deployment options optimized for Kubernetes, including sidecar and daemonset patterns. This makes Jaeger more aligned with cloud-native architectures.
How do the storage options differ between Jaeger and Zipkin?
Both tools offer pluggable storage backends. Jaeger primarily supports Cassandra and Elasticsearch for trace data storage. Zipkin originally used Cassandra but now also supports Elasticsearch and MySQL. Jaeger's design allows for easier scaling of storage, which can be advantageous for larger deployments.
Can I use OpenTelemetry with both Jaeger and Zipkin?
Yes, both Jaeger and Zipkin are compatible with OpenTelemetry. Jaeger recommends using OpenTelemetry APIs and SDKs for generating traces, which provides the advantage of using a single open-source standard for all types of telemetry signals. Zipkin can also ingest data from OpenTelemetry-instrumented applications.
How do the user interfaces of Jaeger and Zipkin compare?
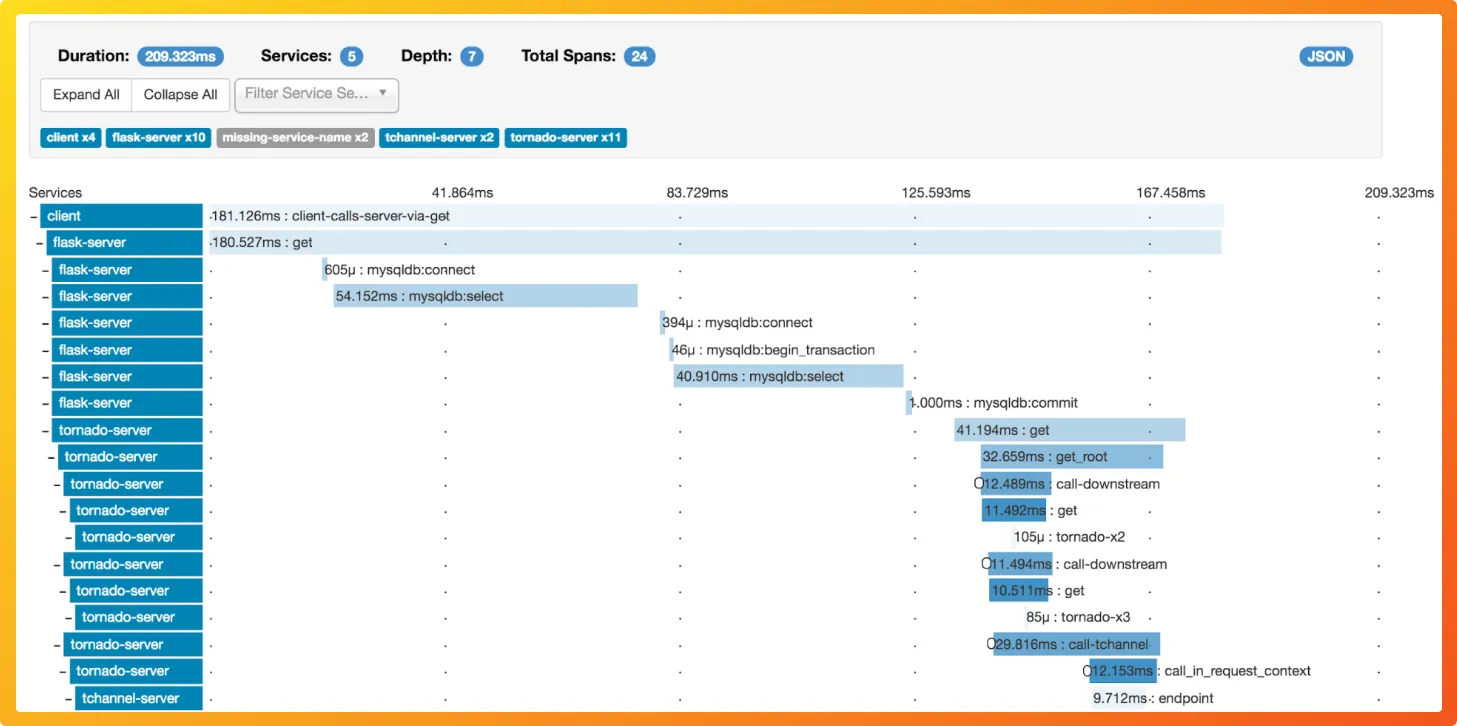
Jaeger offers a more modern and feature-rich UI with advanced querying capabilities. It provides detailed Gantt charts for visualizing traces. Zipkin's UI is simpler and more straightforward, which some users find easier to navigate. The choice between the two often comes down to personal preference and specific use case requirements.
Is it possible to migrate from one tool to the other?
Yes, it's possible to migrate between Jaeger and Zipkin, especially if you're using OpenTelemetry for instrumentation. However, migration requires careful planning to ensure data consistency and may involve adjusting your instrumentation and analysis processes. It's worth noting that Jaeger is compatible with Zipkin's API, which can ease the transition from Zipkin to Jaeger.
Related Content
