Kubectl Logs Tail | How to Tail Kubernetes Logs
The kubectl logs tail command is a tool that allows users to stream the logs of a pod in real-time while using Kubernetes. This command is particularly useful for debugging and monitoring applications, as it enables users to view log output as it is generated and quickly identify any issues or problems with their application.
In this article, we will see how to use the kubectl logs tail command to stream logs, the benefits of using the command, and an advanced tool for streaming logs.
Before we get started, let's quickly review some essential Kubernetes concepts.
What is kubectl?
Kubectl is the Kubernetes command-line tool that enables users to execute commands and interact with their Kubernetes cluster for everyday management tasks. With kubectl, users can perform various tasks related to the administration and maintenance of their cluster and applications, such as creating and updating deployments, scaling replicas, rolling out new features, etc.
What is the kubectl logs command?
The kubectl logs command is a useful tool for accessing and viewing the logs of pods in a Kubernetes cluster. With this command, you can retrieve the log output of a pod and display it in the terminal for inspection.
Syntax for the kubectl logs command usage:
kubectl logs [-f] [-p] (POD | TYPE/NAME) [-c CONTAINER] [options]
The kubectl logs command provides various flags that can be used to tailor its functionality to your needs.
Some common options for kubectl logs include:
--follow: Continuously stream the logs as they are generated.--tail: Specify the number of lines of log output to display.--since: Only show log output generated within a certain duration.--timestamps: Add timestamps to the log output.
A full list of all flag options by the command can be found on the official Kubernetes documentation page.

The tail flag
The tail flag can be used in conjunction with the kubectl logs command to stream the latest logs in real-time, rather than returning all the logs at once. It can be used to specify the number of log lines to show from the end of the logs for a specific container in a pod.
Let's look at different ways to use the tail command with the kubectl logs command:
Tail logs from cluster
Kubernetes cluster logs are logs generated from various components within a Kubernetes cluster but majorly the control plane components such as the API server, Scheduler, and Controller Manager. The Kubernetes control plane is the brain of the cluster, managing worker nodes and pods to ensure a healthy and functioning containerized application environment.
Collecting logs from the control plane is important as they provide information about the state and operations of the cluster.
Here’s how you can tail logs from the control plane components:
-
Tail logs from the API server
tail -f /var/log/kube-apiserver.log -
Tail logs from the Scheduler
tail -f /var/log/kube-scheduler.log -
Tail logs from the Controller Manager
tail -f /var/log/kube-controller-manager.log
The location of the log files may differ based on the Kubernetes cluster.
Tail logs from nodes
Nodes are worker machines that run the actual workloads, either as physical or virtual machines and are managed by the control plane. The worker node comprises three major components: the kubelet, container runtime, and kube-proxy.
Collecting logs from the nodes is important as they provide insights into the health and performance of individual nodes, including resource usage, system metrics, and any errors or warnings encountered during operation.
Here’s how you can tail logs from the node components:
-
Tail logs from the kubelet
tail -f /var/log/kubelet.log -
Tail logs from kube-proxy
tail -f /var/log/kube-proxy.log
Tail Logs from pods
Pods serve as a wrapper. They are used to group one or more containers and run them as a single unit. Collecting logs from pods is important as they provide valuable insights into the application running within these containers.
Here’s how you can tail logs from pods:
- Tail pod logs
If you want to tail the most recent [number] lines of output from a pod:
kubectl logs --tail=[number] [pod-name]
An example is shown below;
# Display only the most recent 10 lines of output in pod nginx
kubectl logs --tail=10 nginx

2023/01/05 08:16:27 [notice] 1#1: using the "epoll" event method
2023/01/05 08:16:27 [notice] 1#1: nginx/1.23.3
2023/01/05 08:16:27 [notice] 1#1: built by gcc 10.2.1 20210110 (Debian 10.2.1-6)
2023/01/05 08:16:27 [notice] 1#1: OS: Linux 5.15.0-52-generic
2023/01/05 08:16:27 [notice] 1#1: getrlimit(RLIMIT_NOFILE): 1048576:1048576
2023/01/05 08:16:27 [notice] 1#1: start worker processes
2023/01/05 08:16:27 [notice] 1#1: start worker process 30
2023/01/05 08:16:27 [notice] 1#1: start worker process 31
2023/01/05 08:16:27 [notice] 1#1: start worker process 32
2023/01/05 08:16:27 [notice] 1#1: start worker process 33
In the below example, the tail number has been set to 15
# Display only the most recent 15 lines of output in pod nginx
kubectl logs --tail=15 nginx

10-listen-on-ipv6-by-default.sh: info: Getting the checksum of /etc/nginx/conf.d/default.conf
10-listen-on-ipv6-by-default.sh: info: Enabled listen on IPv6 in /etc/nginx/conf.d/default.conf
/docker-entrypoint.sh: Launching /docker-entrypoint.d/20-envsubst-on-templates.sh
/docker-entrypoint.sh: Launching /docker-entrypoint.d/30-tune-worker-processes.sh
/docker-entrypoint.sh: Configuration complete; ready for start up
2023/01/05 08:16:27 [notice] 1#1: using the "epoll" event method
2023/01/05 08:16:27 [notice] 1#1: nginx/1.23.3
2023/01/05 08:16:27 [notice] 1#1: built by gcc 10.2.1 20210110 (Debian 10.2.1-6)
2023/01/05 08:16:27 [notice] 1#1: OS: Linux 5.15.0-52-generic
2023/01/05 08:16:27 [notice] 1#1: getrlimit(RLIMIT_NOFILE): 1048576:1048576
2023/01/05 08:16:27 [notice] 1#1: start worker processes
2023/01/05 08:16:27 [notice] 1#1: start worker process 30
2023/01/05 08:16:27 [notice] 1#1: start worker process 31
2023/01/05 08:16:27 [notice] 1#1: start worker process 32
2023/01/05 08:16:27 [notice] 1#1: start worker process 33
Tail logs from container
Containers are lightweight, self-contained units that provide a consistent way to package applications and their dependencies. Collecting logs from containers provides insight into the applications running in them to aid in troubleshooting.
Here’s how you can tail logs from containers:
Tail all containers log in a pod
If you want to tail the most recent [number] lines of output from “all containers” in the specified pod.
kubectl logs --tail=[number] --all-containers [pod-name]
Tail a specific container’s log in a pod
In a case where multiple containers are running in a pod, if you want to tail only the most recent [number] lines of output from a “specific container” in a specific pod:
kubectl logs --tail=[number] -c [container-name] [pod-name]
Tail logs with the “f” flag
If you want to tail the most recent [number] lines of output from a specific container in a pod, and continue to stream new log entries in real-time, you can make use of the -f flag.
kubectl logs --tail=[number] -f [pod-name] or
kubectl logs -f --tail=[number] [pod-name]
An example can be seen below;
kubectl logs -f --tail=10 queue

INFO | Apache ActiveMQ 5.14.3 (localhost, ID:queue-41599-1672906401588-0:1) started
INFO | For help or more information please see: <http://activemq.apache.org>
WARN | Store limit is 102400 mb (current store usage is 0 mb). The data directory: /apache-activemq-5.14.3/data/kahadb only has 31771 mb of usable space. - resetting to maximum available disk space: 31771 mb
WARN | Temporary Store limit is 51200 mb (current store usage is 0 mb). The data directory: /apache-activemq-5.14.3/data only has 31771 mb of usable space. - resetting to maximum available disk space: 31771 mb
INFO | No Spring WebApplicationInitializer types detected on classpath
INFO | ActiveMQ WebConsole available at <http://0.0.0.0:8161/>
INFO | ActiveMQ Jolokia REST API available at <http://0.0.0.0:8161/api/jolokia/>
INFO | Initializing Spring FrameworkServlet 'dispatcher'
INFO | No Spring WebApplicationInitializer types detected on classpath
INFO | jolokia-agent: Using policy access restrictor classpath:/jolokia-access.xml
Tail logs using the “since” flag
If you want to tail the most recent [number] lines of logs written in the past [duration], for example, 1h, from the container in the specified pod, you can use the since flag.
kubectl logs --tail=[number] --since=[duration] [pod-name]
An example is shown below
kubectl logs --tail=5 --since=1h nginx

2023/01/05 08:16:27 [notice] 1#1: start worker processes
2023/01/05 08:16:27 [notice] 1#1: start worker process 30
2023/01/05 08:16:27 [notice] 1#1: start worker process 31
2023/01/05 08:16:27 [notice] 1#1: start worker process 32
2023/01/05 08:16:27 [notice] 1#1: start worker process 33
Tail logs with the “p” flag
This is useful in the case of a container restart. If you want to tail the most recent [number] lines of output from a previously terminated container within a pod, you can make use of the p flag.
kubectl logs --tail=[number] -p [pod-name] or
kubectl logs -p --tail=[number] [pod-name]
An example is shown below;
kubectl logs -p --tail=10 queue

INFO | Connector mqtt stopped
INFO | Connector ws stopped
INFO | PListStore:[/apache-activemq-5.14.3/data/localhost/tmp_storage] stopped
INFO | Stopping async queue tasks
INFO | Stopping async topic tasks
INFO | Stopped KahaDB
INFO | Apache ActiveMQ 5.14.3 (localhost, ID:queue-39515-1672238886867-0:1) uptime 11 minutes
INFO | Apache ActiveMQ 5.14.3 (localhost, ID:queue-39515-1672238886867-0:1) is shutdown  INFO | Closing org.apache.activemq.xbean.XBeanBrokerFactory$1@5bcab519: startup date [Wed Dec 28 14:48:01 UTC 2022]; root of context hierarchy
INFO | Destroying Spring FrameworkServlet 'dispatcher'
Benefits of the kubectl logs tail command
The kubectl logs --tail command offers the ability to stream the most recent logs in real-time, making it an invaluable tool for debugging issues within a pod. By providing a live view of the logs as they are generated, this command enables users to quickly identify and troubleshoot problems as they arise. For instance, if an error is occurring in a container, kubectl logs --tail can be used to stream the logs and search for error messages or other indicators of the issue at hand.
In addition to its usefulness in debugging, kubectl logs --tail can also serve as a means of monitoring the output of long-running processes. By streaming the logs of such processes, users can track the progress of a task and identify any potential issues as they occur. This feature can be particularly helpful in keeping tabs on the status of tasks that take an extended period of time to complete.
Use cases of kubectl logs tail command
Here are some use cases where `kubectl logs tail`` command can be useful:
-
Debugging Application Issues: Quickly inspecting recent log entries to diagnose issues or errors in a specific pod.
-
Monitoring Real-Time Events: Observing real-time log outputs for applications during critical operations or deployments.
-
Troubleshooting Kubernetes System Components: Checking logs of Kubernetes system pods to diagnose cluster-level issues.
-
Quick Log Checks: Performing rapid, ad-hoc log inspections without the need for complex logging infrastructure.
-
Post-Deployment Verification: Verifying application behavior immediately after deployment by reviewing recent logs.
-
Incident Response: In the event of an incident, quickly tailing logs to understand recent changes or errors.
Limitations of kubectl logs tail
kubectl logs tail is a useful command for accessing and following the logs of a running container in a Kubernetes cluster. While it can be a convenient way to view and troubleshoot logs in real-time, it may not be the most efficient or comprehensive solution for managing logs in a production environment. These limitations include the lack of built-in features for organizing, storing, or analyzing logs, and the lack of options for filtering or highlighting specific log events. In addition, the command does not provide any alerting or notification capabilities and does not integrate with other tools or platforms for log management or analysis.
To overcome these limitations, consider using a third-party log management tool like SigNoz, which provides a centralized platform for storing, analyzing, and visualizing logs from multiple sources. SigNoz can help you to gain insights into the performance and health of your Kubernetes applications, and identify and resolve issues more efficiently.
Kubectl log analysis with SigNoz
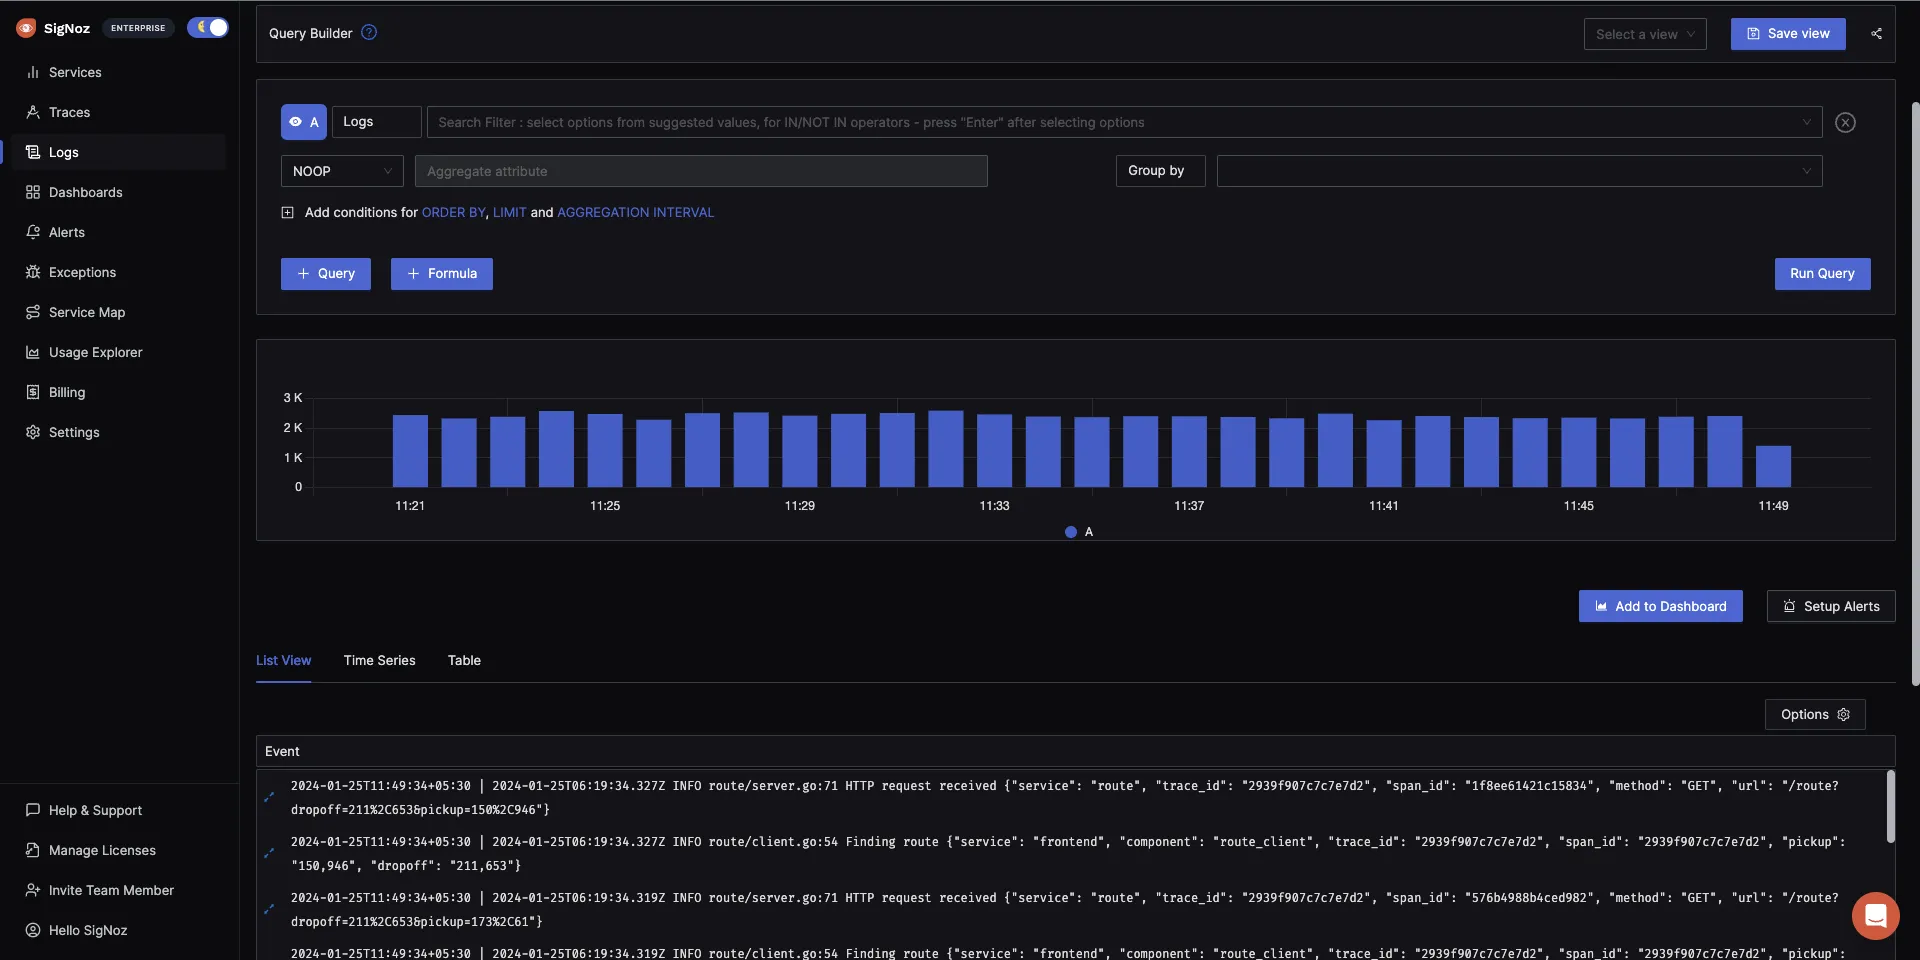
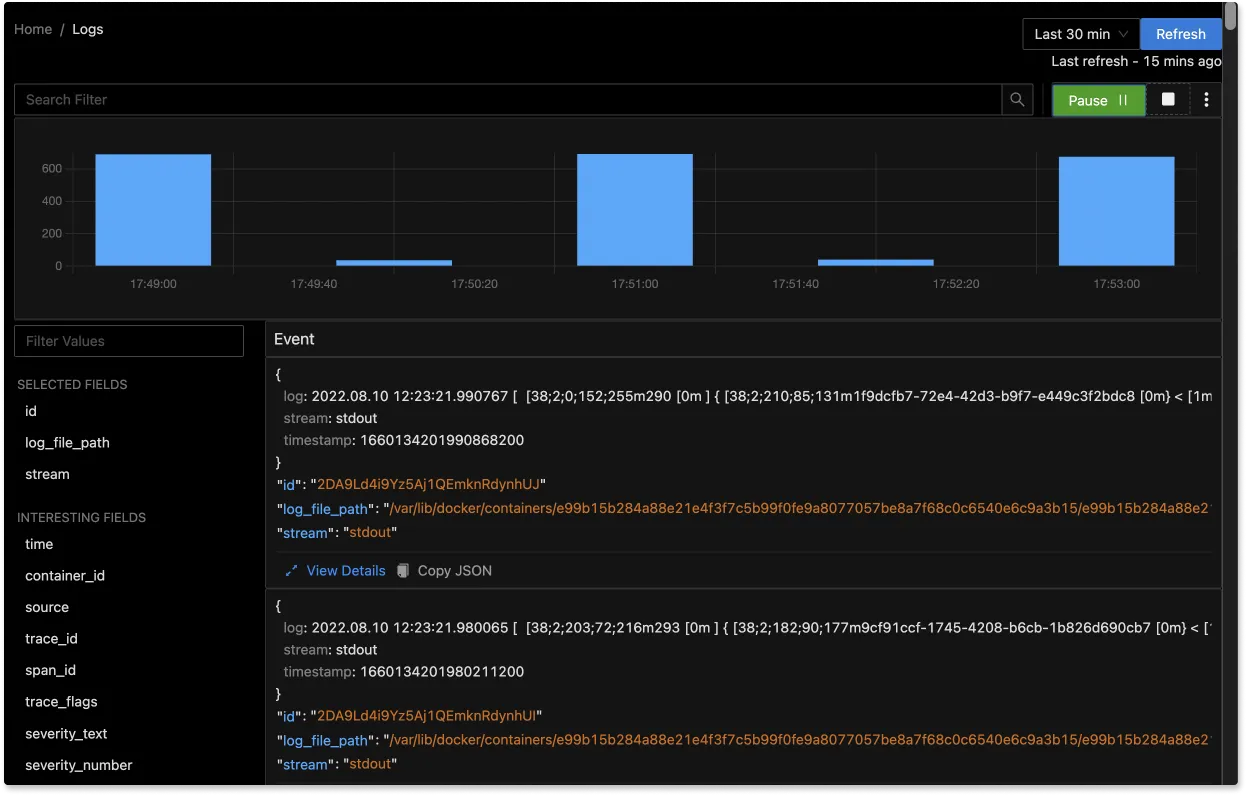
SigNoz is a cloud-native observability platform that provides comprehensive logs and metrics management and tracing capabilities for Kubernetes clusters. It offers a robust platform for log analysis and monitoring in Kubernetes clusters, making it easy to collect, search, analyze, and visualize logs generated by pods and containers.
One of the key features offered by SigNoz is the ability to analyze logs generated by kubectl. This is accomplished by forwarding the cluster logs to SigNoz, which then automatically ingests and indexes the logs. This allows users to query and analyze the logs in real-time through the SigNoz web interface or API.
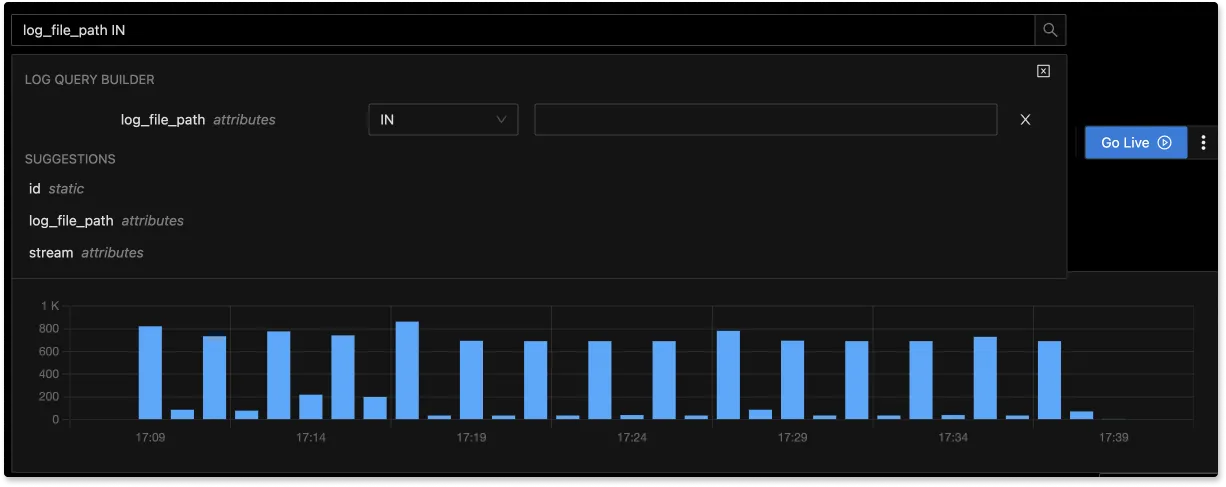
SigNoz's logs tab offers numerous advanced features, including a log query builder, the ability to search through multiple fields, a structured table view, and the option to view logs in JSON format.
With SigNoz, you have the ability to analyze logs in real-time, allowing for quick searching, filtering, and visualization as they are generated. This can aid in uncovering patterns, trends, and potential issues and resolving them in a timely manner.
The advanced Log Query Builder feature in SigNoz allows you to filter logs quickly by using a combination of different fields.
Getting started with SigNoz
SigNoz Cloud is the easiest way to run SigNoz. Sign up for a free account and get 30 days of unlimited access to all features.

You can also install and self-host SigNoz yourself since it is open-source. With 24,000+ GitHub stars, open-source SigNoz is loved by developers. Find the instructions to self-host SigNoz.
Related Posts
